MicroVision Announces First Quarter 2026 Results
Rhea-AI Summary
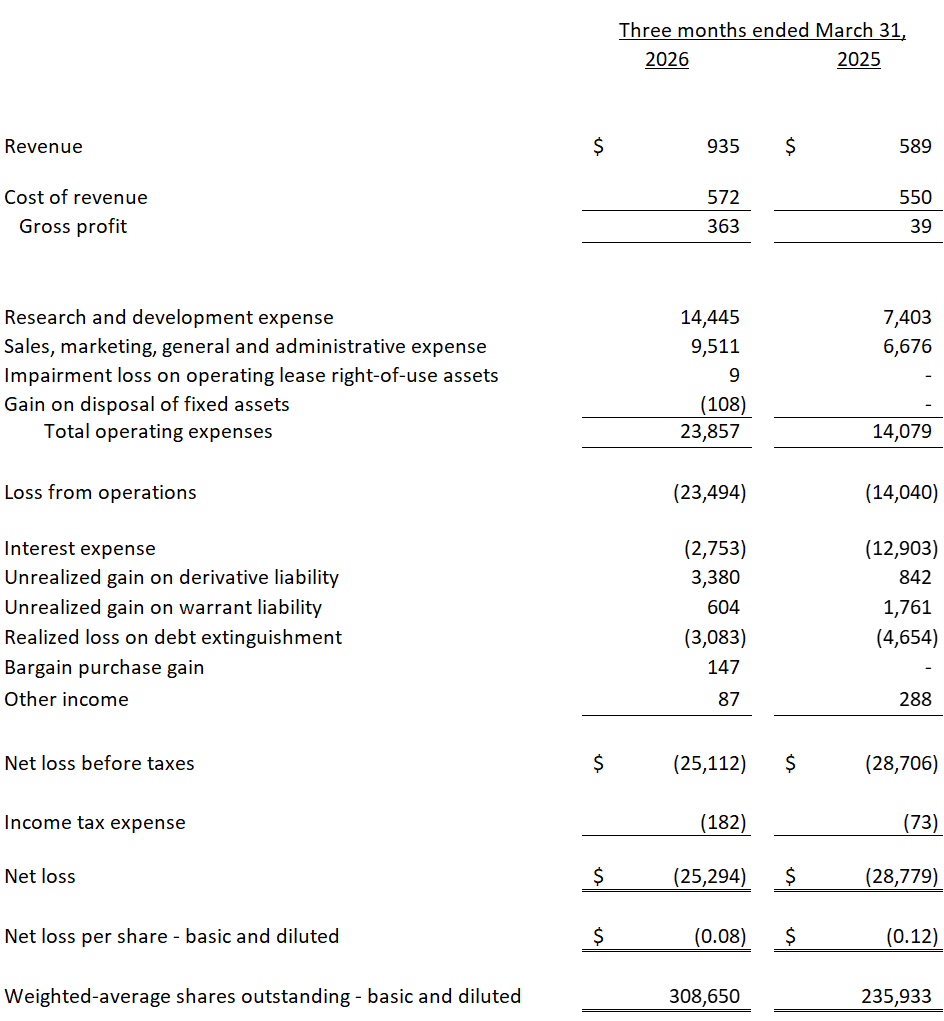
MicroVision (NASDAQ:MVIS) reported Q1 2026 revenue of $0.9 million, up from $0.6 million in Q1 2025, driven by higher sensor shipments. Net loss was $25.3 million ($0.08/share) versus $28.8 million ($0.12/share) a year earlier.
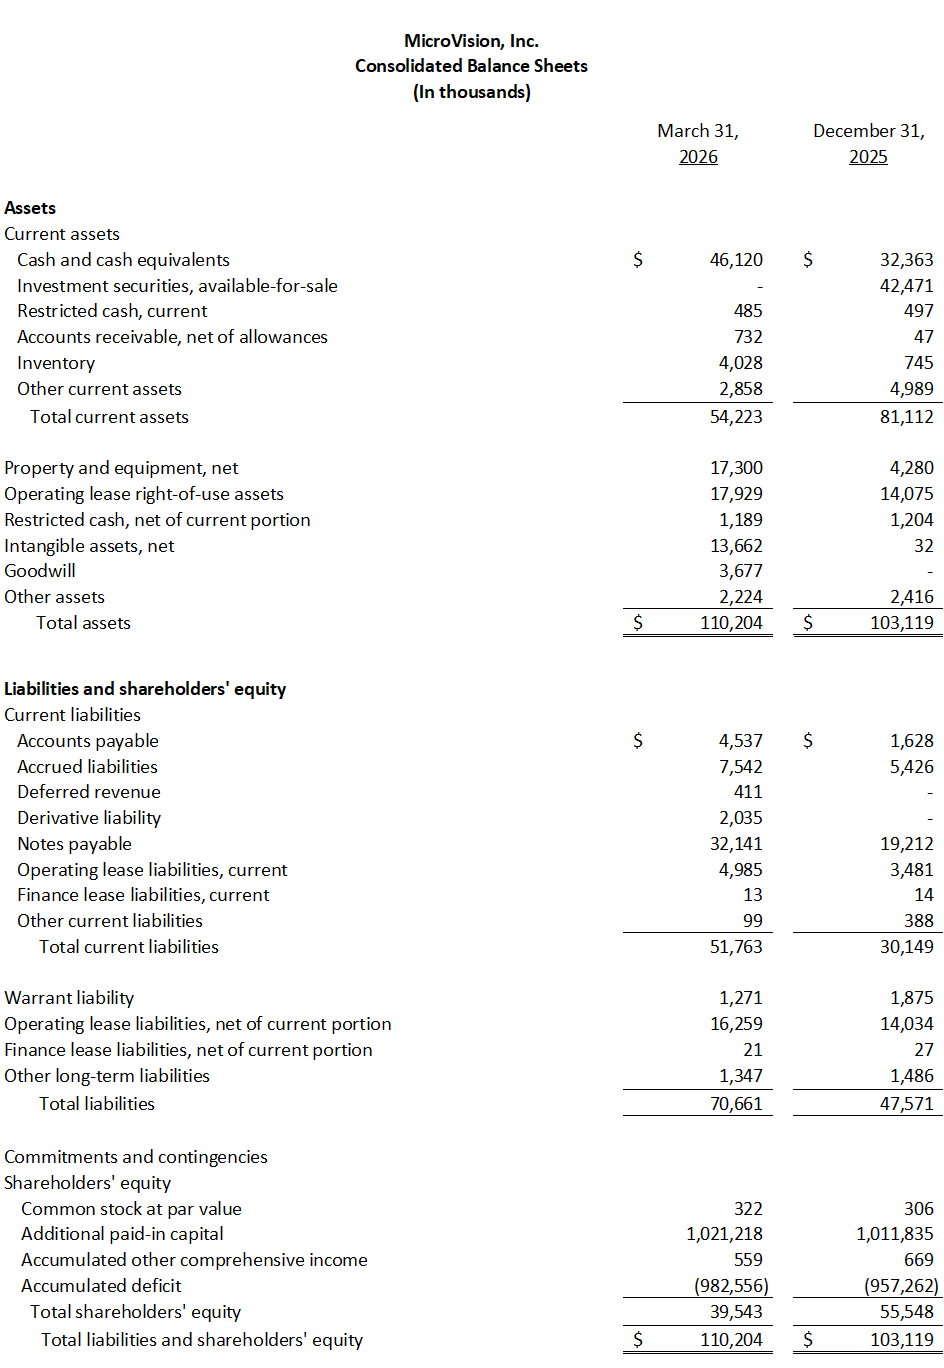
The company completed asset acquisitions from Luminar Technologies and Scantinel Photonics, adding 1550nm ToF and FMCW long-range lidar sensors and expanding its portfolio across short- to ultra-long-range solutions. Operating expenses rose to $23.9 million, largely from acquisition and integration costs, and cash and equivalents were $46.1 million at quarter-end.
Positive
- Q1 2026 revenue rose to $0.9M from $0.6M year over year
- Net loss narrowed to $25.3M from $28.8M versus Q1 2025
- Completed value-enhancing asset acquisitions from Luminar and Scantinel
- Expanded lidar portfolio with short-, mid-, long-, and ultra-long-range sensors
- Workforce reduced ~15% to streamline post-acquisition operating expenses
Negative
- Total operating expenses increased to $23.9M from $14.1M year over year
- Adjusted EBITDA loss widened to $17.2M from $10.7M in Q1 2025
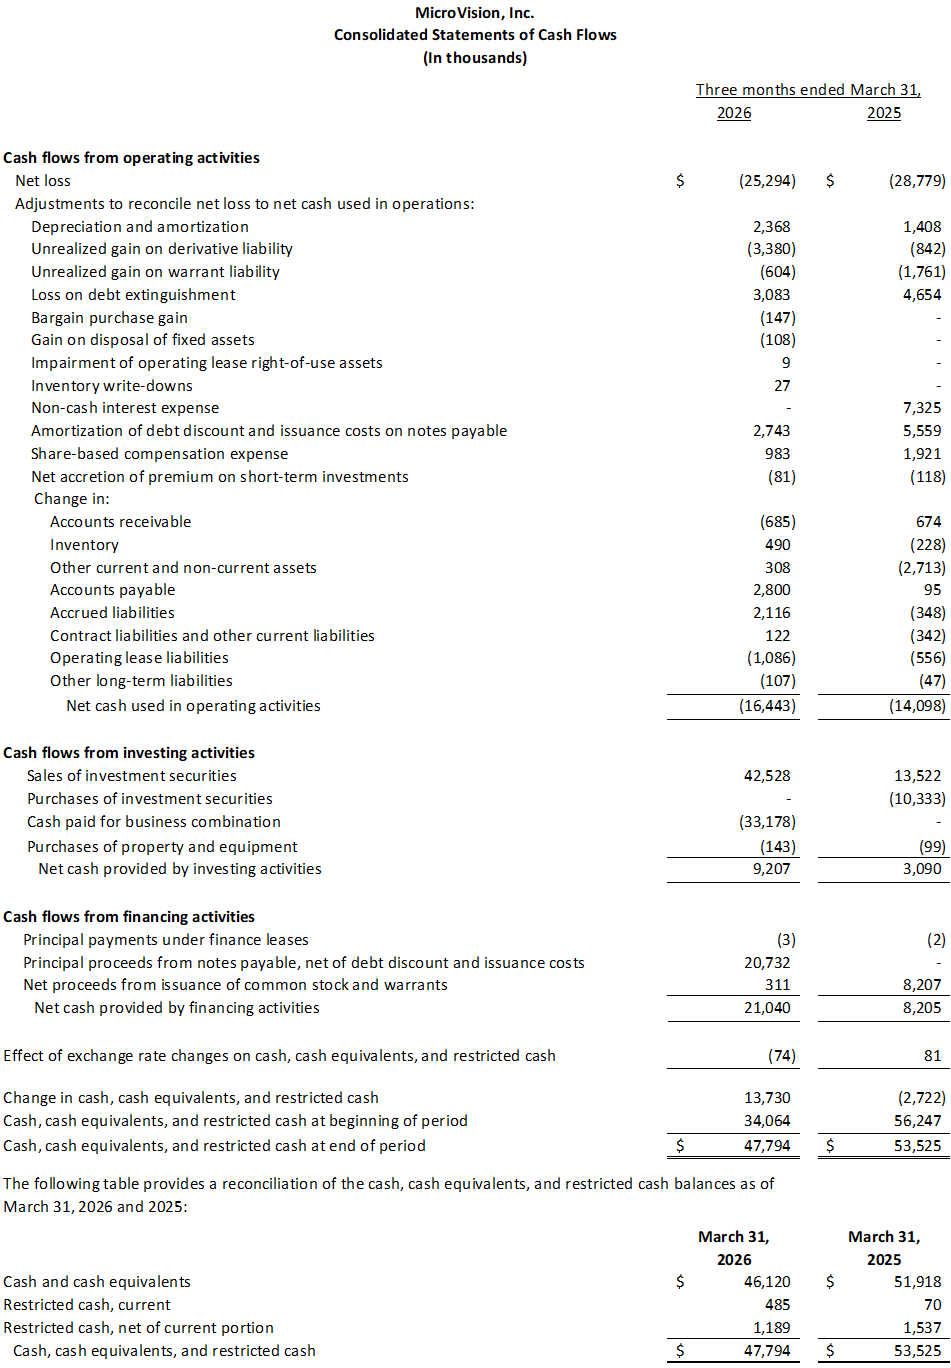
- Cash used in operations rose to $16.4M from $14.1M year over year
- Quarter-end cash and equivalents declined to $46.1M from $74.8M at 2025 year-end
News Market Reaction – MVIS
On the day this news was published, MVIS declined 21.12%, reflecting a significant negative market reaction. Argus tracked a peak move of +9.8% during that session. Argus tracked a trough of -19.8% from its starting point during tracking. Our momentum scanner triggered 35 alerts that day, indicating elevated trading interest and price volatility. This price movement removed approximately $70M from the company's valuation, bringing the market cap to $260.64M at that time. Trading volume was elevated at 2.5x the daily average, suggesting increased selling activity.
Data tracked by StockTitan Argus on the day of publication.
Key Figures
Previous Earnings Reports
| Date | Event | Sentiment | 24h Move | Catalyst |
|---|---|---|---|---|
| Mar 04 | Q4/FY 2025 results | Negative | -29.1% | Weak Q4 revenue, large net loss and impairment, new convertible notes. |
| Nov 11 | Q3 2025 results | Negative | -11.9% | Flat low revenue, operating losses, strategic initiatives and acquisition plans. |
| Aug 07 | Q2 2025 results | Negative | -1.8% | Revenue decline, operating loss, reliance on cash and capital access. |
| May 12 | Q1 2025 results | Negative | -11.6% | Revenue drop, large net loss with non-cash charges, capital needs highlighted. |
| Mar 26 | Q4/FY 2024 results | Negative | -6.5% | Revenue decline, substantial loss, new convertible facility and equity raise. |
24h Move is the share-price change in the day after each event; other market factors may also have contributed.
Earnings releases have consistently coincided with negative next-day price reactions, suggesting a pattern of investor caution around MVIS financial updates.
Over the last five earnings-related announcements, MicroVision has reported low quarterly revenues alongside sizable operating losses and ongoing capital-raising activity. Events on May 12, 2025, Aug 7, 2025, Nov 11, 2025, Mar 4, 2026, and Mar 26, 2025 all led to negative price reactions ranging from mid-single to high-twenties percentages. The new Q1 2026 report continues the theme of modest revenue, significant expenses, and balance-sheet-focused disclosures, fitting into this established earnings pattern.
Key Terms
lidar technical
fmcw technical
adjusted EBITDA financial
AI-generated analysis. How Rhea-AI works. Not financial advice.
REDMOND, WA / ACCESS Newswire / May 13, 2026 / MicroVision, Inc. (NASDAQ:MVIS), defining the next generation of lidar-based perception solutions, today announced its first quarter 2026 results.
Key Business and Operational Highlights
Completed value-enhancing asset acquisitions from Luminar Technologies and Scantinel Photonics, accelerating commercial strategy and expanding product portfolio with two 1550nm ToF long-range lidar sensors, IRIS and HALO, and a 1550nm FMCW ultra-long-range lidar sensor.
Advanced commercial momentum in the Industrial and Security & Defense sectors with new and repeating orders for MOVIA L short-range sensors, IRIS long-range sensors, and integrated software.
Redefined a new era for lidar, leading with a product portfolio that supports a wide array of applications in many verticals, open software that lowers system cost and expands capability, and high-quality solutions that perform at the right price.
Accelerated near-term revenue opportunities and amplified customer engagement, actively shipping sensors from existing and acquired inventory.
Expanded industry-leading product portfolio, with short-, mid-, long-, and ultra-long-range lidar solutions, featuring a mix of solid-state sensors with varying wavelengths, advanced sensor architectures, design-to-cost engineering, and open software solutions.
Streamlined post-acquisition operating expenses, with reduction in global workforce by approximately
15% and consolidation of engineering and operations functions from Redmond to Orlando location.
"We feel very good about our accelerating progress throughout the first quarter, establishing a strong foundation and boldly executing on our strategy to transform the lidar industry," said Glen DeVos, MicroVision's Chief Executive Officer. "Following the Q1 asset acquisitions from Luminar and Scantinel, we've successfully incorporated the technologies and products, integrated the teams, and streamlined operations. Our broad product portfolio, ready-to-ship sensor inventories, and diversified product roadmap have allowed us to stabilize and strengthen existing commercial relationships while building new opportunities and partnerships."
"We've taken on the challenge of redefining lidar, and it is exciting to see the future taking shape," concluded DeVos.
Key Financial Highlights for Q1 2026
Revenue for the first quarter of 2026 was
$0.9 million , compared to$0.6 million for the first quarter of 2025, primarily as a result of a greater volume of sensors shipped during the first quarter of 2026.Total operating expenses for the first quarter of 2026 were
$23.9 million , compared to$14.1 million for the first quarter of 2025, with the increase primarily relating to costs stemming from the acquisitions and related integration activities completed during the first quarter of 2026.Net loss for the first quarter of 2026 was
$25.3 million , or$0.08 per share, compared to a net loss of$28.8 million , or$0.12 per share, for the first quarter of 2025.Adjusted EBITDA for the first quarter of 2026 was a
$17.2 million loss, compared to a$10.7 million loss for the first quarter of 2025.Cash used in operations in the first quarter of 2026 was
$16.4 million , compared to cash used in operations in the first quarter of 2025 of$14.1 million .The Company ended the first quarter of 2026 with
$46.1 million in cash and cash equivalents, including investment securities, compared to$74.8 million at December 31, 2025.
Upcoming Investor Events
Management will participate in the Deutsche Bank Securities Global Autos, Mobility & Robotics Conference, May 19 - 20, 2026 in New York City.
Conference Call and Webcast: Q1 2026 Results
MicroVision will host a conference call and webcast, consisting of prepared remarks by management and a question-and-answer session at 1:30 PM PT/4:30 PM ET on Wednesday, May 13, 2026 to discuss the financial results and provide a business update. Analysts and investors may pose questions to management during the live webcast on May 13, 2026.
The live webcast can be accessed on the Company's Investor Relations website under the Events tab HERE. The webcast will be archived on the website for future viewing.
About MicroVision
MicroVision is defining the next generation of lidar-based perception solutions for automotive, industrial, and security & defense markets. As the industry moves beyond proof of concept toward value, deployment, and commercialization, MicroVision delivers integrated hardware and software solutions designed for real-world performance, automotive-grade reliability, and economic scalability. With engineering centers in the U.S. and Germany, MicroVision leads the industry in depth and breadth of its portfolio, with both short- and long-range lidar solutions, featuring solid-state sensors with varying wavelengths, advanced sensor architectures, design-to-cost engineering, and open software solutions.
For more information, visit the Company's website at www.microvision.com, on Facebook at www.facebook.com/microvisioninc, and LinkedIn at https://www.linkedin.com/company/microvision/.
MicroVision, MAVIN, MOSAIK, MOVIA, IRIS, and SENTINEL are trademarks of MicroVision, Inc. in the United States and other countries. All other trademarks are the properties of their respective owners.
Non-GAAP information
To supplement MicroVision's condensed financial statements presented in accordance with GAAP, the Company presents investors with the non-GAAP financial measures "adjusted EBITDA" and "adjusted Gross Profit." Adjusted EBITDA consists of GAAP net income (loss) excluding the impact of the following: interest income and interest expense; income tax expense; depreciation and amortization; non-cash gains and losses; share-based compensation; restructuring costs; severance expense; and impairment charges. Adjusted Gross Profit is calculated as GAAP gross profit before share-based compensation expense and the amortization of acquired intangibles included in cost of revenue.
MicroVision believes that the presentation of adjusted EBITDA and adjusted Gross Profit provides important supplemental information to management and investors regarding financial and business trends, provides consistency and comparability with MicroVision's past financial reports, and facilitates comparisons with other companies in the Company's industry, many of which use similar non-GAAP financial measures to supplement their GAAP results. Internally, management uses these non-GAAP measures when evaluating operating performance because the exclusion of the items described above provides an additional useful measure of the Company's operating results and facilitates comparisons of the Company's core operating performance against prior periods and its business objectives. Externally, the Company believes that adjusted EBITDA and adjusted Gross Profit are useful to investors in their assessment of MicroVision's operating performance and the valuation of the Company.
Adjusted EBITDA and adjusted Gross Profit are not calculated in accordance with GAAP, and should be considered supplemental to, and not as a substitute for, or superior to, financial measures calculated in accordance with GAAP. Non-GAAP financial measures have limitations in that they do not reflect all of the costs associated with the operations of MicroVision's business as determined in accordance with GAAP. The Company expects to continue to incur expenses similar to the non-GAAP adjustments described above, and exclusion of these items from its non-GAAP financial measures should not be construed as an inference that these costs are unusual or infrequent.
The Company compensates for limitations of the adjusted EBITDA measure by prominently disclosing GAAP net income (loss), which the Company believes is the most directly comparable GAAP measure, and providing investors with a reconciliation from GAAP net income (loss) to adjusted EBITDA.
Similarly for adjusted Gross Profit, the Company compensates for limitations of the measure by prominently disclosing GAAP gross profit which is the difference between Revenue and Cost of revenue, which the Company believes is the most directly comparable GAAP measure, and providing investors with a reconciliation by backing out share-based compensation expense and the amortization of acquired intangibles included in cost of revenue.
Forward-Looking Statements
Certain statements contained in this release, including market position, expectations, and likelihood of success; opportunities for customer engagement and revenue; expense reduction; benefits of acquisitions and integration synergies; market position; product portfolio; product and manufacturing capabilities; transaction benefits; access to capital and capital-raising opportunities; and expected revenue, expenses and cash usage are forward-looking statements that involve a number of risks and uncertainties that could cause actual results to differ materially from those in the forward-looking statements. Factors that could cause actual results to differ materially from those projected in such forward-looking statements include the risk its ability to operate with limited cash or to raise additional capital when needed; market acceptance of its technologies and products or for products incorporating its technologies; the failure of its commercial partners to perform as expected under its agreements; its financial and technical resources relative to those of its competitors; its ability to keep up with rapid technological change; government regulation of its technologies; its ability to enforce its intellectual property rights and protect its proprietary technologies; the ability to obtain customers and develop partnership opportunities; the timing of commercial product launches and delays in product development; the ability to achieve key technical milestones in key products; dependence on third parties to develop, manufacture, sell and market its products; potential product liability claims; its ability to maintain its listing on The Nasdaq Stock Market, and other risk factors identified from time to time in the Company's SEC reports, including the Company's Annual Report on Form 10-K, Quarterly Reports on Form 10-Q and other reports filed with the SEC. These factors are not intended to represent a complete list of the general or specific factors that may affect the Company. It should be recognized that other factors, including general economic factors and business strategies, may be significant, now or in the future, and the factors set forth in this release may affect the Company to a greater extent than indicated. Except as expressly required by federal securities laws, the Company undertakes no obligation to publicly update or revise any forward-looking statements, whether as a result of new information, future events, changes in circumstances or any other reason.
Investor Relations Contact
Jeff Christensen
Darrow Associates Investor Relations
MVIS@darrowir.com
Media Contact
Marketing@MicroVision.com
MicroVision, Inc.
Consolidated Statements of Operations
(In thousands, except per share data)
MicroVision, Inc.
Reconciliation of GAAP to Non-GAAP Measures
(In thousands)

SOURCE: MicroVision, Inc.
View the original press release on ACCESS Newswire