DAT: Truckload spot rates gained in May on robust van and reefer volumes
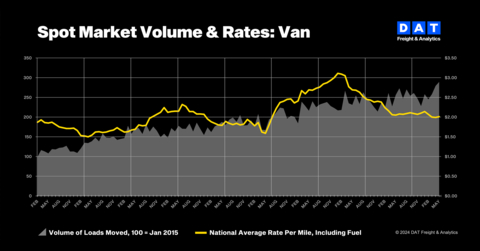
In May, DAT Freight & Analytics reported a significant increase in spot truckload rates due to higher volumes of van and refrigerated (reefer) freight. The DAT Truckload Volume Index (TVI) for vans reached 289, a 4% increase from April, and the reefer TVI hit 224, also up 4% month-over-month. Flatbed TVI, however, declined by 2% to 301. Compared to May 2023, van and reefer TVI numbers surged 13% and 25%, respectively.
Spot rates for van and reefer freight rose to $2.01/mile and $2.41/mile, while the flatbed rate remained at $2.52/mile. Line-haul rates, excluding fuel surcharges, also increased across all equipment types. The national average van line-haul rate grew to $1.58/mile, reefer to $1.94/mile, and flatbed to $2.01/mile.
Load-to-truck ratios for vans and reefers also climbed, indicating tighter truckload capacity. The van ratio rose to 4.4, and the reefer ratio to 6.3. However, the flatbed ratio slightly decreased to 18.0.
- Van TVI increased by 4% to 289 in May.
- Reefer TVI rose by 4% to 224 in May.
- Van TVI surged 13% compared to May 2023.
- Reefer TVI increased 25% compared to May 2023.
- Spot van rate grew by 2 cents to $2.01 per mile.
- Spot reefer rate increased by 9 cents to $2.41 per mile.
- Van line-haul rate climbed 5 cents to $1.58 per mile.
- Reefer line-haul rate rose 9 cents to $1.94 per mile.
- Load-to-truck ratio for vans increased to 4.4.
- Load-to-truck ratio for reefers rose to 6.3.
- Flatbed TVI fell by 2% to 301 in May.
- National average rates for contracted van freight declined by 2 cents to $2.43 per mile.
- National average rates for contracted reefer freight dropped by 3 cents to $2.79 per mile.
- Flatbed load-to-truck ratio slightly decreased to 18.0.
Insights
The increase in spot truckload rates for van and refrigerated (reefer) freight in May highlights a notable shift in the freight market dynamics. The rise in rates, despite being modest, suggests a tightening of truckload capacity driven by higher demand for seasonal produce and retail goods. Additionally, external events such as the Roadcheck inspection event and Memorial Day holiday likely exacerbated the capacity constraints.
From a financial perspective, the increase in spot rates could positively impact the revenue of carriers operating in these segments. Higher spot rates translate to increased per-mile earnings, which can boost overall profitability, especially if these rates sustain over a longer period. Conversely, the decline in contract rates indicates potential pricing power erosion for shippers with long-term agreements, possibly leading to renegotiations.
Retail investors should pay attention to how these rate changes affect the financial performance of publicly traded companies in the logistics and transportation sector. Companies with a higher exposure to the spot market may report better earnings, whereas those heavily reliant on contracted agreements might face margin pressures.
The DAT Truckload Volume Index (TVI) data provides valuable insights into freight dynamics. The significant year-over-year increases in the van (13%) and reefer (25%) TVI numbers indicate robust demand in these segments. This upsurge can be attributed to seasonal factors and the ongoing economic recovery driving consumer spending and the need for faster replenishment cycles.
The rise in the load-to-truck ratios for vans (up to 4.4) and reefers (up to 6.3) suggests that the market is currently in a shipper's market, where demand for freight services outpaces supply. This scenario typically leads to higher spot rates as shippers compete for limited capacity. The decline in the flatbed ratio, however, indicates a potential softening in the industrial and construction sectors, which utilize flatbed trucks extensively.
Retail investors should consider these trends in their broader market context. Increased demand for van and reefer freight services could signal a strong retail and agricultural sector performance, while the flatbed segment's decline might point to slower industrial activities.
DAT: Truckload spot rates gained in May on robust van and reefer volumes (Graphic: DAT Freight & Analytics)
The DAT Truckload Volume Index (TVI), an indicator of loads moved during a given month, hit all-time highs for van and refrigerated (“reefer”) loads:
-
Van TVI: 289, up
4% from April -
Reefer TVI: 224, a
4% increase month over month -
Flatbed TVI: 301, down
2% from April
The van and reefer TVI numbers climbed
“Stronger van and reefer volumes are consistent with May, when shippers move seasonal produce and retail goods and truckload capacity tightens due to the Roadcheck inspection event and Memorial Day holiday,” said Ken Adamo, DAT Chief of Analytics. “Carrier attrition created further pressure on capacity.”
Spot rates reflected higher demand
Spot prices responded last month, with national average van and reefer line-haul rates within
-
Spot van:
per mile, up$2.01 2 cents -
Spot reefer:
a mile, up$2.41 9 cents -
Spot flatbed:
a mile, unchanged$2.52
Line-haul rates, which subtract an amount equal to an average fuel surcharge, increased for all three equipment types. The average van line-haul rate was
National average rates for contracted van and reefer freight declined compared to April:
-
Contract van rate:
per mile, down$2.43 2 cents -
Contract reefer rate:
a mile, down$2.79 3 cents -
Contract flatbed rate:
a mile, up$3.16 1 cent
Load-to-truck ratios edged higher
National average van and reefer load-to-truck ratios rose in May:
- Van ratio: 4.4, up from 1.9 in April, meaning there were 4.4 loads for every van truck on the DAT One marketplace
- Reefer ratio: 6.3, up from 4.8
- Flatbed ratio: 18.0, down from 18.5
Load-to-truck ratios reflect truckload supply and demand on the DAT One marketplace and indicate the pricing environment for spot truckload freight.
About the DAT Truckload Volume Index
The DAT Truckload Volume Index reflects the change in the number of loads with a pickup date during that month. A baseline of 100 equals the number of loads moved in January 2015, as recorded in DAT RateView, a truckload pricing database and analysis tool with rates paid on an average of 3 million loads per month.
DAT benchmark spot rates are derived from invoice data for hauls of 250 miles or more with a pickup date during the month reported. Line-haul rates subtract an amount equal to an average fuel surcharge.
About DAT Freight & Analytics
DAT Freight & Analytics operates both the largest truckload freight marketplace and truckload freight data analytics service in
Founded in 1978, DAT is a business unit of Roper Technologies (Nasdaq: ROP), a constituent of the Nasdaq 100, S&P 500, and Fortune 1000. DAT is headquartered in
View source version on businesswire.com: https://www.businesswire.com/news/home/20240618135924/en/
Annabel Reeves
Corporate Communications, DAT Freight & Analytics
PR@dat.com / annabel.reeves@dat.com; 503-501-0143
Source: DAT Freight & Analytics
FAQ
What were the DAT Truckload Volume Index (TVI) values for May 2024?
How much did the spot van rate increase in May 2024?
What was the national average spot rate for reefer freight in May 2024?
How did the load-to-truck ratios change for vans and reefers in May 2024?
Did the flatbed TVI increase or decrease in May 2024?
What were the line-haul rates for vans and reefers in May 2024?
What was the change in the contracted van rate in May 2024?
How did the spot flatbed rate fare in May 2024?