LexinFintech Holdings Ltd. Reports Fourth Quarter and Full Year 2024 Unaudited Financial Results
LexinFintech Holdings (NASDAQ: LX) has reported its Q4 and full-year 2024 financial results, showing improved profitability and asset quality. Q4 net income reached RMB363 million, up 17% quarter-over-quarter, marking the fourth consecutive quarter of improved profitability.
Key Q4 metrics include: total loan origination of RMB52 billion (2% QoQ increase), outstanding loan balance of RMB110 billion, and a 90-day+ delinquency ratio of 3.6%. Total operating revenue increased 4.3% YoY to RMB3,659 million.
For full-year 2024, the company reported: total operating revenue of RMB14,204 million (8.8% YoY increase), net income of RMB1,100 million (3.2% YoY increase), and total loan originations of RMB212 billion. The board approved a dividend of US$0.11 per ADS and announced an increased dividend payout ratio of 25% effective January 2025.
LexinFintech Holdings (NASDAQ: LX) ha riportato i risultati finanziari del quarto trimestre e dell'intero anno 2024, mostrando un miglioramento della redditività e della qualità degli attivi. Il reddito netto del Q4 ha raggiunto RMB363 milioni, con un aumento del 17% rispetto al trimestre precedente, segnando il quarto trimestre consecutivo di redditività migliorata.
I principali indicatori del Q4 includono: origini di prestiti totali di RMB52 miliardi (aumento del 2% QoQ), saldo dei prestiti in essere di RMB110 miliardi e un rapporto di insolvenza oltre i 90 giorni del 3,6%. Il fatturato operativo totale è aumentato del 4,3% su base annua, raggiungendo RMB3.659 milioni.
Per l'intero anno 2024, l'azienda ha riportato: fatturato operativo totale di RMB14.204 milioni (aumento dell'8,8% su base annua), reddito netto di RMB1.100 milioni (aumento del 3,2% su base annua) e origini totali di prestiti di RMB212 miliardi. Il consiglio ha approvato un dividendo di US$0,11 per ADS e ha annunciato un aumento del rapporto di distribuzione dei dividendi al 25% a partire da gennaio 2025.
LexinFintech Holdings (NASDAQ: LX) ha informado sus resultados financieros del cuarto trimestre y del año completo 2024, mostrando una mejora en la rentabilidad y la calidad de los activos. El ingreso neto del Q4 alcanzó RMB363 millones, un aumento del 17% en comparación con el trimestre anterior, marcando el cuarto trimestre consecutivo de rentabilidad mejorada.
Los principales indicadores del Q4 incluyen: origen total de préstamos de RMB52 mil millones (aumento del 2% QoQ), saldo de préstamos pendientes de RMB110 mil millones y una tasa de morosidad de más de 90 días del 3.6%. Los ingresos operativos totales aumentaron un 4.3% interanual, alcanzando RMB3,659 millones.
Para el año completo 2024, la empresa reportó: ingresos operativos totales de RMB14,204 millones (aumento del 8.8% interanual), ingreso neto de RMB1,100 millones (aumento del 3.2% interanual) y orígenes totales de préstamos de RMB212 mil millones. La junta aprobó un dividendo de US$0.11 por ADS y anunció un aumento en la tasa de distribución de dividendos al 25% a partir de enero de 2025.
LexinFintech Holdings (NASDAQ: LX)는 2024년 4분기 및 전체 연도 재무 결과를 발표하며 수익성과 자산 품질이 개선되었음을 보여주었습니다. 4분기 순이익은 RMB363백만에 달하며, 전분기 대비 17% 증가하여 수익성이 4분기 연속 개선되었습니다.
4분기의 주요 지표는 다음과 같습니다: 총 대출 원금 RMB52억 (전분기 대비 2% 증가), 미상환 대출 잔액 RMB110억, 90일 이상 연체 비율 3.6%. 총 운영 수익은 전년 대비 4.3% 증가하여 RMB3,659백만에 도달했습니다.
2024년 전체 연도에 대해 회사는 다음과 같은 결과를 보고했습니다: 총 운영 수익 RMB14,204백만 (전년 대비 8.8% 증가), 순이익 RMB1,100백만 (전년 대비 3.2% 증가), 총 대출 원금 RMB212억. 이사회는 ADS당 US$0.11의 배당금을 승인하고 2025년 1월부터 배당금 지급 비율을 25%로 증가시킬 것이라고 발표했습니다.
LexinFintech Holdings (NASDAQ: LX) a publié ses résultats financiers pour le quatrième trimestre et l'ensemble de l'année 2024, montrant une amélioration de la rentabilité et de la qualité des actifs. Le revenu net du Q4 a atteint RMB363 millions, en hausse de 17% par rapport au trimestre précédent, marquant le quatrième trimestre consécutif d'amélioration de la rentabilité.
Les principaux indicateurs du Q4 incluent : un total de prêts d'origine de RMB52 milliards (augmentation de 2% QoQ), un solde de prêts en cours de RMB110 milliards et un ratio de défaut de plus de 90 jours de 3,6%. Le chiffre d'affaires total a augmenté de 4,3% par rapport à l'année précédente, atteignant RMB3,659 millions.
Pour l'année 2024, l'entreprise a rapporté : un chiffre d'affaires total de RMB14,204 millions (augmentation de 8,8% par rapport à l'année précédente), un revenu net de RMB1,100 millions (augmentation de 3,2% par rapport à l'année précédente) et un total de prêts d'origine de RMB212 milliards. Le conseil d'administration a approuvé un dividende de 0,11 $ par ADS et a annoncé une augmentation du ratio de distribution des dividendes à 25% à compter de janvier 2025.
LexinFintech Holdings (NASDAQ: LX) hat seine Finanzzahlen für das vierte Quartal und das Gesamtjahr 2024 veröffentlicht und zeigt eine verbesserte Rentabilität und Vermögensqualität. Der Nettogewinn im Q4 erreichte RMB363 Millionen, was einem Anstieg von 17% im Vergleich zum Vorquartal entspricht und das vierte aufeinanderfolgende Quartal mit verbesserter Rentabilität markiert.
Wichtige Kennzahlen für Q4 umfassen: die gesamte Kreditvergabe von RMB52 Milliarden (2% QoQ-Anstieg), den ausstehenden Kreditbestand von RMB110 Milliarden und eine 90-Tage+ Ausfallquote von 3,6%. Der gesamte Betriebsumsatz stieg um 4,3% im Jahresvergleich auf RMB3.659 Millionen.
Für das Gesamtjahr 2024 berichtete das Unternehmen: einen gesamten Betriebsumsatz von RMB14.204 Millionen (8,8% Anstieg im Jahresvergleich), einen Nettogewinn von RMB1.100 Millionen (3,2% Anstieg im Jahresvergleich) und eine gesamte Kreditvergabe von RMB212 Milliarden. Der Vorstand genehmigte eine Dividende von US$0,11 pro ADS und kündigte eine Erhöhung der Dividendenquote auf 25% ab Januar 2025 an.
- Net income increased 17% QoQ to RMB363 million in Q4 2024
- Total operating revenue grew 8.8% YoY to RMB14,204 million in 2024
- Improved asset quality with declining risk indicators
- Increased dividend payout ratio to 25% from 20%
- Tech-empowerment service income rose 41% YoY in Q4 2024
- Total loan originations decreased 15.2% YoY in Q4 2024
- Outstanding loan balance declined 11.1% YoY to RMB110 billion
- Active users decreased 4.3% YoY to 8.2 million in 2024
- E-commerce platform GMV dropped 31.3% YoY in 2024
- Adjusted net income decreased 19% YoY in full-year 2024
Insights
LexinFintech's Q4 and full-year 2024 results demonstrate the company's successful pivot to a quality over quantity strategy. The 17% quarter-over-quarter increase in net income to
The improvement in net income take rate from
Lexin's increased dividend payout ratio from
For 2025, management's guidance of flat to single-digit loan growth but significant net income increase indicates continued focus on margin expansion rather than volume growth - a prudent approach given macroeconomic uncertainties. The
Lexin's asset quality metrics show material improvement, reflecting the effectiveness of their prudent operating strategy. The
The company has significantly increased its risk provisions, with
The
The company's strategic decision to focus on profitability over volume growth aligns with sound credit risk management principles. By prioritizing quality over quantity, Lexin is positioning itself to navigate potential economic headwinds in 2025 while maintaining improving credit metrics. The
SHENZHEN, China, March 18, 2025 (GLOBE NEWSWIRE) -- LexinFintech Holdings Ltd. (“Lexin” or the “Company”) (NASDAQ: LX), a leading technology-empowered personal financial service enabler in China, today announced its unaudited financial results for the quarter ended December 31, 2024.
Mr. Jay Wenjie Xiao, Chairman and Chief Executive Officer of Lexin, commented, “The company remains committed to its prudent operating strategy and has achieved solid progress in its transformation, with key performance indicators showing continuous improvement.
For the fourth quarter, net income was RMB363 million, representing an increase of about
As we advanced our risk management upgrading, we were pleased to see a continuous improvement in asset quality, evidenced by the decline in risk indicators of both newly originated and overall assets. This consistent enhancement in asset quality, along with ongoing operational refinements, has contributed to our sustainable profit growth.
Looking ahead to 2025, in light of the current macroeconomic and industry landscape, we will adhere to our prudent operating strategy, prioritizing asset quality and focusing on profitability enhancement. With this approach, we expect to sustain steady growth in our performance.
In accordance with our semi-annual dividend policy, the board of directors has approved a dividend of US
Mr. James Zheng, Chief Financial Officer of Lexin, commented, “Building upon the solid foundation of the third quarter, we recorded a net income of RMB363 million in the fourth quarter, representing a
“Driven by the ongoing optimization of asset quality, further reduction in funding costs, a more balanced revenue mix, and improvement in customer acquisition efficiency, our revenue take rate and net income have continued to improve.”
“Having achieved substantial progress in our transformation, we will continue to execute our prudent operating strategy. Looking ahead, we expect flat to single-digit growth of total loan origination in 2025 in view of the macroeconomic conditions, alongside a significant year-over-year increase in net income driven by margin expansion.”
Fourth Quarter and Full Year 2024 Operational Highlights:
User Base
- Total number of registered users reached 228 million as of December 31, 2024, representing an increase of
8.6% from 210 million as of December 31, 2023, and users with credit lines reached 45.1 million as of December 31, 2024, up by6.8% from 42.3 million as of December 31, 2023. - Number of active users1 who used our loan products in the fourth quarter of 2024 was 4.7 million, representing a decrease of
0.7% from 4.7 million in the fourth quarter of 2023. Number of active users1 who used our loan products in 2024 was 8.2 million, representing a decrease of4.3% from 8.5 million in 2023. - Number of cumulative borrowers with successful drawdown was 33.8 million as of December 31, 2024, an increase of
7.1% from 31.5 million as of December 31, 2023.
Loan Facilitation Business
- As of December 31, 2024, we cumulatively originated RMB1,325.1 billion in loans, an increase of
19.1% from RMB1,113.1 billion as of December 31, 2023. - Total loan originations2 in the fourth quarter of 2024 was RMB52.0 billion, a decrease of
15.2% from RMB61.2 billion in the fourth quarter of 2023. Total loan originations2 in 2024 was RMB212 billion, a decrease of15.0% from RMB250 billion in 2023. - Total outstanding principal balance of loans3 reached RMB110 billion as of December 31, 2024, representing a decrease of
11.1% from RMB124 billion as of December 31, 2023.
Credit Performance4
- 90 day+ delinquency ratio was
3.6% as of December 31, 2024, as compared with3.7% as of September 30, 2024. - First payment default rate (30 day+) for new loan originations was below
1% as of December 31, 2024.
Tech-empowerment Service
- For the fourth quarter of 2024, we served over 100 business customers with our tech-empowerment service.
- In the fourth quarter of 2024, the business customer retention rate5 of our tech-empowerment service was over
80% .
Installment E-commerce Platform Service
- GMV6 in the fourth quarter of 2024 for our installment e-commerce platform service was RMB969 million, representing a decrease of
25.0% from RMB1,292 million in the fourth quarter of 2023. GMV6 in 2024 for our installment e-commerce platform service was RMB3,633 million, representing a decrease of31.3% from RMB5,289 million in 2023. - In the fourth quarter of 2024, our installment e-commerce platform service served over 280,000 users and 400 merchants.
Other Operational Highlights
- The weighted average tenor of loans originated on our platform in the fourth quarter of 2024 was approximately 13.1 months, as compared with 12.3 months in the fourth quarter of 2023. The weighted average tenor of loans originated on our platform in 2024 was approximately 12.9 months, as compared with 13.8 months in 2023.
- Repeated borrowers’ contribution7 of loans across our platform for the fourth quarter of 2024 was
85.3% . Repeated borrowers’ contribution7 of loans across our platform for 2024 was85.7% .
Fourth Quarter 2024 Financial Highlights:
- Total operating revenue was RMB3,659 million, representing an increase of
4.3% from the fourth quarter of 2023. - Credit facilitation service income was RMB2,712 million, representing a decrease of
0.5% from the fourth quarter of 2023. Tech-empowerment service income was RMB602 million, representing an increase of41.0% from the fourth quarter of 2023. Installment e-commerce platform service income was RMB345 million, representing a decrease of2.9% from the fourth quarter of 2023. - Net income attributable to ordinary shareholders of the Company was RMB363 million, representing an increase of over
100% from the fourth quarter of 2023. Net income per ADS attributable to ordinary shareholders of the Company was RMB2.06 on a fully diluted basis. - Adjusted net income attributable to ordinary shareholders of the Company8 was RMB391 million, representing an increase of
37.7% from the fourth quarter of 2023. Adjusted net income per ADS attributable to ordinary shareholders of the Company8 was RMB2.22 on a fully diluted basis.
Full Year 2024 Financial Highlights:
- Total operating revenue was RMB14,204 million, representing an increase of
8.8% from 2023. - Credit facilitation service income was RMB11,000 million, representing an increase of
13.8% from 2023. Tech-empowerment service income was RMB1,881 million, representing an increase of14.7% from 2023. Installment e-commerce platform service income was RMB1,322 million, representing a decrease of24.5% from 2023. - Net income attributable to ordinary shareholders of the Company was RMB1,100 million, representing an increase of
3.2% from 2023. Net income per ADS attributable to ordinary shareholders of the Company was RMB6.49 on a fully diluted basis. - Adjusted net income attributable to ordinary shareholders of the Company8 was RMB1,203 million, representing a decrease of
19.0% from 2023. Adjusted net income per ADS attributable to ordinary shareholders of the Company8 was RMB7.09 on a fully diluted basis.
__________________________
- Active users refer to, for a specified period, users who made at least one transaction during that period through our platform or through our third-party partners’ platforms using the credit line granted by us.
- Total loan originations refer to the total principal amount of loans facilitated and originated during the given period.
- Total outstanding principal balance of loans refers to the total amount of principal outstanding for loans facilitated and originated at the end of each period, excluding loans delinquent for more than 180 days.
- Loans under Intelligent Credit Platform are excluded from the calculation of credit performance. Intelligent Credit Platform (ICP) is an intelligent platform on our “Fenqile” app, under which we match borrowers and financial institutions through big data and cloud computing technology. For loans facilitated through ICP, the Company does not bear principal risk.
- Customer retention rate refers to the number of financial institution customers and partners who repurchase our service in the current quarter as a percentage of the total number of financial institution customers and partners in the preceding quarter.
- GMV refers to the total value of transactions completed for products purchased on our e-commerce and Maiya channel, net of returns.
- Repeated borrowers’ contribution for a given period refers to the principal amount of loans borrowed during that period by borrowers who had previously made at least one successful drawdown as a percentage of the total loan facilitation and origination volume through our platform during that period.
- Adjusted net income attributable to ordinary shareholders of the Company, adjusted net income per ordinary share and per ADS attributable to ordinary shareholders of the Company are non-GAAP financial measures. For more information on non-GAAP financial measures, please see the section of “Use of Non-GAAP Financial Measures Statement” and the tables captioned “Unaudited Reconciliations of GAAP and Non-GAAP Results” set forth at the end of this press release.
Fourth Quarter 2024 Financial Results:
Operating revenue increased by
Credit facilitation service income was RMB2,712 million in the fourth quarter of 2024 as compared to RMB2,727 million in the fourth quarter of 2023. The decrease was driven by the decrease in guarantee income, partially offset by the increases in loan facilitation and servicing fees-credit oriented and financing income.
Loan facilitation and servicing fees-credit oriented increased by
Guarantee income decreased by
Financing income increased by
Tech-empowerment service income increased by
Installment e-commerce platform service income was RMB345 million in the fourth quarter of 2024, as compared to RMB356 million in the fourth quarter of 2023.
Cost of sales was RMB353 million in the fourth quarter of 2024, as compared to RMB344 million in the fourth quarter of 2023.
Funding cost decreased by
Processing and servicing costs increased by
Provision for financing receivables was RMB297 million for the fourth quarter of 2024, as compared to RMB180 million for the fourth quarter of 2023. The increase was primarily due to the increase of the outstanding loan balances of on-balance sheet loans.
Provision for contract assets and receivables was RMB154 million in the fourth quarter of 2024, as compared to RMB203 million in the fourth quarter of 2023. The decrease was primarily driven by the decrease of the outstanding loan balances of off-balance sheet loans.
Provision for contingent guarantee liabilities was RMB941 million in the fourth quarter of 2024, as compared to RMB934 million in the fourth quarter of 2023.
Gross profit was RMB1,274 million in the fourth quarter of 2024, as compared to RMB1,258 million in the fourth quarter of 2023.
Sales and marketing expenses was RMB464 million in the fourth quarter of 2024, as compared to RMB430 million in the fourth quarter of 2023. This increase was primarily due to an increase in online advertising costs.
Research and development expenses was RMB151 million in the fourth quarter of 2024, as compared to RMB136 million in the fourth quarter of 2023. The increase was primarily due to increased investment in technology development.
General and administrative expenses decreased by
Change in fair value of financial guarantee derivatives and loans at fair value was a loss of RMB144 million in the fourth quarter of 2024, as compared to a loss of RMB248 million in the fourth quarter of 2023. The change was primarily due to the fair value loss from the re-measurement of the expected loss rates, partially offset by the fair value gains realized as a result of the release of guarantee obligation.
Income tax expense was RMB67.6 million in the fourth quarter of 2024, as compared to income tax benefit of RMB9.7 million in the fourth quarter of 2023. The change was primarily due to the increase of income before income tax expense.
Net income increased over
Full Year 2024 Financial Results:
Operating revenue increased by
Credit facilitation service income increased by
Loan facilitation and servicing fees-credit oriented increased by
Guarantee income increased by
Financing income decreased by
Tech-empowerment service income increased by
Installment e-commerce platform service income decreased by
Cost of sales decreased by
Funding cost decreased by
Processing and servicing costs increased by
Provision for financing receivables was RMB866 million in 2024, as compared to RMB627 million in 2023. The increase was primarily due to the increase of the outstanding loan balances of on-balance sheet loans.
Provision for contract assets and receivables was RMB718 million in 2024, as compared to RMB629 million in 2023. The increase was primarily due to the increase of the outstanding loan balances of off-balance sheet loans.
Provision for contingent guarantee liabilities was RMB3,656 million in 2024, as compared to RMB3,203 million in 2023. The fluctuation was primarily due to the re-measurement of the expected loss rates, which are accounted for under ASC 460, Guarantees.
Gross profit increased by
Sales and marketing expenses was RMB1,787 million in 2024, as compared to RMB1,733 million in 2023.
Research and development expenses was RMB578 million in the quarter of 2024, as compared to RMB513 million in 2023. The increase was primarily due to increased investment in technology development.
General and administrative expenses was RMB374 million in 2024, as compared to RMB387 million in 2023.
Change in fair value of financial guarantee derivatives and loans at fair value was a loss of RMB979 million in 2024, as compared to a loss of RMB206 million in 2023. The change was primarily due to the fair value loss from the re-measurement of the expected loss rates, partially offset by the fair value gains realized as a result of the release of guarantee obligation.
Income tax expense was RMB253 million in 2024, as compared to RMB261 million in 2023. The change was primarily due to the decrease of effective tax rate.
Net income increased by
Recent Development
Semi-Annual Dividend
The board of directors of the Company has approved a dividend of US
Outlook
Looking ahead, while our performance continues to demonstrate positive momentum, we remain prudent in light of ongoing macroeconomic uncertainties. Therefore, for full year 2025, we expect total loan origination to have flat to single-digit year-on-year growth depending on the macroeconomic conditions, alongside a significant increase in net income driven by continuing improvement in asset quality. These forecasts are subject to the impact of macroeconomic factors, and the company may adjust its performance outlook as appropriate based on evolving circumstances.
Conference Call
The Company’s management will host an earnings conference call at 10:00 PM U.S. Eastern time on March 18, 2025 (10:00 AM Beijing/Hong Kong time on March 19, 2025).
Participants who wish to join the conference call should register online at:
https://register-conf.media-server.com/register/BI6702756dbdb741f9b401c583a37bd291
Once registration is completed, each participant will receive the dial-in number and a unique access PIN for the conference call.
Participants joining the conference call should dial in at least 10 minutes before the scheduled start time.
A live and archived webcast of the conference call will also be available at the Company's investor relations website at http://ir.lexin.com.
About LexinFintech Holdings Ltd.
We are a leading credit technology-empowered personal financial service enabler. Our mission is to use technology and risk management expertise to make financing more accessible for young generation consumers. We strive to achieve this mission by connecting consumers with financial institutions, where we facilitate through a unique model that includes online and offline channels, installment consumption platform, big data and AI driven credit risk management capabilities, as well as smart user and loan management systems. We also empower financial institutions by providing cutting-edge proprietary technology solutions to meet their needs of financial digital transformation.
For more information, please visit http://ir.lexin.com.
To follow us on Twitter, please go to: https://twitter.com/LexinFintech.
Use of Non-GAAP Financial Measures Statement
In evaluating our business, we consider and use adjusted net income attributable to ordinary shareholders of the Company, non-GAAP EBIT, adjusted net income per ordinary share and per ADS attributable to ordinary shareholders of the Company, four non-GAAP measures, as supplemental measures to review and assess our operating performance. The presentation of the non-GAAP financial measures is not intended to be considered in isolation or as a substitute for the financial information prepared and presented in accordance with U.S. GAAP. We define adjusted net income attributable to ordinary shareholders of the Company as net income attributable to ordinary shareholders of the Company excluding share-based compensation expenses, interest expense associated with convertible notes, and investment income/(loss) and we define non-GAAP EBIT as net income excluding income tax expense, share-based compensation expenses, interest expense, net, and investment income/(loss).
We present these non-GAAP financial measures because they are used by our management to evaluate our operating performance and formulate business plans. Adjusted net income attributable to ordinary shareholders of the Company enables our management to assess our operating results without considering the impact of share-based compensation expenses, interest expense associated with convertible notes, and investment income/(loss). Non-GAAP EBIT, on the other hand, enables our management to assess our operating results without considering the impact of income tax expense, share-based compensation expenses, interest expense, net, and investment income/(loss). We also believe that the use of these non-GAAP financial measures facilitates investors’ assessment of our operating performance. These non-GAAP financial measures are not defined under U.S. GAAP and are not presented in accordance with U.S. GAAP.
These non-GAAP financial measures have limitations as an analytical tool. One of the key limitations of using adjusted net income attributable to ordinary shareholders of the Company and non-GAAP EBIT is that they do not reflect all items of income and expense that affect our operations. Share-based compensation expenses, interest expense associated with convertible notes, income tax expense, interest expense, net, and investment income/(loss) have been and may continue to be incurred in our business and are not reflected in the presentation of adjusted net income attributable to ordinary shareholders of the Company and non-GAAP EBIT. Further, these non-GAAP financial measures may differ from the non-GAAP financial information used by other companies, including peer companies, and therefore their comparability may be limited.
We compensate for these limitations by reconciling each of the non-GAAP financial measures to the most directly comparable U.S. GAAP financial measure, which should be considered when evaluating our performance. We encourage you to review our financial information in its entirety and not rely on a single financial measure.
Exchange Rate Information Statement
This announcement contains translations of certain RMB amounts into U.S. dollars (“US$”) at specified rates solely for the convenience of the reader. Unless otherwise stated, all translations from RMB to US$ were made at the rate of RMB7.2993 to US
Safe Harbor Statement
This announcement contains forward-looking statements. These statements are made under the “safe harbor” provisions of the U.S. Private Securities Litigation Reform Act of 1995. Statements that are not historical facts, including statements about Lexin’s beliefs and expectations, are forward-looking statements. These forward-looking statements can be identified by terminology such as “will,” “ expects,” “anticipates,” “future,” “intends,” “plans,” “believes,” “estimates,” “confident” and similar statements. Among other things, the expectation of the collection efficiency and delinquency, business outlook and quotations from management in this announcement, contain forward-looking statements. Lexin may also make written or oral forward-looking statements in its periodic reports to the U.S. Securities and Exchange Commission (the “SEC”), in its annual report to shareholders, in press releases and other written materials and in oral statements made by its officers, directors or employees to third parties. Forward-looking statements involve inherent risks and uncertainties. A number of factors could cause actual results to differ materially from those contained in any forward-looking statement, including but not limited to the following: Lexin’s goal and strategies; Lexin’s expansion plans; Lexin’s future business development, financial condition and results of operations; Lexin’s expectation regarding demand for, and market acceptance of, its credit and investment management products; Lexin’s expectations regarding keeping and strengthening its relationship with borrowers, institutional funding partners, merchandise suppliers and other parties it collaborates with; general economic and business conditions; and assumptions underlying or related to any of the foregoing. Further information regarding these and other risks is included in Lexin’s filings with the SEC. All information provided in this press release and in the attachments is as of the date of this press release, and Lexin does not undertake any obligation to update any forward-looking statement, except as required under applicable law.
For investor and media inquiries, please contact:
LexinFintech Holdings Ltd.
IR inquiries:
Will Tan
Tel: +86 (755) 3637-8888 ext. 6258
E-mail: willtan@lexin.com
Media inquiries:
Ruifeng Xu
Tel: +86 (755) 3637-8888 ext. 6993
E-mail: media@lexin.com
SOURCE LexinFintech Holdings Ltd.
| LexinFintech Holdings Ltd. Unaudited Condensed Consolidated Balance Sheets | |||||||||
| As of | |||||||||
| (In thousands) | December 31, 2023 | December 31, 2024 | |||||||
| RMB | RMB | US$ | |||||||
| ASSETS | |||||||||
| Current Assets | |||||||||
| Cash and cash equivalents | 2,624,719 | 2,254,213 | 308,826 | ||||||
| Restricted cash | 1,433,502 | 1,638,479 | 224,471 | ||||||
| Restricted term deposit and short-term investments | 305,182 | 138,497 | 18,974 | ||||||
| Short-term financing receivables, net(1) | 3,944,000 | 4,668,715 | 639,611 | ||||||
| Short-term contract assets and receivables, net(1) | 6,112,981 | 5,448,057 | 746,381 | ||||||
| Deposits to insurance companies and guarantee companies | 2,613,271 | 2,355,343 | 322,681 | ||||||
| Prepayments and other current assets | 1,428,769 | 1,321,340 | 181,024 | ||||||
| Amounts due from related parties | 6,989 | 61,722 | 8,456 | ||||||
| Inventories, net | 33,605 | 22,345 | 3,061 | ||||||
| Total Current Assets | 18,503,018 | 17,908,711 | 2,453,485 | ||||||
| Non-current Assets | |||||||||
| Restricted cash | 144,948 | 100,860 | 13,818 | ||||||
| Long-term financing receivables, net(1) | 200,514 | 112,427 | 15,402 | ||||||
| Long-term contract assets and receivables, net(1) | 599,818 | 317,402 | 43,484 | ||||||
| Property, equipment and software, net | 446,640 | 613,110 | 83,996 | ||||||
| Land use rights, net | 897,267 | 862,867 | 118,212 | ||||||
| Long‑term investments | 255,003 | 284,197 | 38,935 | ||||||
| Deferred tax assets | 1,232,092 | 1,540,842 | 211,094 | ||||||
| Other assets | 861,491 | 500,363 | 68,549 | ||||||
| Total Non-current Assets | 4,637,773 | 4,332,068 | 593,490 | ||||||
| TOTAL ASSETS | 23,140,791 | 22,240,779 | 3,046,975 | ||||||
| LIABILITIES | |||||||||
| Current liabilities | |||||||||
| Accounts payable | 49,801 | 74,443 | 10,199 | ||||||
| Amounts due to related parties | 2,958 | 10,927 | 1,497 | ||||||
| Short‑term borrowings | 502,013 | 690,772 | 94,635 | ||||||
| Short‑term funding debts | 3,483,196 | 2,754,454 | 377,359 | ||||||
| Deferred guarantee income | 1,538,385 | 975,102 | 133,588 | ||||||
| Contingent guarantee liabilities | 1,808,540 | 1,079,000 | 147,822 | ||||||
| Accruals and other current liabilities | 4,434,254 | 4,019,676 | 550,691 | ||||||
| Convertible notes | 505,450 | - | - | ||||||
| Total Current Liabilities | 12,324,597 | 9,604,374 | 1,315,791 | ||||||
| Non-current Liabilities | |||||||||
| Long-term borrowings | 524,270 | 585,024 | 80,148 | ||||||
| Long‑term funding debts | 455,800 | 1,197,211 | 164,017 | ||||||
| Deferred tax liabilities | 75,340 | 91,380 | 12,519 | ||||||
| Other long-term liabilities | 50,702 | 22,784 | 3,121 | ||||||
| Total Non-current Liabilities | 1,106,112 | 1,896,399 | 259,805 | ||||||
| TOTAL LIABILITIES | 13,430,709 | 11,500,773 | 1,575,596 | ||||||
| Shareholders’ equity: | |||||||||
| Class A Ordinary Shares | 199 | 205 | 31 | ||||||
| Class B Ordinary Shares | 41 | 41 | 7 | ||||||
| Treasury stock | (328,764 | ) | (328,764 | ) | (45,040 | ) | |||
| Additional paid-in capital | 3,204,961 | 3,314,866 | 454,134 | ||||||
| Statutory reserves | 1,106,579 | 1,178,309 | 161,428 | ||||||
| Accumulated other comprehensive income | (13,545 | ) | (29,559 | ) | (4,050 | ) | |||
| Retained earnings | 5,740,611 | 6,604,908 | 904,869 | ||||||
| Total shareholders’ equity | 9,710,082 | 10,740,006 | 1,471,379 | ||||||
| TOTAL LIABILITIES AND SHAREHOLDERS’ EQUITY | 23,140,791 | 22,240,779 | 3,046,975 | ||||||
__________________________
(1) Short-term financing receivables, net of allowance for credit losses of RMB58,594 and RMB102,124 as of December 31, 2023 and December 31, 2024, respectively.
Short-term contract assets and receivables, net of allowance for credit losses of RMB436,136 and RMB409,590 as of December 31, 2023 and December 31, 2024, respectively.
Long-term financing receivables, net of allowance for credit losses of RMB3,087 and RMB1,820 as of December 31, 2023 and December 31, 2024, respectively.
Long-term contract assets and receivables, net of allowance for credit losses of RMB61,838 and RMB30,919 as of December 31, 2023 and December 31, 2024, respectively.
| LexinFintech Holdings Ltd. Unaudited Condensed Consolidated Statements of Operations | ||||||||||||||||||
| For the Three Months Ended December 31, | For the Year Ended December 31, | |||||||||||||||||
| (In thousands, except for share and per share data) | 2023 | 2024 | 2023 | 2024 | ||||||||||||||
| RMB | RMB | US$ | RMB | RMB | US$ | |||||||||||||
| Operating revenue: | ||||||||||||||||||
| Credit facilitation service income | 2,727,020 | 2,712,066 | 371,552 | 9,666,120 | 10,999,931 | 1,506,984 | ||||||||||||
| Loan facilitation and servicing fees-credit oriented | 1,558,588 | 1,624,410 | 222,543 | 5,001,881 | 6,325,924 | 866,648 | ||||||||||||
| Guarantee income | 709,422 | 577,168 | 79,072 | 2,519,284 | 2,663,824 | 364,942 | ||||||||||||
| Financing income | 459,010 | 510,488 | 69,937 | 2,144,955 | 2,010,183 | 275,394 | ||||||||||||
| Tech-empowerment service income | 426,882 | 601,693 | 82,432 | 1,640,453 | 1,881,376 | 257,747 | ||||||||||||
| Installment e-commerce platform service income | 355,534 | 345,074 | 47,275 | 1,750,509 | 1,322,287 | 181,153 | ||||||||||||
| Total operating revenue | 3,509,436 | 3,658,833 | 501,259 | 13,057,082 | 14,203,594 | 1,945,884 | ||||||||||||
| Operating cost | ||||||||||||||||||
| Cost of sales | (344,088 | ) | (352,749 | ) | (48,326 | ) | (1,635,635 | ) | (1,319,526 | ) | (180,774 | ) | ||||||
| Funding cost | (76,195 | ) | (57,471 | ) | (7,873 | ) | (513,869 | ) | (326,451 | ) | (44,724 | ) | ||||||
| Processing and servicing cost | (514,070 | ) | (583,119 | ) | (79,887 | ) | (1,935,016 | ) | (2,291,904 | ) | (313,990 | ) | ||||||
| Provision for financing receivables | (180,475 | ) | (296,741 | ) | (40,653 | ) | (627,061 | ) | (865,524 | ) | (118,576 | ) | ||||||
| Provision for contract assets and receivables | (202,677 | ) | (153,968 | ) | (21,094 | ) | (629,308 | ) | (718,413 | ) | (98,422 | ) | ||||||
| Provision for contingent guarantee liabilities | (933,854 | ) | (940,740 | ) | (128,881 | ) | (3,203,123 | ) | (3,655,548 | ) | (500,808 | ) | ||||||
| Total operating cost | (2,251,359 | ) | (2,384,788 | ) | (326,714 | ) | (8,544,012 | ) | (9,177,366 | ) | (1,257,294 | ) | ||||||
| Gross profit | 1,258,077 | 1,274,045 | 174,545 | 4,513,070 | 5,026,228 | 688,590 | ||||||||||||
| Operating expenses: | ||||||||||||||||||
| Sales and marketing expenses | (429,573 | ) | (464,263 | ) | (63,604 | ) | (1,733,301 | ) | (1,787,299 | ) | (244,859 | ) | ||||||
| Research and development expenses | (135,837 | ) | (151,081 | ) | (20,698 | ) | (513,284 | ) | (578,243 | ) | (79,219 | ) | ||||||
| General and administrative expenses | (108,305 | ) | (95,335 | ) | (13,061 | ) | (387,387 | ) | (374,481 | ) | (51,304 | ) | ||||||
| Total operating expenses | (673,715 | ) | (710,679 | ) | (97,363 | ) | (2,633,972 | ) | (2,740,023 | ) | (375,382 | ) | ||||||
| Change in fair value of financial guarantee derivatives and loans at fair value | (247,526 | ) | (143,619 | ) | (19,676 | ) | (206,368 | ) | (979,234 | ) | (134,155 | ) | ||||||
| Interest expense, net | (10,245 | ) | (2,560 | ) | (351 | ) | (50,483 | ) | (9,007 | ) | (1,234 | ) | ||||||
| Investment loss | (302,128 | ) | (543 | ) | (74 | ) | (303,235 | ) | (2,417 | ) | (331 | ) | ||||||
| Others, net | (22,092 | ) | 13,754 | 1,884 | 7,774 | 58,188 | 7,972 | |||||||||||
| Income before income tax expense | 2,371 | 430,398 | 58,965 | 1,326,786 | 1,353,735 | 185,460 | ||||||||||||
| Income tax benefit/(expense) | 9,726 | (67,649 | ) | (9,268 | ) | (260,841 | ) | (253,275 | ) | (34,699 | ) | |||||||
| Net income | 12,097 | 362,749 | 49,697 | 1,065,945 | 1,100,460 | 150,761 | ||||||||||||
| Net income attributable to ordinary shareholders of the Company | 12,097 | 362,749 | 49,697 | 1,065,945 | 1,100,460 | 150,761 | ||||||||||||
| Net income per ordinary share attributable to ordinary shareholders of the Company | ||||||||||||||||||
| Basic | 0.04 | 1.09 | 0.15 | 3.24 | 3.32 | 0.45 | ||||||||||||
| Diluted | 0.04 | 1.03 | 0.14 | 3.17 | 3.24 | 0.44 | ||||||||||||
| Net income per ADS attributable to ordinary shareholders of the Company | ||||||||||||||||||
| Basic | 0.07 | 2.18 | 0.30 | 6.49 | 6.64 | 0.91 | ||||||||||||
| Diluted | 0.07 | 2.06 | 0.28 | 6.34 | 6.49 | 0.89 | ||||||||||||
| Weighted average ordinary shares outstanding | ||||||||||||||||||
| Basic | 329,297,640 | 333,182,976 | 333,182,976 | 328,523,952 | 331,403,936 | 331,403,936 | ||||||||||||
| Diluted | 331,941,385 | 351,577,582 | 351,577,582 | 359,820,982 | 339,261,349 | 339,261,349 | ||||||||||||
| LexinFintech Holdings Ltd. Unaudited Condensed Consolidated Statements of Comprehensive Income | |||||||||||||||||||
| For the Three Months Ended December 31, | For the Year Ended December 31, | ||||||||||||||||||
| (In thousands) | 2023 | 2024 | 2023 | 2024 | |||||||||||||||
| RMB | RMB | US$ | RMB | RMB | US$ | ||||||||||||||
| Net income | 12,097 | 362,749 | 49,697 | 1,065,945 | 1,100,460 | 150,761 | |||||||||||||
| Other comprehensive income | |||||||||||||||||||
| Foreign currency translation adjustment, net of nil tax | 27,841 | 642 | 88 | 7,297 | (16,014 | ) | (2,194 | ) | |||||||||||
| Total comprehensive income | 39,938 | 363,391 | 49,785 | 1,073,242 | 1,084,446 | 148,567 | |||||||||||||
| Total comprehensive income attributable to ordinary shareholders of the Company | 39,938 | 363,391 | 49,785 | 1,073,242 | 1,084,446 | 148,567 | |||||||||||||
| LexinFintech Holdings Ltd. Unaudited Reconciliations of GAAP and Non-GAAP Results | |||||||||||||||||||
| For the Three Months Ended December 31, | For the Year Ended December 31, | ||||||||||||||||||
| (In thousands, except for share and per share data) | 2023 | 2024 | 2023 | 2024 | |||||||||||||||
| RMB | RMB | US$ | RMB | RMB | US$ | ||||||||||||||
| Reconciliation of Adjusted net income attributable to ordinary shareholders of the Company to Net income attributable to ordinary shareholders of the Company | |||||||||||||||||||
| Net income attributable to ordinary shareholders of the Company | 12,097 | 362,749 | 49,697 | 1,065,945 | 1,100,460 | 150,761 | |||||||||||||
| Add: Share-based compensation expenses | 32,959 | 27,244 | 3,732 | 117,852 | 94,623 | 12,963 | |||||||||||||
| Interest expense associated with convertible notes | 11,943 | - | - | 73,807 | 5,695 | 780 | |||||||||||||
| Investment loss | 302,128 | 543 | 74 | 303,235 | 2,417 | 331 | |||||||||||||
| Tax effects on Non-GAAP adjustments (2) | (75,440 | ) | - | - | (75,440 | ) | - | - | |||||||||||
| Adjusted net income attributable to ordinary shareholders of the Company | 283,687 | 390,536 | 53,503 | 1,485,399 | 1,203,195 | 164,835 | |||||||||||||
| Adjusted net income per ordinary share attributable to ordinary shareholders of the Company | |||||||||||||||||||
| Basic | 0.86 | 1.17 | 0.16 | 4.52 | 3.63 | 0.50 | |||||||||||||
| Diluted | 0.82 | 1.11 | 0.15 | 4.13 | 3.55 | 0.49 | |||||||||||||
| Adjusted net income per ADS attributable to ordinary shareholders of the Company | |||||||||||||||||||
| Basic | 1.72 | 2.34 | 0.32 | 9.04 | 7.26 | 0.99 | |||||||||||||
| Diluted | 1.64 | 2.22 | 0.30 | 8.26 | 7.09 | 0.97 | |||||||||||||
| Weighted average shares used in calculating net income per ordinary share for non-GAAP EPS | |||||||||||||||||||
| Basic | 329,297,640 | 333,182,976 | 333,182,976 | 328,523,952 | 331,403,936 | 331,403,936 | |||||||||||||
| Diluted | 345,913,435 | 351,577,582 | 351,577,582 | 359,820,982 | 339,261,349 | 339,261,349 | |||||||||||||
| Reconciliations of Non-GAAP EBIT to Net income | |||||||||||||||||||
| Net income | 12,097 | 362,749 | 49,697 | 1,065,945 | 1,100,460 | 150,761 | |||||||||||||
| Add: Income tax (benefit)/expense | (9,726 | ) | 67,649 | 9,268 | 260,841 | 253,275 | 34,699 | ||||||||||||
| Share-based compensation expenses | 32,959 | 27,244 | 3,732 | 117,852 | 94,623 | 12,963 | |||||||||||||
| Interest expense, net | 10,245 | 2,560 | 351 | 50,483 | 9,007 | 1,234 | |||||||||||||
| Investment loss | 302,128 | 543 | 74 | 303,235 | 2,417 | 331 | |||||||||||||
| Non-GAAP EBIT | 347,703 | 460,745 | 63,122 | 1,798,356 | 1,459,782 | 199,988 | |||||||||||||
(2) To exclude the tax effects related to the investment loss
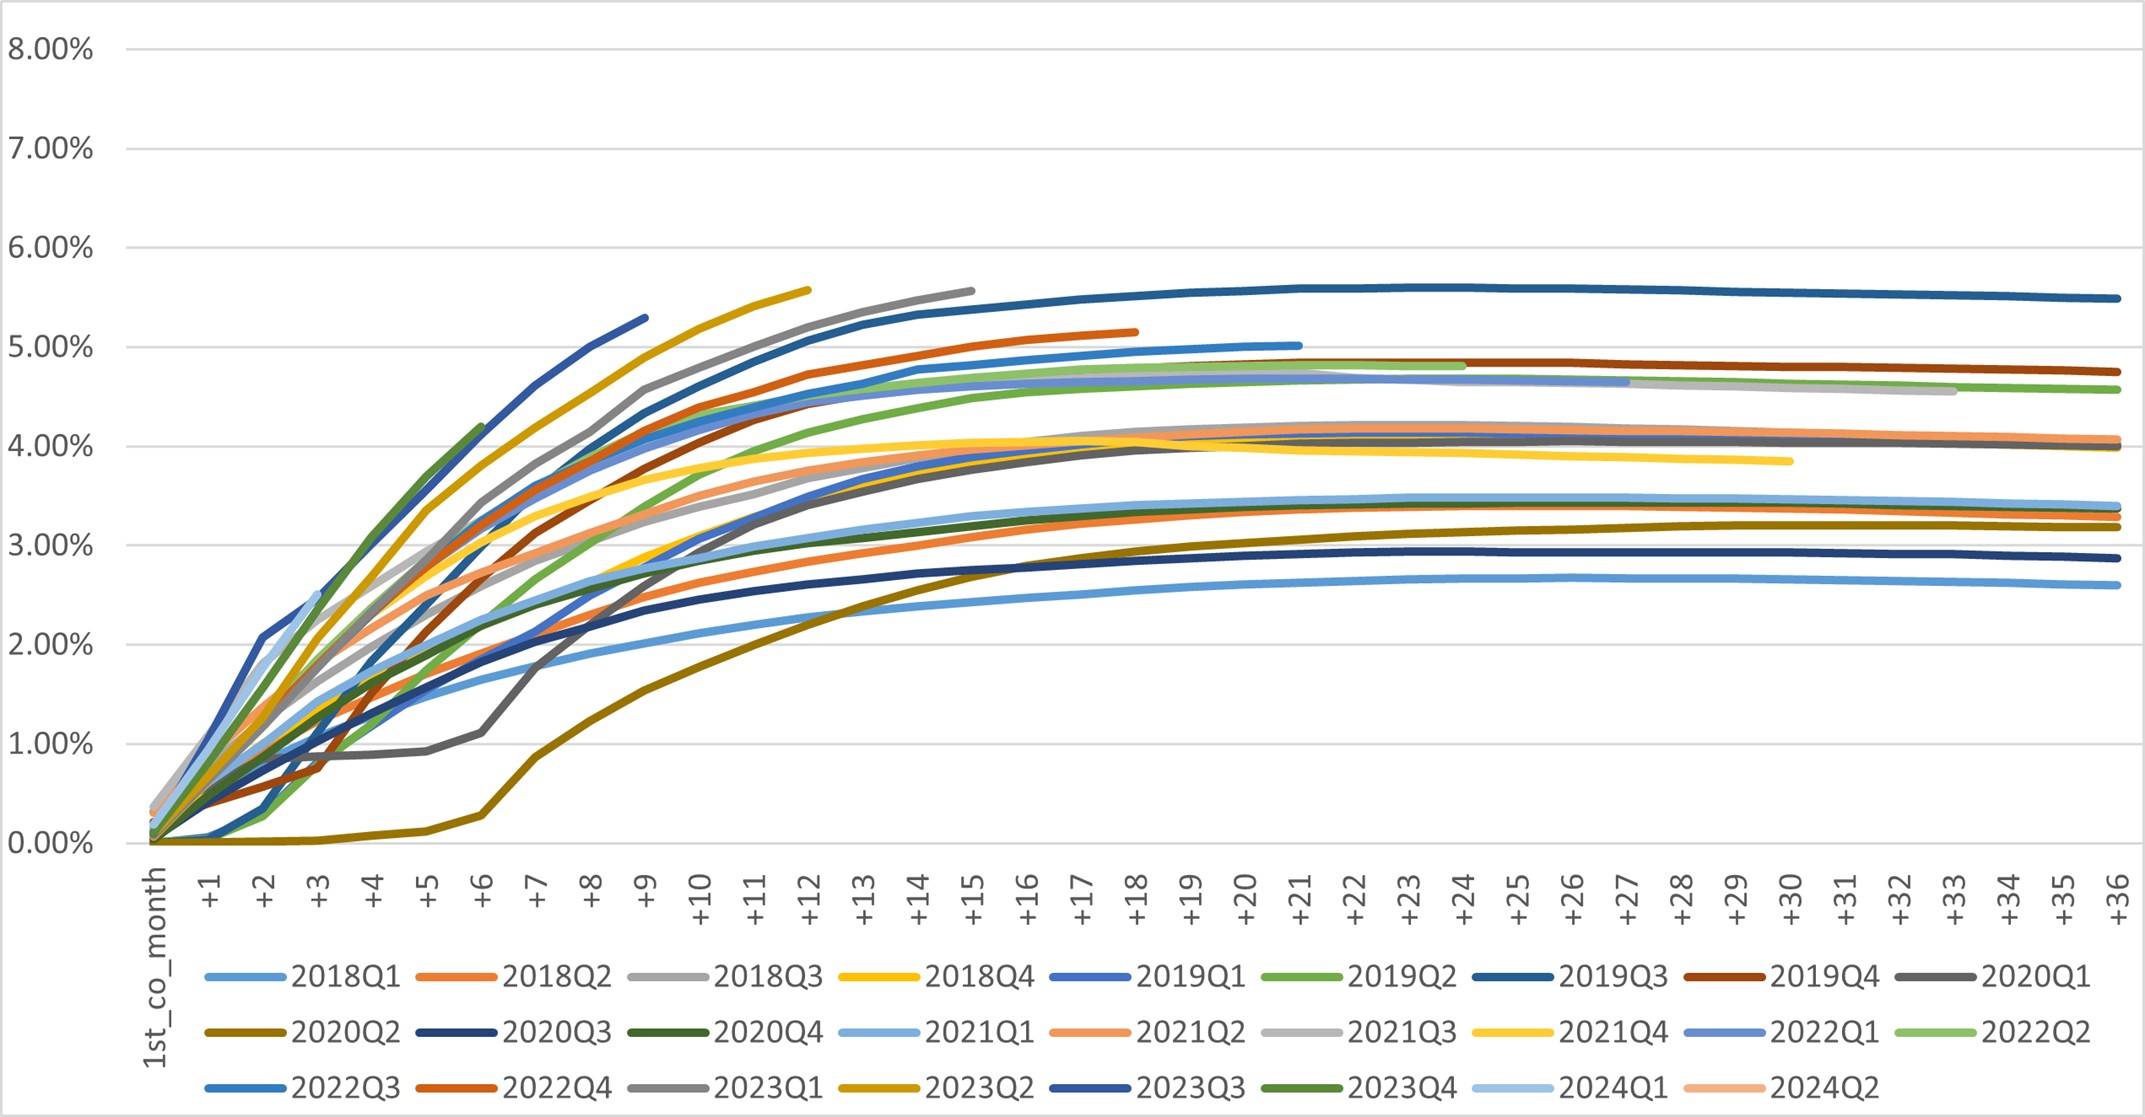
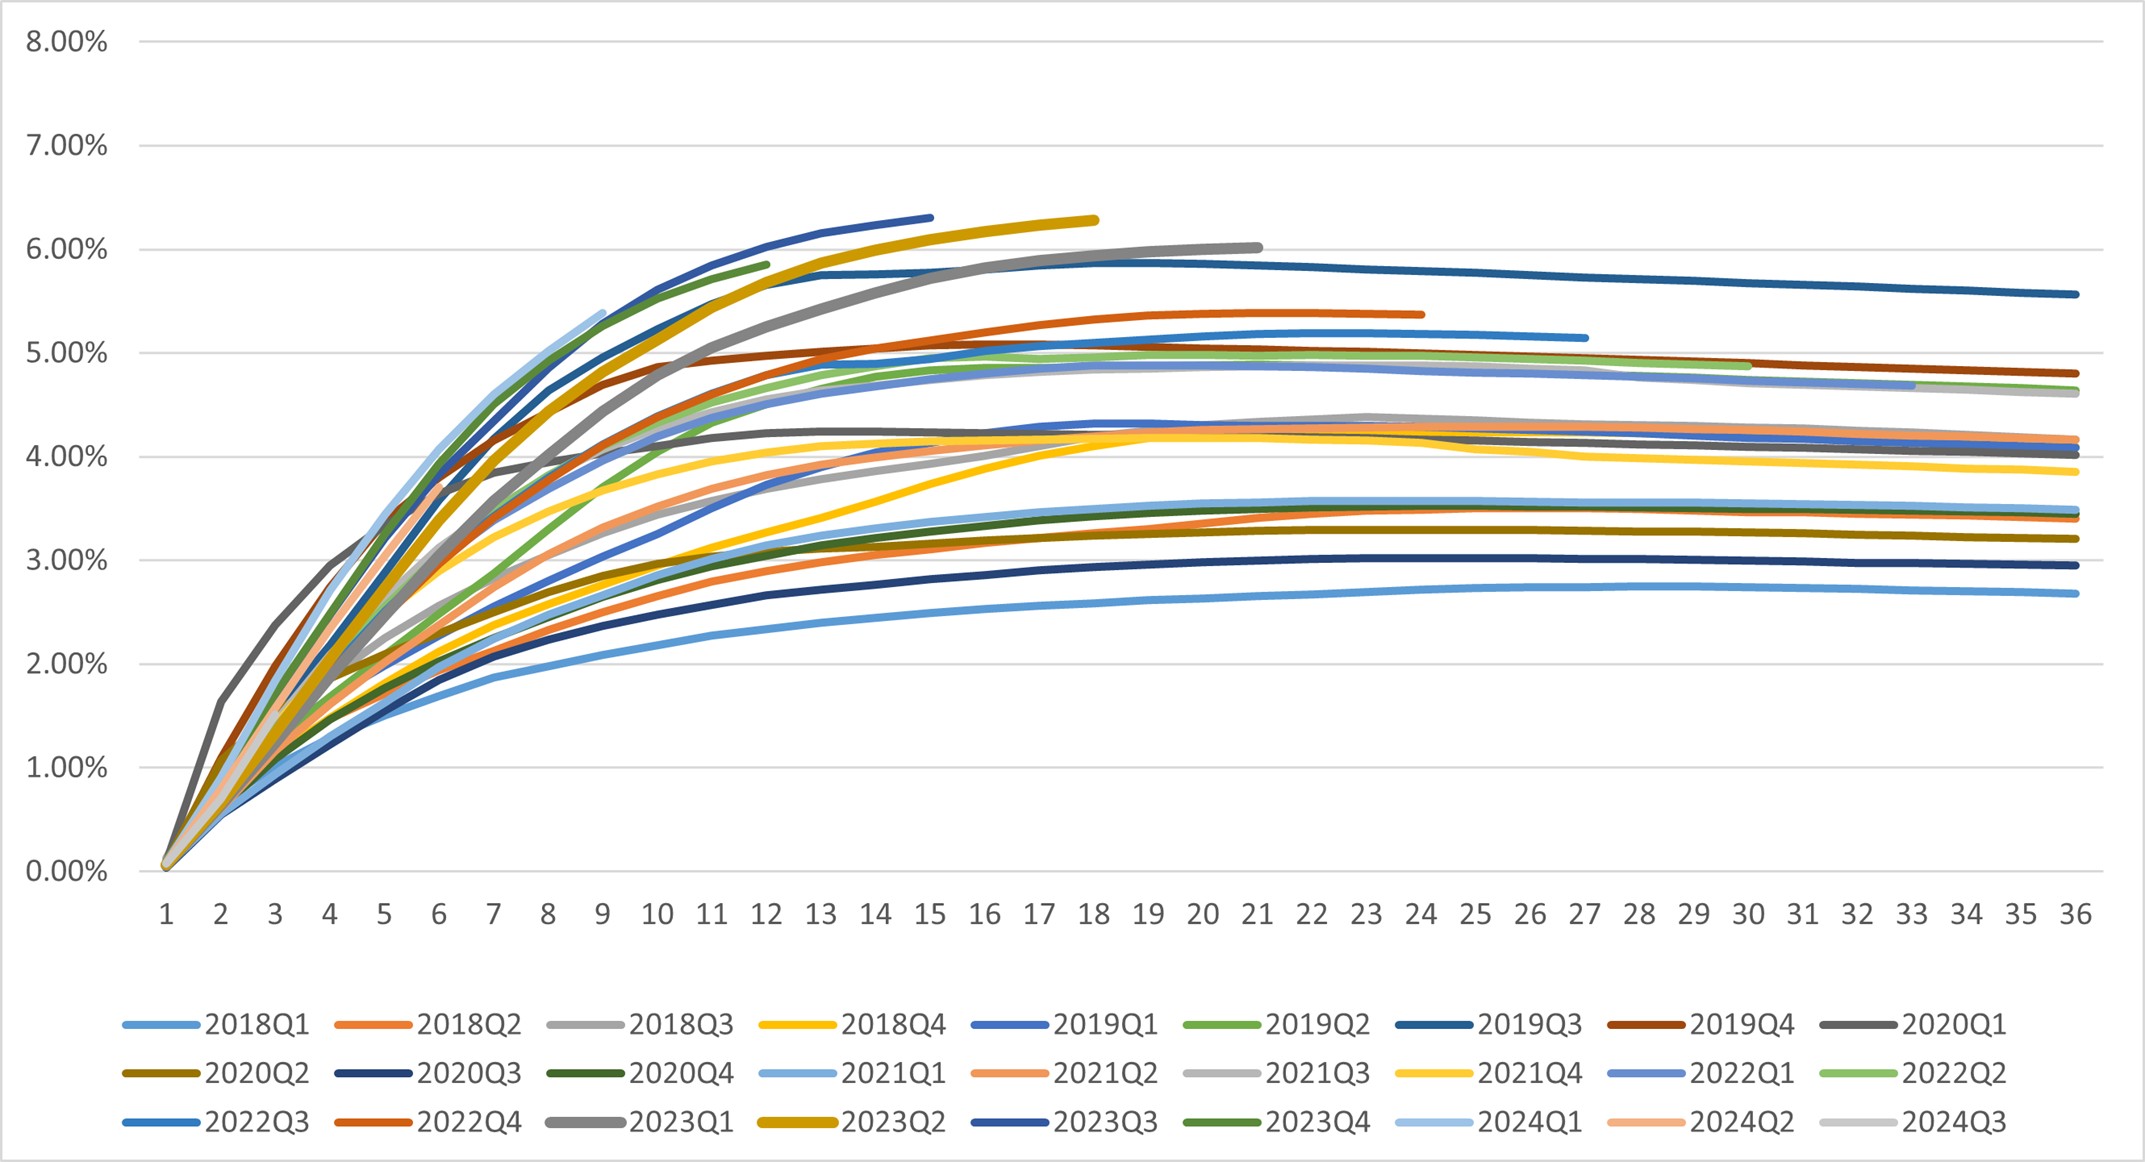
Additional Credit Information
Vintage Charge Off Curve1
Dpd30+/GMV by Performance Windows1
First Payment Default 30+1
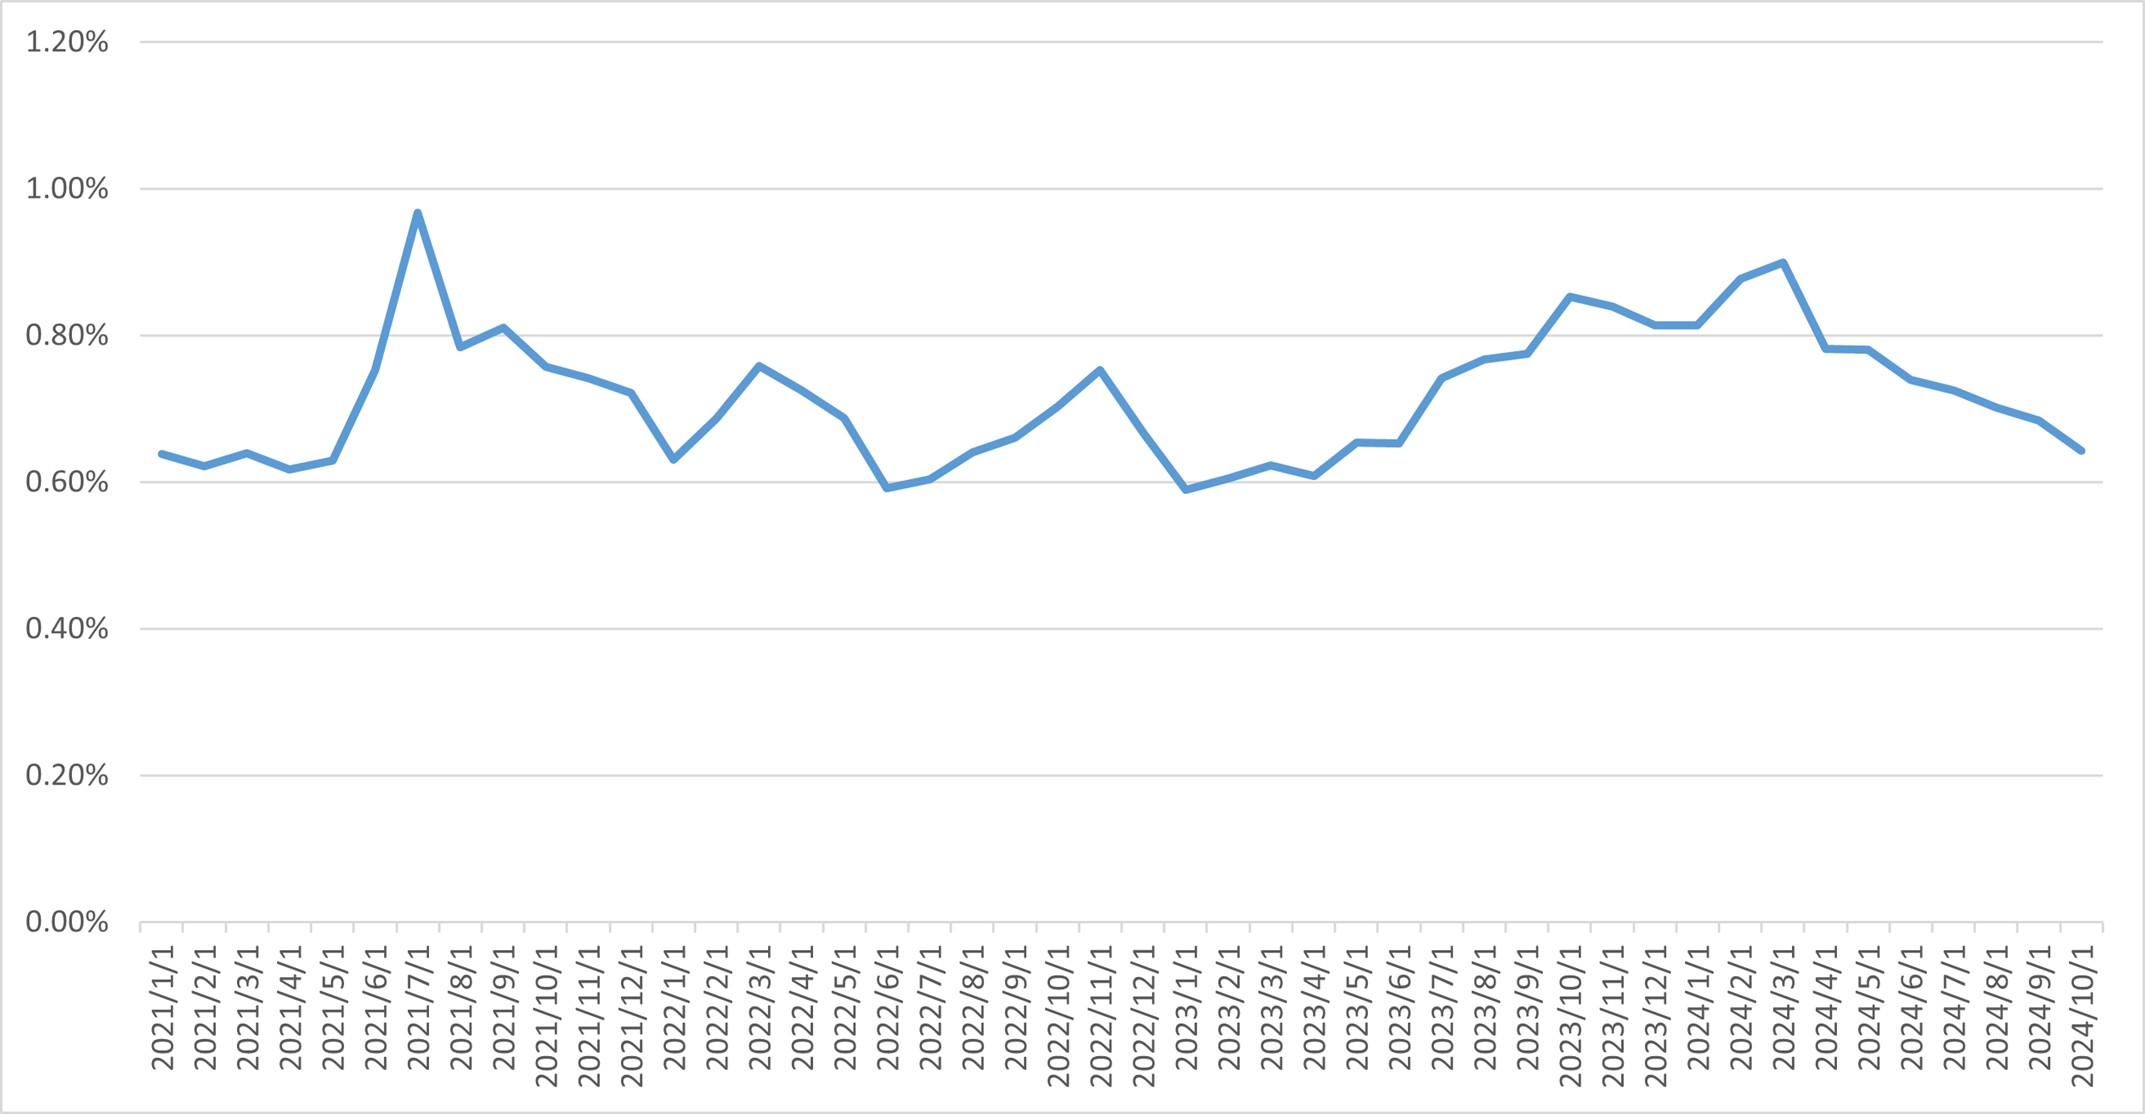
1. Loans facilitated under ICP are excluded from the chart.
