
U.S. Global Investors Reports 12% Sequential Growth in Assets Under Management in Q2 of Fiscal 2026
Rhea-AI Summary
U.S. Global Investors (NASDAQ: GROW) reported Q2 fiscal 2026 results for the quarter ended Dec 31, 2025: AUM $1.5B (12% sequential, +5% YoY) and $1.7B AUM as of Feb 19, 2026. Operating revenue rose 11.5% QoQ; income before taxes was $535k versus a prior-year loss. A $1.3M tax expense tied to HIVE convertible securities elevated the effective tax rate; the company expects a $1.3M offset in the March 31, 2026 quarter pending IRS review. The Board approved a $0.0075/month dividend for Jan–Mar 2026 and repurchased 262,195 shares in the quarter. Cash was $25.2M with net working capital $36.7M.
AI-generated analysis. Not financial advice.
Positive
- AUM +12% sequential growth to $1.5B
- Operating revenue +11.5% quarter-over-quarter
- Income before taxes improved to $535k
- Board-approved dividend of $0.0075 per share monthly (Jan–Mar 2026)
- Share repurchases of 262,195 shares during the quarter
- $25.2M in cash supporting liquidity
Negative
- Reported net loss of $846k for the quarter
- Income tax expense of $1.381M tied to HIVE securities
- Expected $1.3M tax benefit not recognized in quarter; IRS review pending
News Market Reaction – GROW
On the day this news was published, GROW gained 1.84%, reflecting a mild positive market reaction.
Data tracked by StockTitan Argus on the day of publication.
Key Figures
Market Reality Check
Peers on Argus
GROW’s modest 0.63% gain contrasted with mixed peers: EQS (-0.01), BCG (-0.43), CUBA (-1.18), RAND (-1), while RMCO was up (1.28). Only one loosely related peer (MGLD, +2.80%) appeared in momentum scans.
Historical Context
| Date | Event | Sentiment | Move | Catalyst |
|---|---|---|---|---|
| Dec 30 | ETF strategy update | Positive | +0.0% | GOAU ETF moved to active management and WAR ETF hit one-year mark. |
| Dec 12 | Dividend & outlook | Positive | -1.6% | Maintained monthly dividend and highlighted strong airline and commodity trends. |
| Nov 12 | Earnings – Q1 FY26 | Positive | -2.9% | Reported rebound to profitability with higher revenues and investment income. |
| Nov 06 | Webcast announcement | Neutral | -2.9% | Scheduled webcast to discuss fiscal 2025 results and outlook. |
| Oct 28 | Community partnership | Neutral | +0.0% | Announced multi‑year partnership and funding for Keystone School’s Model UN. |
Recent positive operational and dividend news has often seen flat or negative next-day moves, suggesting a tendency for the stock to underreact or fade good news.
Over the last few months, GROW highlighted ETF strategy evolution, dividend continuity, and a return to profitability. On Nov 12, 2025, it reported Q1 fiscal 2026 profitability with higher investment income and strong liquidity, yet the stock fell 2.88%. A December dividend update and sector commentary saw a 1.62% decline. Strategic ETF changes and a school partnership in late 2025 produced flat price reactions. Today’s Q2 2026 update continues the theme of improving operations and active capital returns.
Market Pulse Summary
This announcement underscores rising AUM, improved pre-tax profitability, and active shareholder returns through dividends and buybacks. At the same time, a roughly $1.3 million tax expense and non-cash valuation allowance produced a quarterly net loss, adding complexity to the earnings picture. Investors may track how the expected tax benefit for the March 2026 quarter, continued AUM growth from approximately $1.5 billion to $1.7 billion, and ongoing capital return policies influence future results and capital allocation flexibility.
Key Terms
assets under management financial
revenue passenger kilometers technical
available seat kilometers technical
load factor technical
Internal Revenue Service regulatory
Form 10-Q regulatory
Form 13F regulatory
AI-generated analysis. Not financial advice.


SAN ANTONIO, Feb. 20, 2026 (GLOBE NEWSWIRE) -- U.S. Global Investors, Inc. (NASDAQ: GROW) (the “Company”), a registered investment advisory firm1 with longstanding experience in global markets and specialized sectors, today reported financial results for the second quarter of fiscal 2026 ended December 31, 2025. Total assets under management (AUM) were approximately
During the three months ended December 31, 2025, the Company recorded a tax expense of approximately
Shareholder Value Initiatives
The Company’s shareholder yield as of December 31, 2025, was
The Company’s Board of Directors (the “Board”) approved payment of a
The Company maintains a share repurchase program, authorized by the Board, allowing for the annual purchase of up to
Travel Demand Remains Resilient as Capacity Stays Constrained
The Company is pleased to report that air travel demand continued to prove resilient in 2025, even as airlines and airports faced persistent capacity constraints. The International Air Transport Association (IATA) reported that full-year passenger demand, measured in revenue passenger kilometers (RPKs), rose
This strength has been visible across major markets. Airports Council International (ACI) Europe reported that passenger traffic across Europe’s airports increased
“Consumers are still prioritizing experiences, and the data continues to show that air travel remains one of the most resilient categories in the global economy,” said Frank Holmes, the Company’s Chief Executive Officer (CEO) and Chief Investment Officer (CIO). “Even with capacity constraints, the industry has been setting records for demand and load factors. That’s a constructive backdrop for investors looking at the long-term growth potential of the airlines and travel ecosystem.”
Gold Demand Breaks 5,000 Tons as Investors Seek Safe Haven
Gold demand and prices both reached historic milestones in 2025. According to the World Gold Council (WGC), total gold demand exceeded 5,000 metric tons for the first time ever, and the record-setting run in gold prices produced an unprecedented annual value of approximately
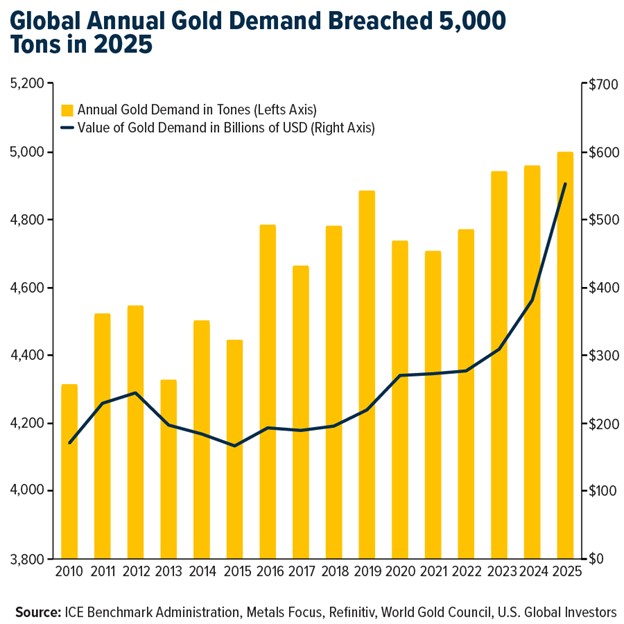
Looking ahead, several major market observers expect gold to remain supported by continued diversification and macro uncertainty. Goldman Sachs raised its year-end 2026 gold forecast to
“Gold has continued to do what it has historically done best—serve as a portfolio hedge during periods of macroeconomic and geopolitical uncertainty,” said Mr. Holmes. “When demand breaks records and central banks remain large buyers, it reinforces gold’s role as a strategic asset. Against that backdrop, we believe investors will continue to look closely at gold exposure, including the potential upside in quality precious metals miners.”
Healthy Liquidity and Capital Resources
As of December 31, 2025, the Company had net working capital of approximately
Tune In to the Earnings Webcast
The Company has scheduled a webcast for 7:30 a.m. Central time on Monday, February 23, 2026, to discuss the Company’s key financial results for the quarter. Frank Holmes will be accompanied on the webcast by Lisa Callicotte, chief financial officer, and Holly Schoenfeldt, director of marketing. Click to register for the earnings webcast or visit www.usfunds.com for more information.
Selected Financial Data (unaudited): (dollars in thousands, except per share data)
| Three months ended | ||||||
| 12/31/2025 | 12/31/2024 | |||||
| Operating Revenues | ||||||
| Operating Expenses | 2,598 | 2,770 | ||||
| Operating Income (Loss) | (88) | (539) | ||||
| Total Other Income (Loss) | 623 | 423 | ||||
| Income (Loss) Before Income Taxes | 535 | (116) | ||||
| Income Tax Expense (Benefit) | 1,381 | (30) | ||||
| Net Income (Loss) | ||||||
| Net Income (Loss) Per Share (Basic and Diluted) | ||||||
| Avg. Common Shares Outstanding (Basic) | 12,762,003 | 13,497,961 | ||||
| Avg. Common Shares Outstanding (Diluted) | 12,765,706 | 13,498,306 | ||||
| Avg. Assets Under Management (Billions) | ||||||
About U.S. Global Investors, Inc.
The story of U.S. Global Investors goes back more than 50 years when it began as an investment club. Today, U.S. Global Investors, Inc. (www.usfunds.com) is a registered investment adviser that focuses on niche markets around the world. Headquartered in San Antonio, Texas, the Company provides investment management and other services to U.S. Global Investors Funds and U.S. Global ETFs.
Forward-Looking Statements and Disclosure
This news release and other statements by U.S. Global Investors may include certain “forward-looking statements,” including statements relating to revenues, expenses and expectations regarding market conditions. You can identify these forward-looking statements by the use of words such as “outlook,” “believes,” “expects,” “potential,” “opportunity,” “seeks,” “anticipates” or other comparable words. Such statements involve certain risks and uncertainties and should be read with corporate filings and other important information on the Company’s website, www.usfunds.com, or the Securities and Exchange Commission’s website at www.sec.gov.
These filings, such as the Company’s annual report and Form 10-Q, should be read in conjunction with the other cautionary statements that are included in this release. Future events could differ materially from those anticipated in such statements and there can be no assurance that such statements will prove accurate and actual results may vary. The Company undertakes no obligation to publicly update or review any forward-looking statements, whether as a result of new information, future developments or otherwise.
Frank Holmes serves as executive chairman of the Board of Directors of HIVE Digital Technologies. Both Mr. Holmes and U.S. Global Investors own securities of HIVE.
Carryforward is the process of transferring unspent funds, unused tax losses, or remaining credits from one budget, accounting, or tax period to the next.
All opinions expressed and data provided are subject to change without notice. Some of these opinions may not be appropriate to every investor.
_______________________
1 Registration does not imply a certain level of skill or training.
2 The Company calculates shareholder yield by adding the percentage of change in shares outstanding, the dividend yield and any debt reduction for the 12 months ended December 31, 2025.
3 International Air Transport Association (IATA), « Strong 2025 Passenger Demand Masks Ongoing Capacity Constraints,” Press Release No. 5, January 29, 2026, https://www.iata.org/en/pressroom/2026-releases/2026-01-29-02/
4 Airports Council International Europe (ACI EUROPE), “2025 All about Traffic Resilience as Europe’s Airports Welcomed an Additional 100 Million Passengers,” February 5, 2026, https://www.aci-europe.org/mediaroom/579-2025-all-about-traffic-resilience-as-europe-s-airports-welcomed-an-additional-100-million-passengers.html
5 Airlines Reporting Corporation (ARC), “Annual U.S. Travel Agency Air Ticket Sales Surpass
6 World Gold Council, “Gold Demand Trends: Q4 and Full Year 2025,” January 29, 2026, https://www.gold.org/goldhub/research/gold-demand-trends/gold-demand-trends-full-year-2025
7 Preeti Soni, “Goldman Raises Year-End Gold Forecast to
Contact:
Holly Schoenfeldt
Director of Marketing
210.308.1268
hschoenfeldt@usfunds.com
A photo accompanying this announcement is available at https://www.globenewswire.com/NewsRoom/AttachmentNg/b5c398d1-b579-4fda-9d39-59e383ef82a5
