BeiGene Enters Next Phase of Global Growth with Announcement of Second Quarter 2024 Financial Results and Corporate Updates
-
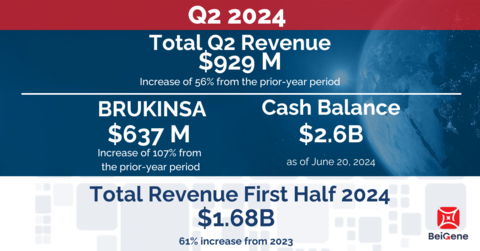
Generated total revenues of
$929 million 56% from the prior-year period; reduced GAAP operating loss and achieved non-GAAP operating income -
Strengthened hematology leadership with global BRUKINSA revenues of
$637 million 107% from the prior-year period; advanced pivotal programs for BCL2 inhibitor sonrotoclax and BTK-targeted degrader BGB-16673 - Advanced innovative solid tumor pipeline of more than 15 investigational molecules, including ADCs, multispecific antibodies, and targeted therapies for lung, breast, and gastrointestinal cancers
-
Strengthened global presence with opening of
$800 million U.S. biologics manufacturing facility and clinical R&D center inNew Jersey and proposal to redomicile fromCayman Islands toSwitzerland , an innovative biotech ecosystem for life sciences leaders and institutions
(Graphic: Business Wire)
“This was a tremendous second quarter and an inflection point as BeiGene achieved positive non-GAAP operating income with rapidly increasing global revenues and continued financial discipline. Having now reached this milestone, we will further build on our differentiated, strategic capabilities as a leading, global oncology innovator,” said John V. Oyler, Co-Founder, Chairman and CEO of BeiGene. “BRUKINSA is emerging as the BTKi class leader in the
Financial Highlights
(Amounts in thousands of
|
|
Three Months Ended June 30, |
|
|
|
Six Months Ended June 30, |
|
|
||||||||||||||
(in thousands, except percentages) |
|
|
2024 |
|
|
|
2023 |
|
|
% Change |
|
|
2024 |
|
|
|
2023 |
|
|
% Change |
||
Net product revenues |
|
$ |
921,146 |
|
|
$ |
553,745 |
|
|
66 |
% |
|
$ |
1,668,064 |
|
|
$ |
964,036 |
|
|
73 |
% |
Net revenue from collaborations |
|
$ |
8,020 |
|
|
$ |
41,516 |
|
|
(81 |
)% |
|
$ |
12,754 |
|
|
$ |
79,026 |
|
|
(84 |
)% |
Total Revenue |
|
$ |
929,166 |
|
|
$ |
595,261 |
|
|
56 |
% |
|
$ |
1,680,818 |
|
|
$ |
1,043,062 |
|
|
61 |
% |
|
|
|
|
|
|
|
|
|
|
|
|
|
||||||||||
GAAP loss from operations |
|
$ |
(107,161 |
) |
|
$ |
(318,715 |
) |
|
(66 |
)% |
|
$ |
(368,509 |
) |
|
$ |
(689,973 |
) |
|
(47 |
)% |
Adjusted income(loss) from operations* |
|
$ |
48,464 |
|
|
$ |
(193,051 |
) |
|
125 |
% |
|
$ |
(98,877 |
) |
|
$ |
(468,910 |
) |
|
(79 |
)% |
* For an explanation of our use of non-GAAP financial measures refer to the "Use of Non-GAAP Financial Measures" section later in this press release and for a reconciliation of each non-GAAP financial measure to the most comparable GAAP measures, see the table at the end of this press release.
Key Business Updates
BRUKINSA® (zanubrutinib)
-
U.S. sales of BRUKINSA totaled$479 million 114% over the prior-year period, with more than60% of the quarter over quarter demand growth coming from expanded use in CLL as BRUKINSA continued to gain share in CLL new patient starts; BRUKINSA sales inEurope totaled$81 million 209% , driven by increased market share across all major markets, includingGermany ,Italy ,Spain ,France and theUK ; -
Presented data from Arm D of the Phase 3 SEQUOIA trial evaluating BRUKINSA in combination with venetoclax in treatment-naïve (TN) patients with high-risk CLL and/or small lymphocytic lymphoma (SLL) with del(17p) and/or TP53 mutation as an oral presentation at the European Hematology Association (EHA) 2024 Hybrid Congress; preliminary data demonstrated an overall response rate of
100% in 65 response-evaluable patients and a rate of complete response (CR) plus CR with incomplete hematopoietic recovery (CRi) of48% ; and - Presented new analyses highlighting improved progression free survival and response rates and a low usage of antihypertensive medicines for patients treated with BRUKINSA compared to other Bruton’s tyrosine kinase inhibitors (BTKis) used to treat CLL/SLL, including acalabrutinib and ibrutinib at the American Society of Clinical Oncology (ASCO) Annual Meeting and EHA.
TEVIMBRA® (tislelizumab)
-
Sales of tislelizumab totaled
$158 million 6% compared to the prior-year period; - Presented new data from the Phase 3 RATIONALE-306 study evaluating TEVIMBRA plus chemotherapy in patients with advanced or metastatic esophageal squamous cell carcinoma (ESCC) at ASCO; and
-
Received an update that the
U.S. Food and Drug Administration (FDA) has deferred approval for tislelizumab in first-line unresectable, recurrent, locally advanced, or metastatic ESCC with a target PDUFA action date of July 2024 on account of a delay in scheduling clinical site inspections.
Key Pipeline Highlights
Hematology
Sonrotoclax (BCL2 inhibitor)
- More than 1,000 patients enrolled to date across the program;
-
Completed enrollment in global Phase 2 trial in R/R mantle cell lymphoma (MCL) and continued enrollment in global Phase 2 trial in Waldenström’s macroglobulinemia (WM) and
China -only Phase 2 trial in R/R CLL, all with registrational intent, as well as continued enrollment in global Phase 3 CELESTIAL trial in combination with BRUKINSA in TN CLL; - At EHA 2024, presented data highlighting deep and durable responses with tolerable safety profile in Phase 1 studies in combination with BRUKINSA in R/R CLL/SLL and R/R MCL as well as results of additional Phase 1 trials demonstrating encouraging response rates, durable responses and manageable safety profiles as monotherapy in R/R WM, in combination with azacitidine in both TN and R/R acute myeloid leukemia, and in combination with dexamethasone in R/R multiple myeloma harboring translocation (11;14);
- Received FDA fast track designation for R/R WM; and
- Anticipating first subjects enrolled in Phase 3 programs in R/R CLL and R/R MCL in the fourth quarter of 2024 or first quarter of 2025.
BGB-16673 (BTK CDAC)
- More than 300 patients enrolled to date across the program; continued to enroll potentially registration enabling expansion cohorts in R/R MCL and R/R CLL; and
- At EHA 2024, presented data highlighting promising preliminary efficacy and safety in patients with R/R CLL/SLL; anticipating first subject enrolled in Phase 3 program in fourth quarter of 2024 or first quarter of 2025.
Solid Tumors
Lung Cancer
- Multiple randomized tislelizumab lung cancer combination cohorts with BGB-A445 (anti-OX40), LBL-007 (anti-LAG3) and BGB-15025 (HPK1 inhibitor) expected to read out in 2024;
- BGB-C354 (B7H3 ADC): Initiated dose escalation for the Company’s first internally developed ADC;
- BGB-R046 (IL-15 prodrug): Initiated dose escalation; this is a cytokine prodrug, leveraging protease-dependent release of active IL-15 in the tumor microenvironment and eliciting anti-tumor activity by promoting T and natural killer (NK) cell expansion; and
- Pan-KRAS, MTA-cooperative PRMT5 inhibitors and EGFR CDAC targeted protein degrader on track to enter the clinic in the second half of 2024.
Breast and Gynecologic Cancers
- BGB-43395 (CDK4 inhibitor): Continued dose escalation in monotherapy and in combination with fulvestrant and letrozole in the anticipated efficacious dose range with no dose limiting toxicities observed; more than 60 patients enrolled to date across the program; potential to share first readout of Phase 1 data in the fourth quarter of 2024; and
- BG-68501 (CDK2 inhibitor) and BG-C9074 (B7H4 ADC): Continued monotherapy dose escalation, with pharmacokinetics as expected and no dose limiting toxicities observed.
Gastrointestinal Cancers
- Tislelizumab combination cohorts with LBL-007 (anti-LAG3) in ESCC reading out in 2024;
- BLA accepted by the NMPA for zanidatamab for the treatment of second-line biliary tract cancer; and
- CEA ADC, FGFR2b ADC and GPC3x4-1BB bispecific antibody on track to enter the clinic in the second half of 2024.
Immunology & Inflammation
- Initiated clinical development of BGB-43035 (IRAK4 CDAC) with potential to induce deeper and faster IRAK4 degradation with stronger cytokine inhibition than competitors; this is the second targeted degrader from the Company’s proprietary CDAC platform.
Corporate Updates
-
Opened flagship
U.S. biologics manufacturing facility and clinical R&D center at the Princeton West Innovation Campus inHopewell, N.J. ; the facility includes 400,000 square feet of dedicated manufacturing space; and -
Announced intent to change jurisdiction of incorporation from the
Cayman Islands toBasel, Switzerland , enabling the Company to deepen its roots in a global biopharmaceutical hub as it further executes on its global growth strategy to reach more patients around the world with its innovative medicines; this redomiciliation is subject to shareholder approval.
Second Quarter 2024 Financial Highlights
Revenue for the three months ended June 30, 2024, was
Product Revenue for the three months ended June 30, 2024, was
Gross Margin as a percentage of global product revenue for the second quarter of 2024 was
Operating Expenses
The following table summarizes operating expenses for the second quarter 2024 and 2023, respectively:
|
|
|
|
|
|
|
|
|
|
|
|
|
||||||
|
|
GAAP |
|
|
|
Non-GAAP |
|
|
||||||||||
(in thousands, except percentages) |
|
Q2 2024 |
|
Q2 2023 |
|
% Change |
|
Q2 2024 |
|
Q2 2023 |
|
% |
||||||
Research and development |
|
$ |
454,466 |
|
$ |
422,764 |
|
7 |
% |
|
$ |
382,509 |
|
$ |
363,735 |
|
5 |
% |
Selling, general and administrative |
|
$ |
443,729 |
|
$ |
395,034 |
|
12 |
% |
|
$ |
363,922 |
|
$ |
331,607 |
|
10 |
% |
Amortization |
|
$ |
— |
|
$ |
188 |
|
(100 |
)% |
|
$ |
— |
|
$ |
— |
|
NM |
|
Total operating expenses |
|
$ |
898,195 |
|
$ |
817,986 |
|
10 |
% |
|
$ |
746,431 |
|
$ |
695,342 |
|
7 |
% |
The following table summarizes operating expenses for the first half 2024 and 2023, respectively:
|
|
|
|
|
|
|
|
|
|
|
|
|
||||||
|
|
GAAP |
|
|
|
Non-GAAP |
|
|
||||||||||
(in thousands, except percentages) |
|
Q2 YTD 2024 |
|
Q2 YTD 2023 |
|
% Change |
|
Q2 YTD 2024 |
|
Q2 YTD 2023 |
|
% Change |
||||||
Research and development |
|
$ |
915,104 |
|
$ |
831,348 |
|
10 |
% |
|
$ |
787,949 |
|
$ |
725,431 |
|
9 |
% |
Selling, general and administrative |
|
$ |
871,156 |
|
$ |
723,533 |
|
20 |
% |
|
$ |
736,068 |
|
$ |
614,761 |
|
20 |
% |
Amortization |
|
$ |
— |
|
$ |
375 |
|
(100 |
)% |
|
$ |
— |
|
$ |
— |
|
NM |
|
Total operating expenses |
|
$ |
1,786,260 |
|
$ |
1,555,256 |
|
15 |
% |
|
$ |
1,524,017 |
|
$ |
1,340,192 |
|
14 |
% |
Research and Development (R&D) Expenses increased for the second quarter of 2024 compared to the prior-year period on both a GAAP and adjusted basis primarily due to advancing preclinical programs into the clinic and early clinical programs into late stage. Upfront fees and milestone payments related to in-process R&D for in-licensed assets totaled
Selling, General and Administrative (SG&A) Expenses increased for the second quarter of 2024 compared to the prior-year period on both a GAAP and adjusted basis due to continued investment in the global commercial launch of BRUKINSA, primarily in the
Income (Loss) from Operations in the second quarter of 2024 operating loss decreased
GAAP Net Loss improved for the quarter ended June 30, 2024, compared to the prior-year period, as our product revenue growth and management of expenses is driving increased operating leverage.
For the quarter ended June 30, 2024, net loss per share were
Cash Used in Operations for the quarter ended June 30, 2024, totaled
For further details on BeiGene’s Second Quarter 2024 Financial Statements, please see BeiGene’s Quarterly Report on Form 10-Q for the second quarter of 2024 filed with the
About BeiGene
BeiGene is a global oncology company that is discovering and developing innovative treatments that are more affordable and accessible to cancer patients worldwide. With a broad portfolio, we are expediting development of our diverse pipeline of novel therapeutics through our internal capabilities and collaborations. We are committed to radically improving access to medicines for far more patients who need them. Our growing global team of more than 10,000 colleagues spans five continents. To learn more about BeiGene, please visit www.beigene.com and follow us on LinkedIn, X (formerly known as Twitter) and Facebook.
Forward-Looking Statements
This press release contains forward-looking statements within the meaning of the Private Securities Litigation Reform Act of 1995 and other federal securities laws, including statements regarding BeiGene’s potential to further emerge as a leading, global oncology innovator; BeiGene’s ability to expand into other highly prevalent cancer types; BeiGene’s preliminary clinical data and activities, as well as anticipated read outs; whether shareholders will approve BeiGene’s change in jurisdiction of incorporation and if approved, whether this change will enable BeiGene to further execute on its global growth strategy; and BeiGene’s plans, commitments, aspirations and goals under the caption “About BeiGene”. Actual results may differ materially from those indicated in the forward-looking statements as a result of various important factors, including BeiGene’s ability to demonstrate the efficacy and safety of its drug candidates; the clinical results for its drug candidates, which may not support further development or marketing approval; actions of regulatory agencies, which may affect the initiation, timing and progress of clinical trials and marketing approval; BeiGene’s ability to achieve commercial success for its marketed medicines and drug candidates, if approved; BeiGene's ability to obtain and maintain protection of intellectual property for its medicines and technology; BeiGene’s reliance on third parties to conduct drug development, manufacturing, commercialization, and other services; BeiGene’s limited experience in obtaining regulatory approvals and commercializing pharmaceutical products; BeiGene’s ability to obtain additional funding for operations and to complete the development of its drug candidates and achieve and maintain profitability; and those risks more fully discussed in the section entitled “Risk Factors” in BeiGene’s most recent quarterly report on Form 10-Q, as well as discussions of potential risks, uncertainties, and other important factors in BeiGene’s subsequent filings with the
Condensed Consolidated Statements of Operations (
(Amounts in thousands of
|
Three Months Ended June 30, |
|
Six Months Ended June 30, |
||||||||||||
|
|
2024 |
|
|
|
2023 |
|
|
|
2024 |
|
|
|
2023 |
|
|
(Unaudited) |
|
(Unaudited) |
||||||||||||
Revenues |
|
|
|
|
|
|
|
||||||||
Product revenue, net |
$ |
921,146 |
|
|
$ |
553,745 |
|
|
$ |
1,668,064 |
|
|
$ |
964,036 |
|
Collaboration revenue |
|
8,020 |
|
|
|
41,516 |
|
|
|
12,754 |
|
|
|
79,026 |
|
Total revenues |
|
929,166 |
|
|
|
595,261 |
|
|
|
1,680,818 |
|
|
|
1,043,062 |
|
Cost of sales - products |
|
138,132 |
|
|
|
95,990 |
|
|
|
263,067 |
|
|
|
177,779 |
|
Gross profit |
|
791,034 |
|
|
|
499,271 |
|
|
|
1,417,751 |
|
|
|
865,283 |
|
Operating expenses: |
|
|
|
|
|
|
|
||||||||
Research and development |
|
454,466 |
|
|
|
422,764 |
|
|
|
915,104 |
|
|
|
831,348 |
|
Selling, general and administrative |
|
443,729 |
|
|
|
395,034 |
|
|
|
871,156 |
|
|
|
723,533 |
|
Amortization of intangible assets |
|
— |
|
|
|
188 |
|
|
|
— |
|
|
|
375 |
|
Total operating expenses |
|
898,195 |
|
|
|
817,986 |
|
|
|
1,786,260 |
|
|
|
1,555,256 |
|
Loss from operations |
|
(107,161 |
) |
|
|
(318,715 |
) |
|
|
(368,509 |
) |
|
|
(689,973 |
) |
Interest income, net |
|
13,225 |
|
|
|
15,070 |
|
|
|
29,385 |
|
|
|
31,086 |
|
Other expense, net |
|
(11,984 |
) |
|
|
(63,818 |
) |
|
|
(10,222 |
) |
|
|
(45,515 |
) |
Loss before income taxes |
|
(105,920 |
) |
|
|
(367,463 |
) |
|
|
(349,346 |
) |
|
|
(704,402 |
) |
Income tax expense |
|
14,485 |
|
|
|
13,674 |
|
|
|
22,209 |
|
|
|
25,166 |
|
Net loss |
|
(120,405 |
) |
|
|
(381,137 |
) |
|
|
(371,555 |
) |
|
|
(729,568 |
) |
|
|
|
|
|
|
|
|
||||||||
Net loss per share, basic and diluted |
$ |
(0.09 |
) |
|
$ |
(0.28 |
) |
|
$ |
(0.27 |
) |
|
$ |
(0.54 |
) |
Weighted-average shares outstanding—basic and diluted |
|
1,361,082,567 |
|
|
|
1,360,224,377 |
|
|
|
1,358,315,145 |
|
|
|
1,357,211,308 |
|
|
|
|
|
|
|
|
|
||||||||
Net loss per ADS, basic and diluted |
$ |
(1.15 |
) |
|
$ |
(3.64 |
) |
|
$ |
(3.56 |
) |
|
$ |
(6.99 |
) |
Weighted-average ADSs outstanding—basic and diluted |
|
104,698,659 |
|
|
|
104,632,644 |
|
|
|
104,485,780 |
|
|
|
104,400,870 |
|
Select Condensed Consolidated Balance Sheet Data (
(Amounts in thousands of
|
|
|
|
||
|
As of |
||||
|
June 30, |
|
December 31, |
||
|
2024 |
|
2023 |
||
|
(unaudited) |
|
(audited) |
||
Assets: |
|
|
|
||
Cash, cash equivalents, and restricted cash |
$ |
2,617,931 |
|
$ |
3,185,984 |
Accounts receivable, net |
|
529,449 |
|
|
358,027 |
Inventories |
|
443,260 |
|
|
416,122 |
Property, plant and equipment, net |
|
1,516,491 |
|
|
1,324,154 |
Total assets |
|
5,712,179 |
|
|
5,805,275 |
Liabilities and equity: |
|
|
|
||
Accounts payable |
|
333,022 |
|
|
315,111 |
Accrued expenses and other payables |
|
646,538 |
|
|
693,731 |
R&D cost share liability |
|
203,627 |
|
|
238,666 |
Debt |
|
1,036,928 |
|
|
885,984 |
Total liabilities |
|
2,345,924 |
|
|
2,267,948 |
Total equity |
$ |
3,366,255 |
|
$ |
3,537,327 |
Note Regarding Use of Non-GAAP Financial Measures
BeiGene provides certain non-GAAP financial measures, including Adjusted Operating Expenses and Adjusted Operating Loss and certain other non-GAAP income statement line items, each of which include adjustments to GAAP figures. These non-GAAP financial measures are intended to provide additional information on BeiGene’s operating performance. Adjustments to BeiGene’s GAAP figures exclude, as applicable, non-cash items such as share-based compensation, depreciation and amortization. Certain other special items or substantive events may also be included in the non-GAAP adjustments periodically when their magnitude is significant within the periods incurred. BeiGene maintains an established non-GAAP policy that guides the determination of what costs will be excluded in non-GAAP financial measures and the related protocols, controls and approval with respect to the use of such measures. BeiGene believes that these non-GAAP financial measures, when considered together with the GAAP figures, can enhance an overall understanding of BeiGene’s operating performance. The non-GAAP financial measures are included with the intent of providing investors with a more complete understanding of the Company’s historical and expected financial results and trends and to facilitate comparisons between periods and with respect to projected information. In addition, these non-GAAP financial measures are among the indicators BeiGene’s management uses for planning and forecasting purposes and measuring the Company’s performance. These non-GAAP financial measures should be considered in addition to, and not as a substitute for, or superior to, financial measures calculated in accordance with GAAP. The non-GAAP financial measures used by the Company may be calculated differently from, and therefore may not be comparable to, non-GAAP financial measures used by other companies.
RECONCILIATION OF SELECTED GAAP MEASURES TO NON-GAAP MEASURES
(in thousands, except per share amounts)
(unaudited)
|
Three Months Ended |
|
Six Months Ended |
||||||||||||
|
June 30, |
|
June 30, |
||||||||||||
|
|
2024 |
|
|
|
2023 |
|
|
|
2024 |
|
|
|
2023 |
|
|
(in thousands) |
|
(in thousands) |
||||||||||||
Reconciliation of GAAP to adjusted cost of sales - products: |
|
|
|
|
|
|
|
||||||||
GAAP cost of sales - products |
$ |
138,132 |
|
|
$ |
95,990 |
|
|
$ |
263,067 |
|
|
$ |
177,779 |
|
Less: Depreciation |
|
2,684 |
|
|
|
2,180 |
|
|
|
5,029 |
|
|
|
4,360 |
|
Less: Amortization of intangibles |
|
1,177 |
|
|
|
840 |
|
|
|
2,360 |
|
|
|
1,639 |
|
Adjusted cost of sales - products |
$ |
134,271 |
|
|
$ |
92,970 |
|
|
$ |
255,678 |
|
|
$ |
171,780 |
|
|
|
|
|
|
|
|
|
||||||||
Reconciliation of GAAP to adjusted research and development: |
|
|
|
|
|
|
|
||||||||
GAAP research and development |
$ |
454,466 |
|
|
$ |
422,764 |
|
|
$ |
915,104 |
|
|
$ |
831,348 |
|
Less: Share-based compensation cost |
|
55,406 |
|
|
|
45,948 |
|
|
|
93,451 |
|
|
|
79,976 |
|
Less: Depreciation |
|
16,551 |
|
|
|
13,081 |
|
|
|
33,704 |
|
|
|
25,941 |
|
Adjusted research and development |
$ |
382,509 |
|
|
$ |
363,735 |
|
|
$ |
787,949 |
|
|
$ |
725,431 |
|
|
|
|
|
|
|
|
|
||||||||
Reconciliation of GAAP to adjusted selling, general and administrative: |
|
|
|
|
|
|
|
||||||||
GAAP selling, general and administrative |
$ |
443,729 |
|
|
$ |
395,034 |
|
|
$ |
871,156 |
|
|
$ |
723,533 |
|
Less: Share-based compensation cost |
|
75,288 |
|
|
|
57,381 |
|
|
|
125,957 |
|
|
|
98,741 |
|
Less: Depreciation |
|
4,519 |
|
|
|
6,046 |
|
|
|
9,131 |
|
|
|
10,031 |
|
Adjusted selling, general and administrative |
$ |
363,922 |
|
|
$ |
331,607 |
|
|
$ |
736,068 |
|
|
$ |
614,761 |
|
|
|
|
|
|
|
|
|
||||||||
Reconciliation of GAAP to adjusted operating expenses |
|
|
|
|
|
|
|
||||||||
GAAP operating expenses |
$ |
898,195 |
|
|
$ |
817,986 |
|
|
$ |
1,786,260 |
|
|
$ |
1,555,256 |
|
Less: Share-based compensation cost |
|
130,694 |
|
|
|
103,329 |
|
|
|
219,408 |
|
|
|
178,717 |
|
Less: Depreciation |
|
21,070 |
|
|
|
19,127 |
|
|
|
42,835 |
|
|
|
35,972 |
|
Less: Amortization of intangibles |
|
— |
|
|
|
188 |
|
|
|
— |
|
|
|
375 |
|
Adjusted operating expenses |
$ |
746,431 |
|
|
$ |
695,342 |
|
|
$ |
1,524,017 |
|
|
$ |
1,340,192 |
|
|
|
|
|
|
|
|
|
||||||||
Reconciliation of GAAP to adjusted income (loss) from operations: |
|
|
|
|
|
|
|
||||||||
GAAP loss from operations |
$ |
(107,161 |
) |
|
$ |
(318,715 |
) |
|
$ |
(368,509 |
) |
|
$ |
(689,973 |
) |
Plus: Share-based compensation cost |
|
130,694 |
|
|
|
103,329 |
|
|
|
219,408 |
|
|
|
178,717 |
|
Plus: Depreciation |
|
23,754 |
|
|
|
21,307 |
|
|
|
47,864 |
|
|
|
40,332 |
|
Plus: Amortization of intangibles |
|
1,177 |
|
|
|
1,028 |
|
|
|
2,360 |
|
|
|
2,014 |
|
Adjusted income (loss) from operations |
$ |
48,464 |
|
|
$ |
(193,051 |
) |
|
$ |
(98,877 |
) |
|
$ |
(468,910 |
) |
|
|
|
|
|
|
|
|
||||||||
View source version on businesswire.com: https://www.businesswire.com/news/home/20240807337131/en/
Investor Contact
Liza Heapes
+1 857-302-5663
ir@beigene.com
Media Contact
Kyle Blankenship
+1 667-351-5176
media@beigene.com
Source: BeiGene