DAT Truckload Volume Index: Freight volumes bounced back in August
- Truckload freight volumes increased in August
- Van TVI increased by 8% from July
- Reefer TVI increased by 4% from July
- Flatbed TVI increased by 9% from July
- Load-to-truck ratios for van and reefer rose in August
- Spot line-haul rates strengthened
- Line-haul rates declined compared to July
- Contract rates have not increased since May 2022
Insights
Analyzing...

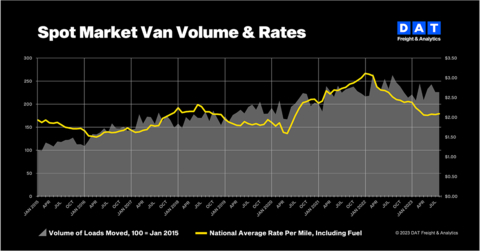
Freight volumes bounced back in August (Graphic: DAT Freight & Analytics)
Buoyed by shipments of retail goods and fresh food, the DAT Truckload Volume Index (TVI) increased for van, refrigerated (“reefer”) and flatbed freight compared to July:
-
Van TVI: 241, up
8% from July and down8% year over year -
Reefer TVI: 175, up
4% from July and down5% year over year -
Flatbed TVI: 259, up
9% from July and down0.4% year over year
Load-to-truck ratios strengthened
DAT’s national average van and reefer load-to-truck ratios rose in August, reflecting higher demand for these services:
- Van ratio: 2.8, up from 2.6 in July, meaning there were 2.8 loads for every truck on the DAT One marketplace
- Reefer ratio: 4.4, up from 3.8
- Flatbed ratio: 6.0, down from 7.1
Spot line-haul rates slipped
Broker-to-carrier benchmark spot rates strengthened as carriers negotiated to cover rising fuel expenses. The DAT benchmark spot van rate was
Line-haul rates, which subtract an amount equal to a fuel surcharge, tumbled compared to July:
-
Line-haul van rate:
$1.57 6 cents -
Line-haul reefer rate:
$1.94 2 cents -
Line-haul flatbed rate:
$1.89 12 cents
Contract rates declined
DAT benchmark rates for contracted freight have not increased month over month since May 2022:
-
Contract van rate:
$2.57 -
Contract reefer rate:
$2.99 8 cents -
Contract flatbed rate:
$3.19 10 cents
“At
About the DAT Truckload Volume Index
The DAT Truckload Volume Index reflects the change in the number of loads with a pickup date during that month; the actual index number is normalized each month to accommodate any new data sources without distortion. A baseline of 100 equals the number of loads moved in January 2015, as recorded in DAT RateView, a truckload pricing database and analysis tool with rates paid on an average of 3 million loads per month.
Spot truckload rates are negotiated for each load and paid to the carrier by a freight broker. National average spot rates are derived from payments to carriers by freight brokers, third-party logistics providers and other transportation buyers for hauls of 250 miles or more with a pickup date during the month reported. DAT’s rate analysis is based on
Load-to-truck ratios reflect truckload supply and demand on the DAT One marketplace and indicate the pricing environment for spot truckload freight.
About DAT Freight & Analytics
DAT Freight & Analytics operates the largest truckload freight marketplace in
Founded in 1978, DAT is a business unit of Roper Technologies (Nasdaq: ROP), a constituent of the S&P 500 and Fortune 1000 indices.
View source version on businesswire.com: https://www.businesswire.com/news/home/20230918882743/en/
Annabel Reeves
Corporate Communications, DAT Freight & Analytics
PR@dat.com / annabel.reeves@dat.com; 503-501-0143
Source: DAT Freight & Analytics


