Oak View Bankshares, Inc. Announces Another Strong Quarter of Performance
Oak View Bankshares, Inc. (OTC Pink:OAKV) reported strong financial performance for Q2 2024. Net income increased by 76.89% to $1.83 million compared to Q2 2023. For the first half of 2024, net income rose by 54.79% to $3.17 million. Earnings per share for Q2 2024 were $0.62, up from $0.35 in Q2 2023.
Key highlights include:
- Return on average assets: 1.17%
- Return on average equity: 21.64%
- Total assets: $629.91 million
- Total loans: $317.57 million
- Total deposits: $527.46 million
The bank maintains strong regulatory capital and outstanding asset quality. On-balance sheet liquidity remains robust at $501.49 million as of June 30, 2024.
Oak View Bankshares, Inc. (OTC Pink:OAKV) ha riportato una forte performance finanziaria per il secondo trimestre del 2024. Il reddito netto è aumentato del 76,89% a $1,83 milioni rispetto al secondo trimestre del 2023. Per la prima metà del 2024, il reddito netto è salito del 54,79% a $3,17 milioni. Gli utili per azione per il secondo trimestre del 2024 sono stati di $0,62, in aumento rispetto a $0,35 nel secondo trimestre del 2023.
I punti salienti includono:
- Rendimento medio degli attivi: 1,17%
- Rendimento medio del capitale: 21,64%
- Attivi totali: $629,91 milioni
- Prestiti totali: $317,57 milioni
- Depositi totali: $527,46 milioni
La banca mantiene un forte capitale regolamentare e una qualità degli attivi eccezionale. La liquidità a bilancio rimane robusta a $501,49 milioni al 30 giugno 2024.
Oak View Bankshares, Inc. (OTC Pink:OAKV) reportó un fuerte desempeño financiero para el segundo trimestre de 2024. Los ingresos netos aumentaron un 76.89% a $1.83 millones en comparación con el segundo trimestre de 2023. Para la primera mitad de 2024, los ingresos netos crecieron un 54.79% a $3.17 millones. Las ganancias por acción para el segundo trimestre de 2024 fueron de $0.62, frente a $0.35 en el segundo trimestre de 2023.
Los aspectos destacados incluyen:
- Retorno sobre activos promedio: 1.17%
- Retorno sobre patrimonio promedio: 21.64%
- Activos totales: $629.91 millones
- Total de préstamos: $317.57 millones
- Total de depósitos: $527.46 millones
El banco mantiene un sólido capital regulador y una calidad de activos excepcional. La liquidez en balance se mantiene robusta en $501.49 millones hasta el 30 de junio de 2024.
오크 뷰 뱅크쉐어스, Inc. (OTC Pink:OAKV)는 2024년 2분기 강력한 금융 성과를 보고했습니다. 순이익은 2023년 2분기 대비 76.89% 증가하여 $1.83 백만 달러에 달했습니다. 2024년 상반기 동안 순이익은 54.79% 증가하여 $3.17 백만 달러에 이릅니다. 2024년 2분기의 주당 순이익은 $0.62로, 2023년 2분기의 $0.35에서 증가했습니다.
주요 강조 사항은 다음과 같습니다:
- 평균 자산 수익률: 1.17%
- 평균 자기자본 수익률: 21.64%
- 총 자산: $629.91 백만 달러
- 총 대출: $317.57 백만 달러
- 총 예금: $527.46 백만 달러
은행은 강력한 규제 자본과 뛰어난 자산 품질을 유지하고 있습니다. 2024년 6월 30일 기준으로 대차대조표의 유동성은 $501.49 백만 달러로 안정적입니다.
Oak View Bankshares, Inc. (OTC Pink:OAKV) a signalé une forte performance financière pour le deuxième trimestre de 2024. Le revenu net a augmenté de 76,89% pour atteindre 1,83 million de dollars par rapport au deuxième trimestre de 2023. Pour le premier semestre de 2024, le revenu net a progressé de 54,79% à 3,17 millions de dollars. Le bénéfice par action pour le deuxième trimestre de 2024 était de 0,62 $ contre 0,35 $ au deuxième trimestre de 2023.
Les points forts incluent :
- Retour sur actifs moyens : 1,17%
- Retour sur fonds propres moyens : 21,64%
- Actifs totaux : 629,91 millions de dollars
- Prêts totaux : 317,57 millions de dollars
- Dépôts totaux : 527,46 millions de dollars
La banque maintient un solide capital réglementaire et une qualité d'actif exceptionnelle. La liquidité sur le bilan reste robuste à 501,49 millions de dollars au 30 juin 2024.
Oak View Bankshares, Inc. (OTC Pink:OAKV) hat eine starke finanzielle Performance für das 2. Quartal 2024 gemeldet. Das Nettoeinkommen stieg um 76,89% auf 1,83 Millionen Dollar im Vergleich zum 2. Quartal 2023. Für die erste Hälfte von 2024 wuchs das Nettoeinkommen um 54,79% auf 3,17 Millionen Dollar. Der Gewinn pro Aktie für das 2. Quartal 2024 betrug 0,62 Dollar, nach 0,35 Dollar im 2. Quartal 2023.
Wichtige Highlights umfassen:
- Rendite auf durchschnittliche Vermögenswerte: 1,17%
- Rendite auf durchschnittliches Eigenkapital: 21,64%
- Gesamtvermögen: 629,91 Millionen Dollar
- Gesamtverbindungen: 317,57 Millionen Dollar
- Gesamtverträge: 527,46 Millionen Dollar
Die Bank hält starkes regulatorisches Kapital und eine hervorragende Asset-Qualität. Die Bilanzliquidität bleibt robust mit 501,49 Millionen Dollar zum 30. Juni 2024.
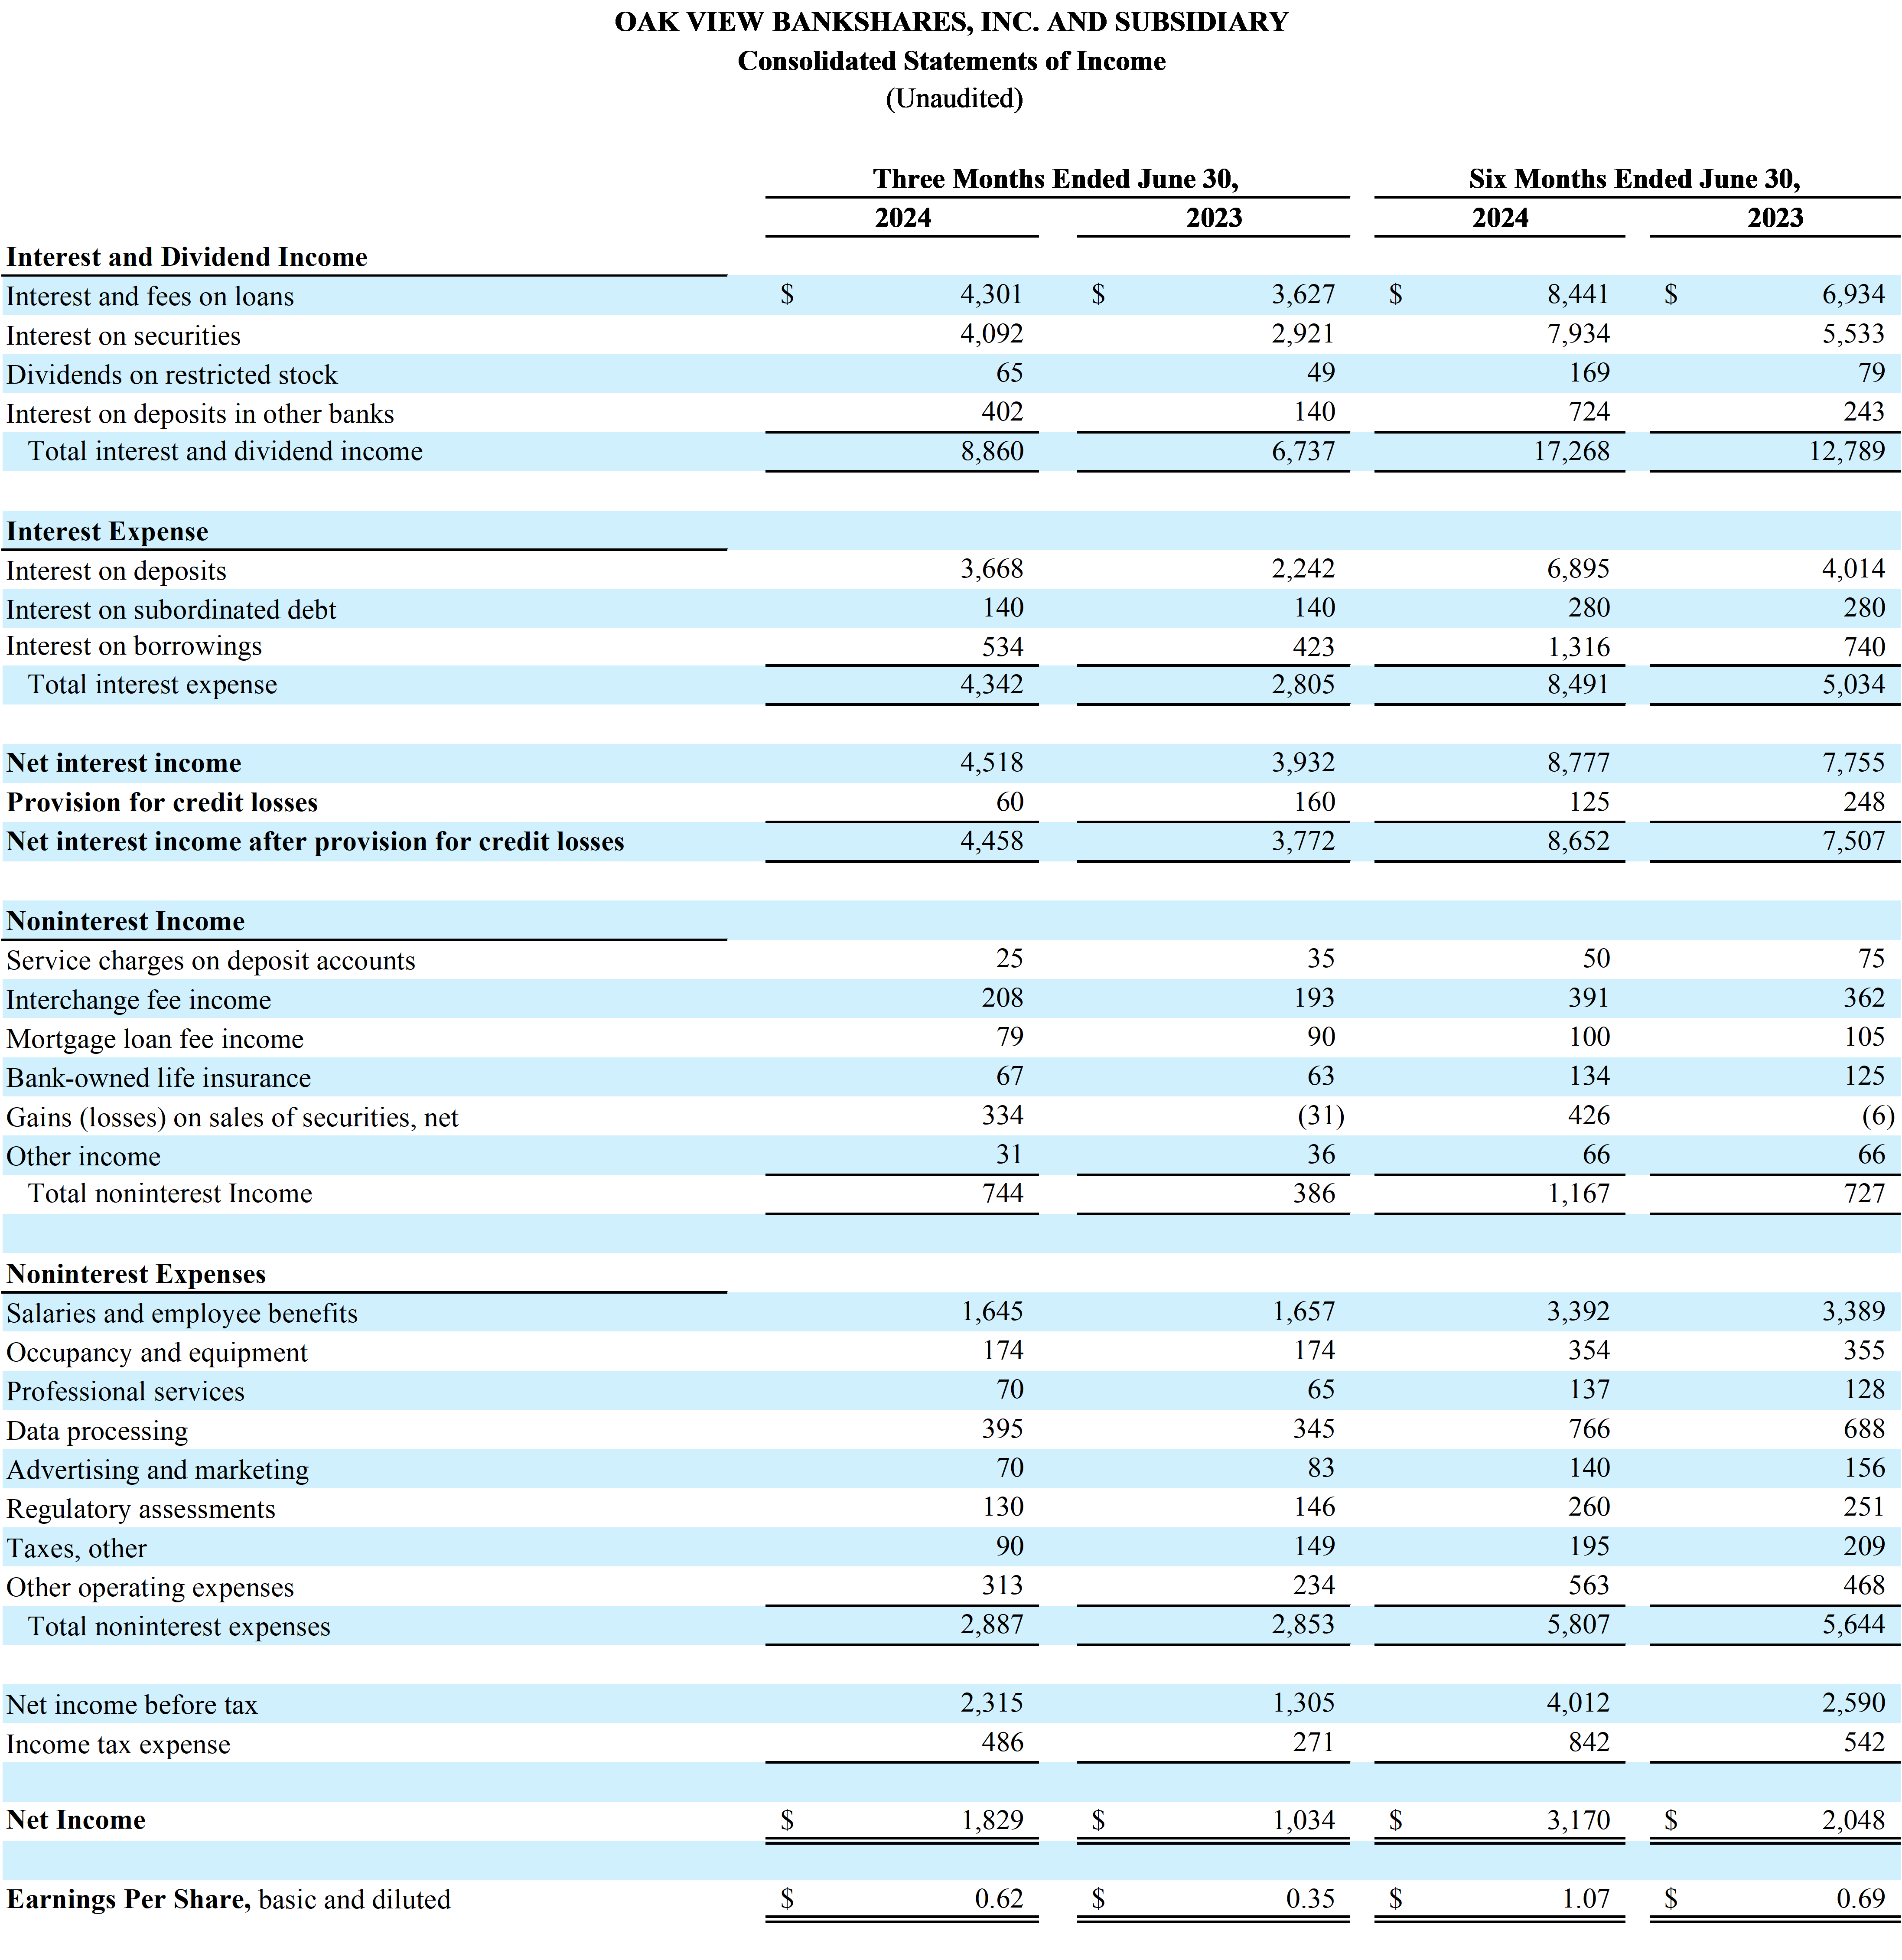
- Net income increased by 76.89% to $1.83 million in Q2 2024 compared to Q2 2023
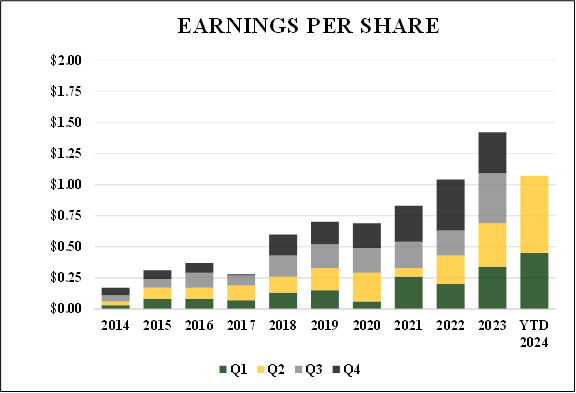
- Earnings per share rose to $0.62 in Q2 2024 from $0.35 in Q2 2023
- Return on average assets improved to 1.17% in Q2 2024 from 0.76% in Q2 2023
- Return on average equity increased to 21.64% in Q2 2024 from 14.33% in Q2 2023
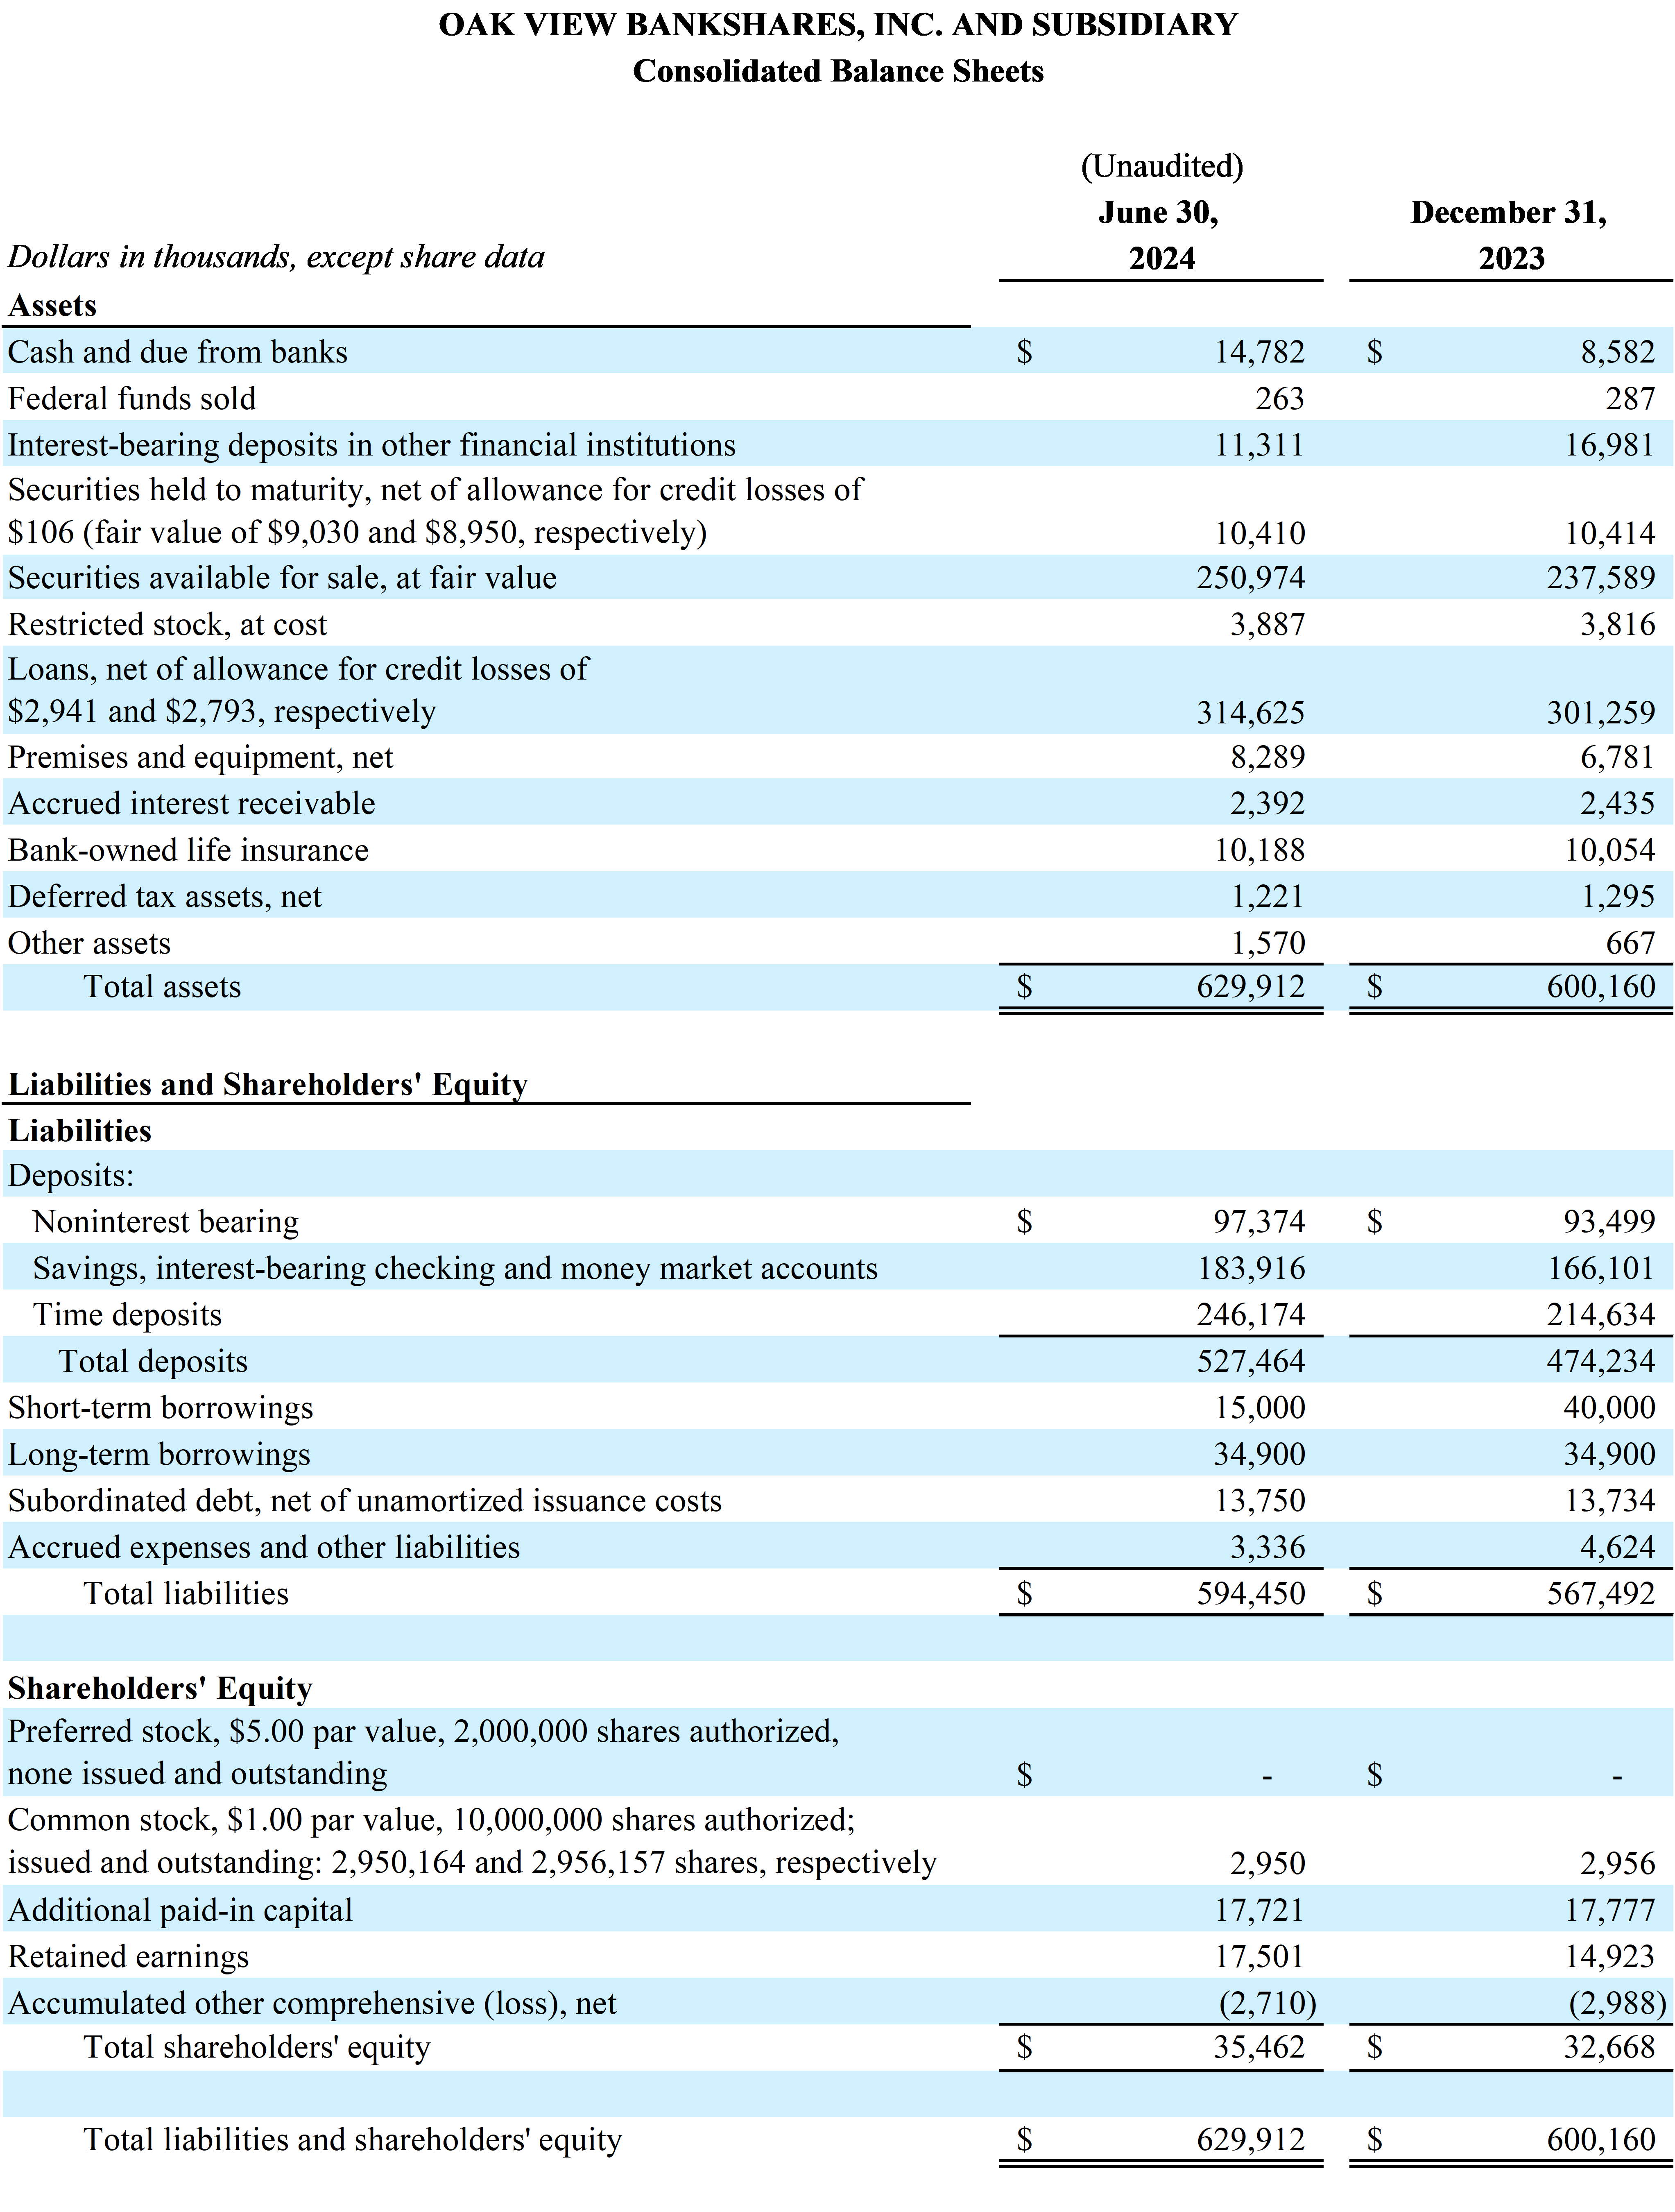
- Total assets grew to $629.91 million on June 30, 2024, from $600.16 million on December 31, 2023
- Total deposits increased to $527.46 million on June 30, 2024, from $474.23 million on December 31, 2023
- On-balance sheet liquidity strengthened to $501.49 million as of June 30, 2024, from $453.9 million as of December 31, 2023
- Net interest income grew to $4.52 million in Q2 2024 from $3.93 million in Q2 2023
- Noninterest income increased to $0.74 million in Q2 2024 from $0.39 million in Q2 2023
- Net interest margin slightly decreased to 2.95% for the first half of 2024 compared to 3.02% for the same period in 2023
- Noninterest expenses increased to $5.81 million for the first half of 2024 compared to $5.64 million for the same period in 2023
- Accumulated other comprehensive loss of $2.71 million as of June 30, 2024, primarily due to unrealized losses on available-for-sale securities
WARRENTON, VA / ACCESSWIRE / July 24, 2024 / Oak View Bankshares, Inc. (the "Company") (OTC Pink:OAKV), parent company of Oak View National Bank (the "Bank"), reported net income of
Basic and diluted earnings per share were
"As always, our goal is to strike the optimal balance among safety and soundness, profitability, and growth," said Michael Ewing, CEO and Chairman of the Board. Prudent financial management allows us to meet the financial needs of our communities while building durable value for our shareholders. These are challenging times for many in the banking industry due to high short-term interest rates and an inverted yield curve. While many community depositories pull back, we are pushing forward. We have continued to earn deposit and lending share, recruit top talent, expand our product suite, and fortify our foundation for growth - all while strengthening our financial performance. As shown in the graph, our earnings per share have increased dramatically over the past decade. Above all, this is a testament to the hard work of our teammates and the commitment of the communities we are so privileged to serve."
Selected Highlights:
Return on average assets was
1.17% and return on average equity was21.64% for the quarter ended June 30, 2024, compared to0.76% and14.33% , respectively, for the quarter ended June 30, 2023. Return on average assets was1.04% and return on average equity was19.21% for the six months ended June 30, 2024, compared to0.77% and14.44% , respectively, for the six months ended June 30, 2023.Total assets were
$629.91 million on June 30, 2024, compared to$600.16 million on December 31, 2023.Total loans were
$317.57 million on June 30, 2024, compared to$304.1 million on December 31, 2023.Total securities were
$261.49 million on June 30, 2024, compared to$248.11 million on December 31, 2023.Total deposits were
$527.46 million on June 30, 2024, compared to$474.23 million on December 31, 2023.Regulatory capital remains strong with ratios exceeding the "well capitalized" thresholds in all categories.
Asset quality continues to be outstanding.
On-balance sheet liquidity remains strong with
$501.49 million as of June 30, 2024, compared to$453.9 million as of December 31, 2023. Liquidity includes cash, unencumbered securities available for sale, and available secured and unsecured borrowing capacity.
Net Interest Income
The net interest margin was
The net interest margin was
Noninterest Income
Noninterest income was
Noninterest Expense
Noninterest expenses were
Liquidity
Liquidity remains exceptionally strong with
The Company's deposits proved to be stable with core deposits, which are defined as total deposits excluding brokered deposits, of
Asset Quality
As of June 30, 2024, the allowance for credit losses related to the loan portfolio was
The provision for credit losses was
Shareholders' Equity & Regulatory Capital
Shareholders' equity was
About Oak View Bankshares, Inc. and Oak View National Bank
Oak View Bankshares, Inc. is the parent bank holding company for Oak View National Bank, a locally owned and managed community bank serving Fauquier, Culpeper, Rappahannock, and surrounding Counties. For more information about Oak View Bankshares, Inc. and Oak View National Bank, please visit our website at www.oakviewbank.com. Member FDIC.
For additional information, contact Tammy Frazier, Executive Vice President & Chief Financial Officer, Oak View Bankshares, Inc., at 540-359-7155.
SOURCE: Oak View Bankshares, Inc.
View the original press release on accesswire.com