Medtronic reports first quarter fiscal 2025 financial results
Medtronic (NYSE: MDT) reported its Q1 FY25 financial results, ending July 26, 2024. Revenue was $7.9 billion, with an adjusted revenue of $8.0 billion, up 2.8% as reported and 5.3% organically. GAAP diluted EPS increased to $0.80, while non-GAAP diluted EPS rose to $1.23. The company raised its FY25 organic revenue growth guidance to 4.5%-5% and EPS guidance to $5.42-$5.50.
Key growth drivers included the MiniMed™ 780G automated insulin delivery system for Diabetes, and the Percept™ RC deep brain stimulator for Neuromodulation. Cardiovascular revenue grew by 5.5% as reported and 6.9% organically. Neuroscience revenue increased by 4.4% as reported and 5.3% organically.
Despite strong performance, foreign currency translation had a negative impact of $90 million on revenue and reduced non-GAAP diluted EPS by 6 cents. Medtronic executives are optimistic about sustained growth driven by new product innovations.
Medtronic (NYSE: MDT) ha riportato i risultati finanziari del Q1 FY25, conclusosi il 26 luglio 2024. Le entrate sono state di 7,9 miliardi di dollari, con entrate rettificate pari a 8,0 miliardi di dollari, in aumento del 2,8% come riportato e del 5,3% in termini organici. L'EPS diluito GAAP è aumentato a 0,80 dollari, mentre l'EPS diluito non GAAP è salito a 1,23 dollari. L'azienda ha alzato le previsioni di crescita organica delle entrate per l'anno fiscale 25 al 4,5%-5% e le previsioni per l'EPS a 5,42-5,50 dollari.
I principali fattori di crescita hanno incluso il sistema di somministrazione automatica dell'insulina MiniMed™ 780G per il diabete e lo stimolatore cerebrale profondo Percept™ RC per la neuromodulazione. Le entrate nel settore cardiovascolare sono aumentate del 5,5% come riportato e del 6,9% in termini organici. Le entrate nel campo delle neuroscienze sono aumentate del 4,4% come riportato e del 5,3% in termini organici.
Nonostante le forti performance, la traduzione delle valute estere ha avuto un impatto negativo di 90 milioni di dollari sulle entrate e ha ridotto l'EPS diluito non GAAP di 6 centesimi. I dirigenti di Medtronic sono ottimisti riguardo a una crescita sostenuta guidata dalle innovazioni nei nuovi prodotti.
Medtronic (NYSE: MDT) reportó sus resultados financieros del Q1 FY25, que finalizó el 26 de julio de 2024. Los ingresos fueron de 7.9 mil millones de dólares, con ingresos ajustados de 8.0 mil millones de dólares, un aumento del 2.8% según lo informado y del 5.3% orgánicamente. El EPS diluido GAAP aumentó a 0.80 dólares, mientras que el EPS diluido no GAAP se elevó a 1.23 dólares. La compañía elevó su guía de crecimiento orgánico de ingresos para el año fiscal 25 al 4.5%-5% y la guía de EPS a 5.42-5.50 dólares.
Los principales impulsores de crecimiento incluyeron el sistema de entrega automática de insulina MiniMed™ 780G para la diabetes y el estimulador cerebral profundo Percept™ RC para la neuromodulación. Los ingresos del sector cardiovascular crecieron un 5.5% según lo informado y un 6.9% orgánicamente. Los ingresos en neurociencia aumentaron un 4.4% según lo informado y un 5.3% orgánicamente.
A pesar del sólido desempeño, la conversión de moneda extranjera tuvo un impacto negativo de 90 millones de dólares en los ingresos y redujo el EPS diluido no GAAP en 6 centavos. Los ejecutivos de Medtronic son optimistas sobre un crecimiento sostenido impulsado por innovaciones en nuevos productos.
메드트로닉 (NYSE: MDT)는 2024년 7월 26일 종료된 FY25 1분기 재무 결과를 발표했습니다. 수익은 79억 달러였고, 조정 수익은 80억 달러로 보고되었으며, 보고된 것에서 2.8%, 유기적으로 5.3% 증가했습니다. GAAP 희석 EPS는 0.80 달러로 증가했으며, 비 GAAP 희석 EPS는 1.23 달러로 상승했습니다. 이 회사는 FY25 유기적 수익 성장 안내를 4.5%-5%로, EPS 안내를 5.42-5.50 달러로 상향 조정했습니다.
주요 성장 동력에는 당뇨병용 MiniMed™ 780G 자동 인슐린 전달 시스템과 신경 조절용 Percept™ RC 심부 뇌 자극기가 포함되었습니다. 심혈관 부문 수익은 보고된 것에서 5.5%, 유기적으로 6.9% 증가했습니다. 신경과학 부문 수익은 보고된 것에서 4.4%, 유기적으로 5.3% 증가했습니다.
강력한 성과에도 불구하고 외환 변환이 수익에 9천만 달러의 부정적인 영향을 미쳤고 비 GAAP 희석 EPS를 6센트 감소시켰습니다. 메드트로닉의 경영진은 새로운 제품 혁신에 의해 이끄는 지속적인 성장에 대해 낙관적입니다.
Medtronic (NYSE: MDT) a publié ses résultats financiers pour le 1er trimestre de l'exercice 25, se terminant le 26 juillet 2024. Les revenus étaient de 7,9 milliards de dollars, avec des revenus ajustés de 8,0 milliards de dollars, en hausse de 2,8 % par rapport à ce qui a été rapporté et de 5,3 % de manière organique. Le BPA dilué GAAP a augmenté à 0,80 dollar, tandis que le BPA dilué non GAAP a atteint 1,23 dollar. L'entreprise a relevé ses prévisions de croissance organique des revenus pour l'exercice 25 à 4,5 %-5 % et ses prévisions de BPA à 5,42-5,50 dollars.
Les principaux moteurs de croissance comprenaient le système de délivrance automatisée d'insuline MiniMed™ 780G pour le diabète et le stimulateur cérébral profond Percept™ RC pour la neuromodulation. Les revenus en cardiologie ont augmenté de 5,5 % selon les rapports et de 6,9 % de manière organique. Les revenus en neurosciences ont augmenté de 4,4 % selon les rapports et de 5,3 % de manière organique.
Malgré une performance solide, la conversion des devises étrangères a eu un impact négatif de 90 millions de dollars sur les revenus et a réduit le BPA dilué non GAAP de 6 cents. Les dirigeants de Medtronic sont optimistes quant à une croissance soutenue grâce à l'innovation dans les nouveaux produits.
Medtronic (NYSE: MDT) hat seine Finanzzahlen für das 1. Quartal des Geschäftsjahres 25, das am 26. Juli 2024 endete, veröffentlicht. Der Umsatz betrug 7,9 Milliarden Dollar, mit einem bereinigten Umsatz von 8,0 Milliarden Dollar, was einem Anstieg von 2,8% im Berichtszeitraum und 5,3% organisch entspricht. Der verwässerte EPS nach GAAP stieg auf 0,80 Dollar, während der verwässerte EPS nach Non-GAAP auf 1,23 Dollar anstieg. Das Unternehmen hob die Prognose für das organische Umsatzwachstum für das Geschäftsjahr 25 auf 4,5%-5% und die EPS-Prognose auf 5,42-5,50 Dollar an.
Die wichtigsten Wachstumstreiber waren das automatisierte Insulinabgabesystem MiniMed™ 780G für Diabetes und der tiefe Hirnstimulator Percept™ RC für die Neuromodulation. Die Umsätze im Bereich der kardiovaskulären Medizin wuchsen um 5,5% im Berichtszeitraum und um 6,9% organisch. Die Umsätze im Bereich Neurowissenschaften stiegen um 4,4% im Berichtszeitraum und um 5,3% organisch.
Trotz der starken Leistung hatte die Währungsumrechnung einen negativen Einfluss von 90 Millionen Dollar auf den Umsatz und verringerte den Non-GAAP verwässerten EPS um 6 Cent. Die Führungskräfte von Medtronic sind optimistisch in Bezug auf ein nachhaltiges Wachstum, das durch neue Produktinnovationen vorangetrieben wird.
- Revenue increased to $7.9 billion, up 2.8% as reported.
- Adjusted revenue reached $8.0 billion, growing 5.3% organically.
- GAAP diluted EPS rose to $0.80, a 36% increase.
- Non-GAAP diluted EPS increased to $1.23, up 3%.
- FY25 organic revenue growth guidance raised to 4.5%-5%.
- FY25 EPS guidance increased to $5.42-$5.50.
- Cardiovascular segment revenue grew by 5.5% as reported.
- Neuroscience segment revenue increased by 4.4% as reported.
- Foreign currency translation negatively impacted revenue by $90 million.
- Non-GAAP diluted EPS was reduced by 6 cents due to foreign currency impact.
Insights
Medtronic's Q1 FY2025 results demonstrate solid performance with
The raised FY2025 guidance is a positive signal, with organic revenue growth now expected at
Investors should note the strong cash flow and the company's ability to navigate currency headwinds, which had a
Medtronic's Q1 results highlight significant advancements across multiple medical technology fronts. The
The Cardiovascular portfolio's performance is impressive, with
In Neuroscience, the mid-teens growth in Brain Modulation and high-single digit growth in Pain Therapies demonstrate Medtronic's strong position in neuromodulation. The continued adoption of advanced technologies like the Percept™ RC deep brain stimulator and Inceptiv™ spinal cord stimulator showcases the company's innovation in addressing neurological and chronic pain conditions.
Medtronic's Q1 results reveal strategic market positioning across various healthcare segments. The company's ability to drive growth through product innovation is evident, particularly in high-growth areas like Automated Insulin Delivery and Transcatheter Aortic Valve Replacement.
The geographical performance is noteworthy, with U.S. revenue growing
The company's focus on operational efficiency is clear, with adjusted operating profit margin improving to
Looking ahead, the raised guidance indicates management's confidence in sustaining momentum. However, investors should monitor potential headwinds such as ongoing supply chain challenges and healthcare spending trends in key markets. The company's diverse portfolio and strong innovation pipeline position it well to navigate potential market fluctuations and capitalize on emerging healthcare trends.
Product innovation driving growth across diversified health tech portfolio, including Automated Insulin Delivery, Transcatheter Aortic Valve Replacement, Pulsed Field Cardiac Ablation, Pain Stimulation, and Deep Brain Stimulation
GALWAY,

Key Highlights
- Revenue of
$7.9 billion $8.0 billion 2.8% as reported and5.3% organic - GAAP diluted earnings per share (EPS) of
$0.80 $1.23 - Company increases FY25 organic revenue growth and EPS guidance
- Multiple franchises delivering, with growth acceleration in Cardiac Ablation Solutions and Neuromodulation and continued strength in Spine, Structural Heart, and Diabetes
Financial Results
Medtronic reported Q1 worldwide revenue of
- Other revenue of -
$52 million $50 million - Foreign currency translation of -
$90 million
As reported, Q1 GAAP net income and diluted earnings per share (EPS) were
"We executed, exceeded our commitments, and delivered another good quarter. Our underlying markets are healthy, we're driving operating rigor, and new product innovation is fueling diversified growth across key health tech markets," said Geoff Martha, Medtronic chairman and chief executive officer. "As we deliver innovation and execute on our transformation, we expect this to translate into strong returns for our shareholders."
Cardiovascular Portfolio
The Cardiovascular Portfolio includes the Cardiac Rhythm & Heart Failure (CRHF), Structural Heart & Aortic (SHA), and Coronary & Peripheral Vascular (CPV) divisions. Revenue of
- CRHF results included high-single digit growth in Cardiac Rhythm Management, driven by high-single digit growth in Defibrillation Solutions and low-double digit growth in Cardiac Pacing Therapies, including low-20s growth in Micra™ transcatheter pacing systems; Cardiac Ablation Solutions grew mid-single digits on strong growth of the PulseSelect™ pulsed field ablation (PFA) system
- SHA results driven by low-double digit Cardiac Surgery and high-single digit Structural Heart growth, excluding Congenital
- CPV delivered high-single digit Coronary growth with strength in guide catheters and balloons; Peripheral Vascular Health grew low-single digits, with high-single digit growth in drug-coated balloons and low-single digit growth in endoVenous products
- Evolut™ FX+ TAVR system limited
U.S. commercial release initiated during the quarter; full market release now underway
Neuroscience Portfolio
The Neuroscience Portfolio includes the Cranial & Spinal Technologies (CST), Specialty Therapies, and Neuromodulation divisions. Revenue of
- CST performance driven by continued adoption of the AiBLE™ ecosystem of spine implants and enabling technology, with high-single digit growth in both Core Spine and Biologics
- Specialty Therapies results driven by mid-single digit growth in Neurovascular with continued strength in hemorrhagic stroke products; Pelvic Health increased low-single digits on continued adoption of the InterStim X™ system; ENT grew low-single digits on strength in capital and localized drug delivery sinus implants
- Neuromodulation drove above market performance, with mid-teens growth in Brain Modulation on the continued launch of the Percept™ RC deep brain stimulator (DBS) with BrainSense™ technology; Pain Therapies grew high-single digits, including low-double digit growth in Pain Stim on the
U.S. launch of the Inceptiv™ spinal cord stimulator
Medical Surgical Portfolio
The Medical Surgical Portfolio includes the Surgical & Endoscopy (SE) and the Acute Care & Monitoring (ACM) divisions. Revenue of
- SE results included low-single digit growth in both Advanced Surgical Technologies and General Surgical Technologies, and low-single digit growth in Endoscopy, driven by strength in Endoflip™ and GI Genius™ sales
- ACM performance included low-single digit growth in Blood Oxygen Management
Diabetes
Revenue of
U.S. revenue grew mid-teens on the continued adoption of the MiniMed™ 780G automated insulin delivery (AID) system, including low-thirties CGM growth driven by very high CGM attachment, high-single digit pump growth, and a return to growth in consumables- International revenue grew low-double digits on increasing CGM attachment rates and the continued roll-out of Simplera Sync™
- Received FDA approval of Simplera™ CGM and announced global partnership with Abbott to complement future Medtronic integrated CGM offerings
Guidance
The company today raised its FY25 revenue growth and EPS guidance.
The company raised its FY25 organic revenue growth guidance to
The company raised its FY25 diluted non-GAAP EPS guidance to the new range of
"Overall revenue outperformance flowed through to the bottom line, with adjusted EPS ahead of expectations," said Gary Corona, Medtronic interim chief financial officer. "We're raising our guidance today as we expect to sustain growth from new product introductions, continue to make the investments to support those launches, and deliver on our commitment to restore earnings power."
Video Webcast Information
Medtronic will host a video webcast today, August 20, at 8:00 a.m. EDT (7:00 a.m. CDT) to provide information about its businesses for the public, investors, analysts, and news media. This webcast can be accessed by clicking on the Events icon at investorrelations.medtronic.com, and this earnings release will be archived at news.medtronic.com. Within 24 hours of the webcast, a replay of the webcast and transcript of the company's prepared remarks will be available by clicking on the Events icon at investorrelations.medtronic.com.
Medtronic plans to report its FY25 second, third, and fourth quarter results on November 19, 2024, February 18, 2025, and Wednesday, May 21, 2025, respectively. Confirmation and additional details will be provided closer to the specific event.
Financial Schedules and Earnings Presentation
The first quarter financial schedules and non-GAAP reconciliations can be viewed by clicking on the Investor Events link at investorrelations.medtronic.com. To view a printable PDF of the financial schedules and non-GAAP reconciliations, click here. To view the first quarter earnings presentation, click here.
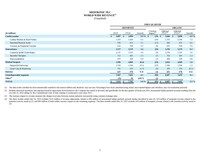
MEDTRONIC PLC WORLD WIDE REVENUE(1) (Unaudited) | |||||||||||||
FIRST QUARTER | |||||||||||||
REPORTED | ORGANIC | ||||||||||||
(in millions) | FY25 | FY24 | Growth | Currency | Adjusted | Adjusted | Growth | ||||||
Cardiovascular | $ 3,007 | $ 2,850 | 5.5 % | $ (39) | $ 3,046 | $ 2,850 | 6.9 % | ||||||
Cardiac Rhythm & Heart Failure | 1,535 | 1,446 | 6.2 | (19) | 1,555 | 1,446 | 7.5 | ||||||
Structural Heart & Aortic | 856 | 814 | 5.1 | (12) | 868 | 814 | 6.6 | ||||||
Coronary & Peripheral Vascular | 616 | 589 | 4.5 | (8) | 624 | 589 | 5.8 | ||||||
Neuroscience | 2,317 | 2,219 | 4.4 | (18) | 2,336 | 2,219 | 5.3 | ||||||
Cranial & Spinal Technologies | 1,147 | 1,103 | 4.0 | (9) | 1,156 | 1,103 | 4.8 | ||||||
Specialty Therapies | 713 | 695 | 2.5 | (7) | 719 | 695 | 3.4 | ||||||
Neuromodulation | 457 | 420 | 8.9 | (3) | 460 | 420 | 9.6 | ||||||
Medical Surgical | 1,996 | 2,005 | (0.4) | (29) | 2,024 | 2,005 | 1.0 | ||||||
Surgical & Endoscopy | 1,544 | 1,546 | (0.1) | (22) | 1,566 | 1,546 | 1.3 | ||||||
Acute Care & Monitoring | 452 | 459 | (1.5) | (6) | 458 | 459 | (0.1) | ||||||
Diabetes | 647 | 578 | 11.8 | (4) | 651 | 578 | 12.6 | ||||||
Total Reportable Segments | 7,967 | 7,652 | 4.1 | (90) | 8,057 | 7,652 | 5.3 | ||||||
Other(2) | (52) | 50 | (203.7) | (2) | — | — | — | ||||||
TOTAL | $ 7,915 | $ 7,702 | 2.8 % | $ (93) | $ 8,057 | $ 7,652 | 5.3 % | ||||||
(1) | The data in this schedule has been intentionally rounded to the nearest million and, therefore, may not sum. Percentages have been calculated using actual, non-rounded figures and, therefore, may not recalculate precisely. |
(2) | Includes historical operations and ongoing transition agreements from businesses the Company has exited or divested, and specifically for the first quarter of fiscal year 2025, incremental Italian payback accruals resulting from the two July 22, 2024 rulings by the Constitutional Court of |
(3) | The currency impact to revenue measures the change in revenue between current and prior year periods using constant exchange rates. |
(4) | The three months ended July 26, 2024 excludes |
MEDTRONIC PLC (Unaudited) | |||||||||||
FIRST QUARTER | |||||||||||
REPORTED | ORGANIC | ||||||||||
(in millions) | FY25 | FY24 | Growth | Adjusted | Adjusted | Growth | |||||
Cardiovascular | $ 1,403 | $ 1,350 | 3.9 % | $ 1,403 | $ 1,350 | 3.9 % | |||||
Cardiac Rhythm & Heart Failure | 766 | 720 | 6.4 | 766 | 720 | 6.4 | |||||
Structural Heart & Aortic | 368 | 357 | 3.3 | 368 | 357 | 3.3 | |||||
Coronary & Peripheral Vascular | 268 | 273 | (1.6) | 268 | 273 | (1.6) | |||||
Neuroscience | 1,565 | 1,497 | 4.5 | 1,565 | 1,497 | 4.5 | |||||
Cranial & Spinal Technologies | 855 | 821 | 4.2 | 855 | 821 | 4.2 | |||||
Specialty Therapies | 398 | 392 | 1.5 | 398 | 392 | 1.5 | |||||
Neuromodulation | 312 | 284 | 9.8 | 312 | 284 | 9.8 | |||||
Medical Surgical | 881 | 867 | 1.6 | 881 | 867 | 1.6 | |||||
Surgical & Endoscopy | 630 | 619 | 1.6 | 630 | 619 | 1.6 | |||||
Acute Care & Monitoring | 251 | 248 | 1.4 | 251 | 248 | 1.4 | |||||
Diabetes | 215 | 188 | 14.3 | 215 | 188 | 14.3 | |||||
Total Reportable Segments | 4,064 | 3,903 | 4.1 | 4,064 | 3,903 | 4.1 | |||||
Other(3) | 18 | 22 | (15.6) | — | — | — | |||||
TOTAL | $ 4,082 | $ 3,924 | 4.0 % | $ 4,064 | $ 3,903 | 4.1 % | |||||
(1) | |
(2) | The data in this schedule has been intentionally rounded to the nearest million and, therefore, may not sum. Percentages have been calculated using actual, non-rounded figures and, therefore, may not recalculate precisely. |
(3) | Includes historical operations and ongoing transition agreements from businesses the Company has exited or divested. |
MEDTRONIC PLC INTERNATIONAL REVENUE(1) (Unaudited) | |||||||||||||
FIRST QUARTER | |||||||||||||
REPORTED | ORGANIC | ||||||||||||
(in millions) | FY25 | FY24 | Growth | Currency | Adjusted | Adjusted | Growth | ||||||
Cardiovascular | $ 1,604 | $ 1,500 | 6.9 % | $ (39) | $ 1,643 | $ 1,500 | 9.5 % | ||||||
Cardiac Rhythm & Heart Failure | 769 | 726 | 5.9 | (19) | 789 | 726 | 8.6 | ||||||
Structural Heart & Aortic | 487 | 457 | 6.5 | (12) | 499 | 457 | 9.2 | ||||||
Coronary & Peripheral Vascular | 347 | 317 | 9.7 | (8) | 355 | 317 | 12.2 | ||||||
Neuroscience | 752 | 721 | 4.3 | (18) | 770 | 721 | 6.8 | ||||||
Cranial & Spinal Technologies | 292 | 282 | 3.4 | (9) | 301 | 282 | 6.6 | ||||||
Specialty Therapies | 314 | 303 | 3.8 | (7) | 321 | 303 | 5.9 | ||||||
Neuromodulation | 146 | 136 | 7.2 | (3) | 149 | 136 | 9.4 | ||||||
Medical Surgical | 1,115 | 1,137 | (2.0) | (29) | 1,143 | 1,137 | 0.5 | ||||||
Surgical & Endoscopy | 915 | 926 | (1.3) | (22) | 937 | 926 | 1.1 | ||||||
Acute Care & Monitoring | 200 | 211 | (5.0) | (6) | 207 | 211 | (2.0) | ||||||
Diabetes | 432 | 390 | 10.7 | (4) | 436 | 390 | 11.7 | ||||||
Total Reportable Segments | 3,903 | 3,749 | 4.1 | (90) | 3,993 | 3,749 | 6.5 | ||||||
Other(2) | (70) | 28 | (347.5) | (2) | — | — | — | ||||||
TOTAL | $ 3,832 | $ 3,777 | 1.5 % | $ (93) | $ 3,993 | $ 3,749 | 6.5 % | ||||||
(1) | The data in this schedule has been intentionally rounded to the nearest million and, therefore, may not sum. Percentages have been calculated using actual, non-rounded figures and, therefore, may not recalculate precisely. |
(2) | Includes historical operations and ongoing transition agreements from businesses the Company has exited or divested, and specifically for the first quarter of fiscal year 2025, incremental Italian payback accruals resulting from the two July 22, 2024 rulings by the Constitutional Court of |
(3) | The currency impact to revenue measures the change in revenue between current and prior year periods using constant exchange rates. |
(4) | The three months ended July 26, 2024 excludes |
MEDTRONIC PLC CONSOLIDATED STATEMENTS OF INCOME (Unaudited) | |||
Three months ended | |||
(in millions, except per share data) | July 26, 2024 | July 28, 2023 | |
Net sales | $ 7,915 | $ 7,702 | |
Costs and expenses: | |||
Cost of products sold, excluding amortization of intangible assets | 2,761 | 2,628 | |
Research and development expense | 676 | 668 | |
Selling, general, and administrative expense | 2,655 | 2,613 | |
Amortization of intangible assets | 414 | 429 | |
Restructuring charges, net | 47 | 54 | |
Certain litigation charges, net | 81 | 40 | |
Other operating expense, net | 1 | 1 | |
Operating profit | 1,278 | 1,268 | |
Other non-operating income, net | (157) | (76) | |
Interest expense, net | 167 | 148 | |
Income before income taxes | 1,268 | 1,196 | |
Income tax provision | 220 | 400 | |
Net income | 1,049 | 797 | |
Net income attributable to noncontrolling interests | (6) | (6) | |
Net income attributable to Medtronic | $ 1,042 | $ 791 | |
Basic earnings per share | $ 0.81 | $ 0.59 | |
Diluted earnings per share | $ 0.80 | $ 0.59 | |
Basic weighted average shares outstanding | 1,293.3 | 1,330.5 | |
Diluted weighted average shares outstanding | 1,296.5 | 1,333.8 | |
The data in the schedule above has been intentionally rounded to the nearest million. |
MEDTRONIC PLC GAAP TO NON-GAAP RECONCILIATIONS(1) (Unaudited) | |||||||||||||||||
Three months ended July 26, 2024 | |||||||||||||||||
(in millions, except per share data) | Net Sales | Cost of | Gross | Operating | Operating | Income | Net Income | Diluted EPS | Effective | ||||||||
GAAP | $ 7,915 | $ 2,761 | 65.1 % | $ 1,278 | 16.1 % | $ 1,268 | $ 1,042 | $ 0.80 | 17.4 % | ||||||||
Non-GAAP Adjustments: | |||||||||||||||||
Amortization of intangible assets | — | — | — | 414 | 5.1 | 414 | 340 | 0.26 | 18.1 | ||||||||
Restructuring and associated costs(2) | — | (9) | 0.1 | 62 | 0.8 | 62 | 51 | 0.04 | 19.4 | ||||||||
Acquisition and divestiture-related items(3) | — | (10) | 0.1 | 12 | 0.1 | 12 | 11 | 0.01 | 8.3 | ||||||||
Certain litigation charges, net | — | — | — | 81 | 1.0 | 81 | 68 | 0.05 | 16.0 | ||||||||
(Gain)/loss on minority investments(4) | — | — | — | — | — | (17) | (17) | (0.01) | — | ||||||||
Medical device regulations(5) | — | (11) | 0.1 | 14 | 0.2 | 14 | 11 | 0.01 | 21.4 | ||||||||
Other(6) | 90 | — | 0.6 | 90 | 1.1 | 90 | 70 | 0.05 | 22.2 | ||||||||
Certain tax adjustments, net | — | — | — | — | — | — | 17 | 0.01 | — | ||||||||
Non-GAAP | $ 8,004 | $ 2,730 | 65.9 % | $ 1,953 | 24.4 % | $ 1,925 | $ 1,592 | $ 1.23 | 17.0 % | ||||||||
Currency impact | 91 | (31) | 0.8 | 100 | 1.0 | 0.06 | |||||||||||
Currency Adjusted | $ 8,095 | $ 2,699 | 66.7 % | $ 2,053 | 25.4 % | $ 1.29 | |||||||||||
Three months ended July 28, 2023 | |||||||||||||||||
(in millions, except per share data) | Net Sales | Cost of | Gross | Operating | Operating | Income | Net Income | Diluted EPS | Effective | ||||||||
GAAP | $ 7,702 | $ 2,628 | 65.9 % | $ 1,268 | 16.5 % | $ 1,196 | $ 791 | $ 0.59 | 33.4 % | ||||||||
Non-GAAP Adjustments: | |||||||||||||||||
Amortization of intangible assets | — | — | — | 429 | 5.6 | 429 | 364 | 0.27 | 15.2 | ||||||||
Restructuring and associated costs(2) | — | (16) | 0.2 | 91 | 1.2 | 91 | 76 | 0.06 | 16.5 | ||||||||
Acquisition and divestiture-related items(3) | — | (6) | 0.1 | 50 | 0.6 | 50 | 46 | 0.03 | 6.0 | ||||||||
Certain litigation charges, net | — | — | — | 40 | 0.5 | 40 | 31 | 0.02 | 22.5 | ||||||||
(Gain)/loss on minority investments(4) | — | — | — | — | — | 64 | 64 | 0.05 | — | ||||||||
Medical device regulations(5) | — | (21) | 0.3 | 31 | 0.4 | 31 | 25 | 0.02 | 22.6 | ||||||||
Certain tax adjustments, net(7) | — | — | — | — | — | — | 198 | 0.15 | — | ||||||||
Non-GAAP | $ 7,702 | $ 2,586 | 66.4 % | $ 1,909 | 24.8 % | $ 1,902 | $ 1,596 | $ 1.20 | 15.8 % | ||||||||
See description of non-GAAP financial measures contained in the press release dated August 20, 2024. | |
(1) | The data in this schedule has been intentionally rounded to the nearest million or |
(2) | Associated and other costs primarily include salaries and wages for employees supporting the restructuring activities, consulting expenses, and asset write-offs. |
(3) | The charges primarily include business combination costs, changes in fair value of contingent consideration, and exit of business related charges. |
(4) | We exclude unrealized and realized gains and losses on our minority investments as we do not believe that these components of income or expense have a direct correlation to our ongoing or future business operations. |
(5) | The charges represent incremental costs of complying with the new European Union (E.U.) medical device regulations for previously registered products and primarily include charges for contractors supporting the project and other direct third-party expenses. We consider these costs to be duplicative of previously incurred costs and/or one-time costs, which are limited to a specific time period. |
(6) | Reflects the recognition of incremental Italian payback accruals resulting from the two July 22, 2024 rulings by the Constitutional Court of |
(7) | The charge relates to an income tax reserve adjustment associated with the June 2023 Israeli Central-Lod District Court decision in Medtronic Ventor Technologies Ltd v. Kfar Saba Assessing Office and amortization of previously established deferred tax assets from intercompany intellectual property transactions. |
MEDTRONIC PLC GAAP TO NON-GAAP RECONCILIATIONS(1) (Unaudited) | |||||||||||||||
Three months ended July 26, 2024 | |||||||||||||||
(in millions) | Net Sales | SG&A | SG&A Expense | R&D | R&D Expense | Other Operating | Other Operating | Other | |||||||
GAAP | $ 7,915 | $ 2,655 | 33.5 % | $ 676 | 8.5 % | $ 1 | — % | $ (157) | |||||||
Non-GAAP Adjustments: | |||||||||||||||
Restructuring and associated costs(2) | — | (5) | (0.2) | — | — | — | — | — | |||||||
Acquisition and divestiture-related items(3) | — | (7) | (0.3) | — | — | 6 | 0.1 | — | |||||||
Medical device regulations(4) | — | — | — | (3) | — | — | — | — | |||||||
Other(5) | 90 | — | — | — | — | — | — | — | |||||||
(Gain)/loss on minority investments(6) | — | — | — | — | — | — | — | 17 | |||||||
Non-GAAP | $ 8,004 | $ 2,642 | 33.0 % | $ 673 | 8.4 % | $ 7 | 0.1 % | $ (140) | |||||||
See description of non-GAAP financial measures contained in the press release dated August 20, 2024. | |
(1) | The data in this schedule has been intentionally rounded to the nearest million, and, therefore, may not sum. |
(2) | Associated and other costs primarily include salaries and wages for employees supporting the restructuring activities, consulting expenses, and asset write-offs. |
(3) | The charges primarily include business combination costs, changes in fair value of contingent consideration, and exit of business related charges. |
(4) | The charges represent incremental costs of complying with the new European Union medical device regulations for previously registered products and primarily include charges for contractors supporting the project and other direct third-party expenses. We consider these costs to be duplicative of previously incurred costs and/or one-time costs, which are limited to a specific time period. |
(5) | Reflects the recognition of incremental Italian payback accruals resulting from the two July 22, 2024 rulings by the Constitutional Court of |
(6) | We exclude unrealized and realized gains and losses on our minority investments as we do not believe that these components of income or expense have a direct correlation to our ongoing or future business operations. |
MEDTRONIC PLC GAAP TO NON-GAAP RECONCILIATIONS(1) (Unaudited) | |||
Three months ended | |||
(in millions) | July 26, 2024 | July 28, 2023 | |
Net cash provided by operating activities | $ 986 | $ 875 | |
Additions to property, plant, and equipment | (520) | (354) | |
Free Cash Flow(2) | $ 466 | $ 521 | |
See description of non-GAAP financial measures contained in the press release dated August 20, 2024. | |
(1) | The data in this schedule has been intentionally rounded to the nearest million, and, therefore, may not sum. |
(2) | Free cash flow represents operating cash flows less property, plant, and equipment additions. |
MEDTRONIC PLC CONSOLIDATED BALANCE SHEETS (Unaudited) | ||||
(in millions) | July 26, 2024 | April 26, 2024 | ||
ASSETS | ||||
Current assets: | ||||
Cash and cash equivalents | $ 1,311 | $ 1,284 | ||
Investments | 6,532 | 6,721 | ||
Accounts receivable, less allowances and credit losses of | 6,011 | 6,128 | ||
Inventories | 5,414 | 5,217 | ||
Other current assets | 2,679 | 2,584 | ||
Total current assets | 21,947 | 21,935 | ||
Property, plant, and equipment, net | 6,282 | 6,131 | ||
Goodwill | 41,084 | 40,986 | ||
Other intangible assets, net | 12,819 | 13,225 | ||
Tax assets | 3,554 | 3,657 | ||
Other assets | 4,062 | 4,047 | ||
Total assets | $ 89,749 | $ 89,981 | ||
LIABILITIES AND EQUITY | ||||
Current liabilities: | ||||
Current debt obligations | $ 1,553 | $ 1,092 | ||
Accounts payable | 2,291 | 2,410 | ||
Accrued compensation | 1,776 | 2,375 | ||
Accrued income taxes | 1,063 | 1,330 | ||
Other accrued expenses | 3,604 | 3,582 | ||
Total current liabilities | 10,287 | 10,789 | ||
Long-term debt | 26,312 | 23,932 | ||
Accrued compensation and retirement benefits | 1,107 | 1,101 | ||
Accrued income taxes | 1,917 | 1,859 | ||
Deferred tax liabilities | 496 | 515 | ||
Other liabilities | 1,470 | 1,365 | ||
Total liabilities | 41,589 | 39,561 | ||
Commitments and contingencies | ||||
Shareholders' equity: | ||||
Ordinary shares— par value | — | — | ||
Additional paid-in capital | 20,810 | 23,129 | ||
Retained earnings | 30,547 | 30,403 | ||
Accumulated other comprehensive loss | (3,410) | (3,318) | ||
Total shareholders' equity | 47,947 | 50,214 | ||
Noncontrolling interests | 213 | 206 | ||
Total equity | 48,160 | 50,420 | ||
Total liabilities and equity | $ 89,749 | $ 89,981 | ||
The data in this schedule has been intentionally rounded to the nearest million, and, therefore, may not sum. |
MEDTRONIC PLC CONSOLIDATED STATEMENTS OF CASH FLOWS (Unaudited) | |||
Three months ended | |||
(in millions) | July 26, 2024 | July 28, 2023 | |
Operating Activities: | |||
Net income | $ 1,049 | $ 797 | |
Adjustments to reconcile net income to net cash provided by operating activities: | |||
Depreciation and amortization | 662 | 672 | |
Provision for credit losses | 18 | 21 | |
Deferred income taxes | 88 | — | |
Stock-based compensation | 83 | 73 | |
Other, net | (9) | 135 | |
Change in operating assets and liabilities, net of acquisitions and divestitures: | |||
Accounts receivable, net | 110 | 164 | |
Inventories | (217) | (410) | |
Accounts payable and accrued liabilities | (604) | (673) | |
Other operating assets and liabilities | (194) | 96 | |
Net cash provided by operating activities | 986 | 875 | |
Investing Activities: | |||
Additions to property, plant, and equipment | (520) | (354) | |
Purchases of investments | (1,879) | (1,916) | |
Sales and maturities of investments | 2,157 | 1,748 | |
Other investing activities, net | (17) | (17) | |
Net cash used in investing activities | (259) | (539) | |
Financing Activities: | |||
Change in current debt obligations, net | (624) | 500 | |
Issuance of long-term debt | 3,209 | — | |
Dividends to shareholders | (898) | (918) | |
Issuance of ordinary shares | 89 | 77 | |
Repurchase of ordinary shares | (2,492) | (152) | |
Other financing activities | (15) | (8) | |
Net cash used in financing activities | (731) | (501) | |
Effect of exchange rate changes on cash and cash equivalents | 31 | (39) | |
Net change in cash and cash equivalents | 27 | (204) | |
Cash and cash equivalents at beginning of period | 1,284 | 1,543 | |
Cash and cash equivalents at end of period | $ 1,311 | $ 1,339 | |
Supplemental Cash Flow Information | |||
Cash paid for: | |||
Income taxes | $ 394 | $ 117 | |
Interest | 119 | 84 | |
The data in this schedule has been intentionally rounded to the nearest million, and, therefore, may not sum. |
About Medtronic
Bold thinking. Bolder actions. We are Medtronic. Medtronic plc, headquartered in Galway,
FORWARD LOOKING STATEMENTS
This press release contains forward-looking statements within the meaning of the Private Securities Litigation Reform Act of 1995, which are subject to risks and uncertainties, including risks related to competitive factors, difficulties and delays inherent in the development, manufacturing, marketing and sale of medical products, government regulation, geopolitical conflicts, general economic conditions, and other risks and uncertainties described in the company's periodic reports on file with the
NON-GAAP FINANCIAL MEASURES
This press release contains financial measures, including adjusted net income, adjusted diluted EPS, and organic revenue, which are considered "non-GAAP" financial measures under applicable SEC rules and regulations. References to quarterly or annual figures increasing, decreasing or remaining flat are in comparison to fiscal year 2024.
Medtronic management believes that non-GAAP financial measures provide information useful to investors in understanding the company's underlying operational performance and trends and to facilitate comparisons with the performance of other companies in the med tech industry. Non-GAAP net income and diluted EPS exclude the effect of certain charges or gains that contribute to or reduce earnings but that result from transactions or events that management believes may or may not recur with similar materiality or impact to operations in future periods (Non-GAAP Adjustments). Medtronic generally uses non-GAAP financial measures to facilitate management's review of the operational performance of the company and as a basis for strategic planning. Non-GAAP financial measures should be considered supplemental to and not a substitute for financial information prepared in accordance with
Medtronic calculates forward-looking non-GAAP financial measures based on internal forecasts that omit certain amounts that would be included in GAAP financial measures. For instance, forward-looking organic revenue growth guidance excludes the impact of foreign currency fluctuations, as well as significant acquisitions or divestitures. Forward-looking diluted non-GAAP EPS guidance also excludes other potential charges or gains that would be recorded as Non-GAAP Adjustments to earnings during the fiscal year. Medtronic does not attempt to provide reconciliations of forward-looking non-GAAP EPS guidance to projected GAAP EPS guidance because the combined impact and timing of recognition of these potential charges or gains is inherently uncertain and difficult to predict and is unavailable without unreasonable efforts. In addition, the company believes such reconciliations would imply a degree of precision and certainty that could be confusing to investors. Such items could have a substantial impact on GAAP measures of financial performance.
Contacts: | |
Erika Winkels | Ryan Weispfenning |
Public Relations | Investor Relations |
+1-763-526-8478 | +1-763-505-4626 |
![]()
![]() View original content to download multimedia:https://www.prnewswire.com/news-releases/medtronic-reports-first-quarter-fiscal-2025-financial-results-302225856.html
View original content to download multimedia:https://www.prnewswire.com/news-releases/medtronic-reports-first-quarter-fiscal-2025-financial-results-302225856.html
SOURCE Medtronic plc