Hecla Reports Third Quarter 2022 Results
Hecla Mining Company (NYSE:HL) announced third quarter 2022 results, revealing a net loss of $23.7 million, or $0.04 per share, despite record throughput at Greens Creek and consistent silver production at Lucky Friday. Silver production guidance increased, while operating and capital costs remained stable. Key highlights include adjusted EBITDA of $26.6 million and positive cash flow from all operations year-to-date. Significant deferred sales, primarily from silver concentrate shipments, are expected to impact fourth quarter revenues. The company maintains strong liquidity with $144.7 million in cash.
- Record throughput at Greens Creek and 1 million silver ounces produced at Lucky Friday for two consecutive quarters.
- Consolidated silver production guidance increased.
- All operations reported positive free cash flow year-to-date.
- Strong liquidity with $144.7 million in cash and approximately $260 million available.
- Net loss of $23.7 million, a significant decline in gross profit from $37.3 million in Q2 2022.
- Deferred approximately $24 million in sales, impacting fourth quarter revenues.
- Cash flow from operations declined to negative $24.3 million, compared to positive cash flow of $40.2 million in the prior quarter.
- Cash costs and AISC per silver ounce increased due to lower by-product credits.
Insights
Analyzing...
Positive free cash flow generation from all operations for the first nine months
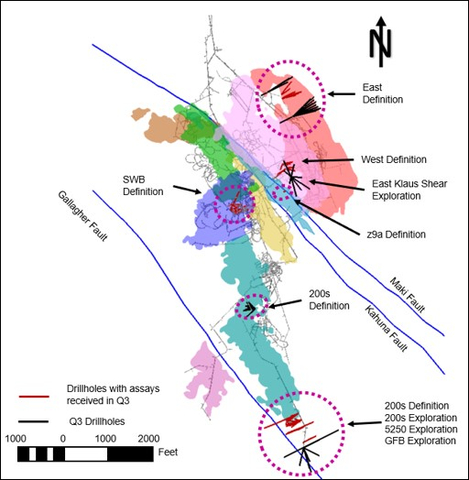
Figure 1: Plan view showing drilling locations and areas where assays have been received in relation to the multiple ore zones at
THIRD QUARTER HIGHLIGHTS
-
Record throughput at
Greens Creek ;Lucky Friday produced 1 million silver ounces for two consecutive quarters - Consolidated silver production guidance increased, operating and capital cost guidance maintained
-
Deferred approximately
$24 million Greens Creek andLucky Friday to the fourth quarter -
Keno Hill has completed30% of total planned pre-production development as ofOctober 31, 2022 -
Net loss applicable to common stockholders of
$(23.7) million $(0.04) $(12.0) million $(0.02) -
Adjusted EBITDA of
$26.6 million -
All operations free cash flow positive year to date with total cost of sales for silver of
$246.4 million $10.17 -
$144.7 million $260 million -
Positive drilling results at Keno Hill and
Greens Creek with intercepts in excess of 100 ounces of silver per ton at Keno Hill and wide high-grade intercepts atGreens Creek -
Strong safety performance with an all-injury frequency rate of 1.32 for the first nine months,
37% below theU.S. average and an improvement of19% over the nine-month period in 2021
“Hecla reported another quarter of solid operational performance as
Baker continued, “Hecla is the United States’ largest silver miner, producing about
FINANCIAL OVERVIEW
"Total cost of sales" as used in this release is comprised of cost of sales and other direct production costs and depreciation, depletion and amortization.
In Thousands unless stated otherwise |
Q3-2022 |
Q2-2022 |
Q1-2022 |
Q4-2021 |
Q3-2021 |
YTD-2022 |
YTD-2021 |
|||||||||||||||||||||
FINANCIAL AND OPERATIONAL HIGHLIGHTS |
||||||||||||||||||||||||||||
Sales |
$ |
146,339 |
|
$ |
191,242 |
|
$ |
186,499 |
|
$ |
185,078 |
|
$ |
193,560 |
|
$ |
524,080 |
|
$ |
622,395 |
|
|||||||
Total cost of sales |
$ |
137,892 |
|
$ |
153,979 |
|
$ |
141,070 |
|
$ |
131,837 |
|
$ |
158,332 |
|
$ |
432,941 |
|
$ |
457,835 |
|
|||||||
Gross profit |
$ |
8,447 |
|
$ |
37,263 |
|
$ |
45,429 |
|
$ |
53,241 |
|
$ |
35,228 |
|
$ |
91,139 |
|
$ |
164,560 |
|
|||||||
(Loss) income applicable to common stockholders |
$ |
(23,664 |
) |
$ |
(13,661 |
) |
$ |
4,015 |
|
$ |
11,737 |
|
$ |
(1,117 |
) |
$ |
(33,310 |
) |
$ |
22,806 |
|
|||||||
Basic (loss) income per common share (in dollars) |
$ |
(0.04 |
) |
$ |
(0.03 |
) |
$ |
0.01 |
|
$ |
0.02 |
|
$ |
— |
|
$ |
(0.06 |
) |
$ |
0.04 |
|
|||||||
Adjusted EBITDA 2 |
$ |
26,554 |
|
$ |
70,474 |
|
$ |
58,202 |
|
$ |
58,249 |
|
$ |
49,414 |
|
$ |
155,230 |
|
$ |
220,531 |
|
|||||||
Net Debt to Adjusted EBITDA2,* |
|
1.9 |
|
|
|
|
|
|
|
1.1 |
|
|||||||||||||||||
Cash (used in) provided by operating activities |
$ |
(24,322 |
) |
$ |
40,183 |
|
$ |
37,909 |
|
$ |
53,355 |
|
$ |
42,742 |
|
$ |
53,770 |
|
$ |
166,982 |
|
|||||||
Capital Expenditures |
$ |
(37,430 |
) |
$ |
(34,329 |
) |
$ |
(21,478 |
) |
$ |
(28,838 |
) |
$ |
(26,899 |
) |
$ |
(93,237 |
) |
$ |
(80,210 |
) |
|||||||
Free Cash Flow 3 |
$ |
(61,752 |
) |
$ |
5,854 |
|
$ |
16,431 |
|
$ |
24,517 |
|
$ |
15,843 |
|
$ |
(39,467 |
) |
$ |
86,772 |
|
|||||||
Production Highlights |
||||||||||||||||||||||||||||
Silver ounces produced |
|
3,549,392 |
|
|
3,645,454 |
|
|
3,324,708 |
|
|
3,226,927 |
|
|
2,676,084 |
|
|
10,525,917 |
|
|
9,660,313 |
|
|||||||
Silver payable ounces sold |
|
2,479,724 |
|
|
3,387,909 |
|
|
2,687,261 |
|
|
2,606,622 |
|
|
2,581,690 |
|
|
8,554,894 |
|
|
9,027,180 |
|
|||||||
Gold ounces produced |
|
44,747 |
|
|
45,719 |
|
|
41,707 |
|
|
47,977 |
|
|
42,207 |
|
|
132,173 |
|
|
153,350 |
|
|||||||
Gold payable ounces sold |
|
40,443 |
|
|
44,225 |
|
|
41,053 |
|
|
44,156 |
|
|
53,000 |
|
|
125,721 |
|
|
157,454 |
|
|||||||
Cash Costs and AISC, each after by-product credits4,5 |
||||||||||||||||||||||||||||
Silver cash costs per ounce |
$ |
3.43 |
|
$ |
(1.14 |
) |
$ |
1.09 |
|
$ |
1.69 |
|
$ |
2.49 |
|
$ |
1.11 |
|
$ |
1.26 |
|
|||||||
Silver AISC per ounce |
$ |
14.20 |
|
$ |
8.55 |
|
$ |
7.64 |
|
$ |
10.08 |
|
$ |
12.82 |
|
$ |
10.17 |
|
$ |
8.88 |
|
|||||||
Gold cash costs per ounce |
$ |
1,349 |
|
$ |
1,371 |
|
$ |
1,516 |
|
$ |
1,143 |
|
$ |
1,163 |
|
$ |
1,409 |
|
$ |
1,127 |
|
|||||||
Gold AISC per ounce |
$ |
1,738 |
|
$ |
1,641 |
|
$ |
1,810 |
|
$ |
1,494 |
|
$ |
1,450 |
|
$ |
1,729 |
|
$ |
1,349 |
|
|||||||
Realized Prices |
||||||||||||||||||||||||||||
Silver, $/ounce |
$ |
18.30 |
|
$ |
20.68 |
|
$ |
24.68 |
|
$ |
23.49 |
|
$ |
23.97 |
|
$ |
21.25 |
|
$ |
25.75 |
|
|||||||
Gold, $/ounce |
$ |
1,713 |
|
$ |
1,855 |
|
$ |
1,880 |
|
$ |
1,802 |
|
$ |
1,792 |
|
$ |
1,817 |
|
$ |
1,794 |
|
|||||||
Lead, $/pound |
$ |
0.95 |
|
$ |
0.97 |
|
$ |
1.08 |
|
$ |
1.13 |
|
$ |
1.02 |
|
$ |
0.98 |
|
$ |
1.00 |
|
|||||||
Zinc, $/pound |
$ |
1.23 |
|
$ |
1.44 |
|
$ |
1.79 |
|
$ |
1.74 |
|
$ |
1.35 |
|
$ |
1.47 |
|
$ |
1.34 |
|
|||||||
*Reflects trailing twelve months ending |
||||||||||||||||||||||||||||
Sales in the third quarter declined by
Total cost of sales for silver were
Total cost of sales for gold were
Labor and the current inflationary environment are challenging at all operations. Labor availability remains constrained in the market with a shortage of skilled miners and maintenance workers. Inflationary pressures have led to a 10
In the first half of the year, by-product credits helped offset the inflationary pressures for the silver segment due to strong by-product production as well as prices. However, lower base metal production and prices in the third quarter reduced the by-product credits. The inflationary environment is expected to remain challenging for the fourth quarter and into 2023.
Loss applicable to common stockholders for the third quarter was
-
Gross profit decreased by
$28.8 million -
Exploration and pre-development expenses increased by
$3.9 million -
General and administrative expenses increased by
$1.3 million
Partially offset by:
-
A net foreign exchange gain of
$5.7 million $4.5 million U.S. dollar (“USD”) against the Canadian dollar (“CAD”) during the current quarter -
Lower unrealized losses on our investment portfolio of
$10.6 million -
An income tax benefit of
$9.5 million $0.3 million
Cash used in operating activities was
Capital expenditures totaled
Forward Sales Contracts for Base Metals and Foreign Currency
The Company uses financially settled forward sales contracts to manage exposures to changes in prices of zinc and lead. At
The Company also manages CAD exposure through forward contracts. At
| OPERATIONS OVERVIEW | ||||||||||||||||||||||||||||
Dollars are in thousands except cost per ton |
Q3-2022 |
Q2-2022 |
Q1-2022 |
Q4-2021 |
Q3-2021 |
YTD-2022 |
YTD-2021 |
|||||||||||||||||||||
GREENS CREEK |
||||||||||||||||||||||||||||
Tons of ore processed |
|
229,975 |
|
|
209,558 |
|
|
211,687 |
|
|
221,814 |
|
|
211,142 |
|
|
651,220 |
|
|
620,153 |
|
|||||||
Total production cost per ton |
$ |
185.34 |
|
$ |
197.84 |
|
$ |
192.16 |
|
$ |
174.55 |
|
$ |
181.60 |
|
$ |
191.58 |
|
$ |
178.29 |
|
|||||||
Ore grade milled - Silver (oz./ton) |
|
13.6 |
|
|
14.0 |
|
|
13.8 |
|
|
12.6 |
|
|
11.1 |
|
|
13.8 |
|
|
13.8 |
|
|||||||
Ore grade milled - Gold (oz./ton) |
|
0.07 |
|
|
0.08 |
|
|
0.07 |
|
|
0.07 |
|
|
0.07 |
|
|
0.07 |
|
|
0.08 |
|
|||||||
Ore grade milled - Lead (%) |
|
2.4 |
|
|
3.0 |
|
|
2.8 |
|
|
2.6 |
|
|
2.7 |
|
|
2.7 |
|
|
3.0 |
|
|||||||
Ore grade milled - Zinc (%) |
|
6.3 |
|
|
7.2 |
|
|
6.6 |
|
|
6.3 |
|
|
7.1 |
|
|
6.7 |
|
|
7.4 |
|
|||||||
Silver produced (oz.) |
|
2,468,280 |
|
|
2,410,598 |
|
|
2,429,782 |
|
|
2,262,635 |
|
|
1,837,270 |
|
|
7,308,660 |
|
|
6,980,587 |
|
|||||||
Gold produced (oz.) |
|
11,412 |
|
|
12,413 |
|
|
11,402 |
|
|
10,229 |
|
|
9,734 |
|
|
35,227 |
|
|
35,859 |
|
|||||||
Lead produced (tons) |
|
4,428 |
|
|
5,184 |
|
|
4,883 |
|
|
4,731 |
|
|
4,591 |
|
|
14,495 |
|
|
15,142 |
|
|||||||
Zinc produced (tons) |
|
12,580 |
|
|
13,396 |
|
|
12,494 |
|
|
12,457 |
|
|
13,227 |
|
|
38,470 |
|
|
41,191 |
|
|||||||
Sales |
$ |
60,875 |
|
$ |
92,723 |
|
$ |
86,090 |
|
$ |
87,865 |
|
$ |
84,806 |
|
$ |
239,688 |
|
$ |
296,978 |
|
|||||||
Total cost of sales |
$ |
(52,502 |
) |
$ |
(60,506 |
) |
$ |
(49,636 |
) |
$ |
(49,251 |
) |
$ |
(55,193 |
) |
$ |
(162,644 |
) |
$ |
(163,861 |
) |
|||||||
Gross profit |
$ |
8,373 |
|
$ |
32,217 |
|
$ |
36,453 |
|
$ |
38,614 |
|
$ |
29,613 |
|
$ |
77,044 |
|
$ |
133,117 |
|
|||||||
Cash flow from operations |
$ |
7,749 |
|
$ |
41,808 |
|
$ |
56,295 |
|
$ |
50,632 |
|
$ |
40,626 |
|
$ |
105,852 |
|
$ |
157,387 |
|
|||||||
Exploration |
$ |
3,776 |
|
$ |
929 |
|
$ |
165 |
|
$ |
696 |
|
$ |
2,472 |
|
$ |
4,870 |
|
$ |
3,895 |
|
|||||||
Capital additions |
$ |
(6,988 |
) |
$ |
(14,668 |
) |
$ |
(3,092 |
) |
$ |
(9,544 |
) |
$ |
(6,228 |
) |
$ |
(24,748 |
) |
$ |
(14,339 |
) |
|||||||
Free cash flow 3 |
$ |
4,537 |
|
$ |
28,069 |
|
$ |
53,368 |
|
$ |
41,784 |
|
$ |
36,870 |
|
$ |
85,974 |
|
$ |
146,943 |
|
|||||||
Cash cost per ounce, after by-product credits4 |
$ |
2.65 |
|
$ |
(3.29 |
) |
$ |
(0.90 |
) |
$ |
0.50 |
|
$ |
0.74 |
|
$ |
(0.49 |
) |
$ |
(1.03 |
) |
|||||||
AISC per ounce, after by-product credits5 |
$ |
8.61 |
|
$ |
3.48 |
|
$ |
1.90 |
|
$ |
5.66 |
|
$ |
5.94 |
|
$ |
4.69 |
|
$ |
2.40 |
|
|||||||
Cash cost per silver ounce increased by
Cash flow from operations for the quarter was
|
||||||||||||||||||||||||||||
Dollars are in thousands except cost per ton |
Q3-2022 |
Q2-2022 |
Q1-2022 |
Q4-2021 |
Q3-2021 |
YTD-2022 |
YTD-2021 |
|||||||||||||||||||||
|
||||||||||||||||||||||||||||
Tons of ore processed |
|
90,749 |
|
|
97,497 |
|
|
77,725 |
|
|
80,097 |
|
|
78,227 |
|
|
265,971 |
|
|
241,740 |
|
|||||||
Total production cost per ton |
$ |
207.10 |
|
$ |
211.45 |
|
$ |
247.17 |
|
$ |
198.83 |
|
$ |
190.66 |
|
$ |
220.41 |
|
$ |
189.06 |
|
|||||||
Ore grade milled - Silver (oz./ton) |
|
12.5 |
|
|
13.2 |
|
|
12.0 |
|
|
12.5 |
|
|
11.2 |
|
|
12.7 |
|
|
11.3 |
|
|||||||
Ore grade milled - Lead (%) |
|
8.5 |
|
|
8.8 |
|
|
8.2 |
|
|
8.1 |
|
|
7.2 |
|
|
8.5 |
|
|
7.4 |
|
|||||||
Ore grade milled - Zinc (%) |
|
4.2 |
|
|
3.9 |
|
|
3.6 |
|
|
3.3 |
|
|
3.3 |
|
|
3.9 |
|
|
3.5 |
|
|||||||
Silver produced (oz.) |
|
1,074,230 |
|
|
1,226,477 |
|
|
887,858 |
|
|
955,401 |
|
|
831,532 |
|
|
3,188,565 |
|
|
2,608,727 |
|
|||||||
Lead produced (tons) |
|
7,172 |
|
|
8,147 |
|
|
5,980 |
|
|
6,131 |
|
|
5,313 |
|
|
21,299 |
|
|
17,006 |
|
|||||||
Zinc produced (tons) |
|
3,279 |
|
|
3,370 |
|
|
2,452 |
|
|
2,296 |
|
|
2,319 |
|
|
9,101 |
|
|
7,673 |
|
|||||||
Sales |
$ |
28,460 |
|
$ |
35,880 |
|
$ |
38,040 |
|
$ |
32,938 |
|
$ |
29,783 |
|
|
102,380 |
|
|
98,550 |
|
|||||||
Total cost of sales |
$ |
(24,166 |
) |
$ |
(30,348 |
) |
$ |
(29,265 |
) |
$ |
(23,252 |
) |
$ |
(23,591 |
) |
|
(83,779 |
) |
$ |
(74,287 |
) |
|||||||
Gross profit |
$ |
4,294 |
|
$ |
5,532 |
|
$ |
8,775 |
|
$ |
9,686 |
|
$ |
6,192 |
|
$ |
18,601 |
|
$ |
24,263 |
|
|||||||
Cash flow from operations |
$ |
11,624 |
|
$ |
21,861 |
|
$ |
11,765 |
|
$ |
16,953 |
|
$ |
15,017 |
|
$ |
45,250 |
|
$ |
45,641 |
|
|||||||
Capital additions |
$ |
(16,125 |
) |
$ |
(11,501 |
) |
$ |
(9,652 |
) |
$ |
(9,109 |
) |
$ |
(9,133 |
) |
$ |
(37,278 |
) |
|
(20,776 |
) |
|||||||
Free cash flow 3 |
$ |
(4,501 |
) |
$ |
10,360 |
|
$ |
2,113 |
|
$ |
7,844 |
|
$ |
5,884 |
|
$ |
7,972 |
|
$ |
24,865 |
|
|||||||
Cash cost per silver ounce, after by-product credits4 |
$ |
5.23 |
|
$ |
3.07 |
|
$ |
6.57 |
|
$ |
4.50 |
|
$ |
6.35 |
|
$ |
4.77 |
|
$ |
7.37 |
|
|||||||
AISC per silver ounce, after by-product credits5 |
$ |
15.98 |
|
$ |
9.91 |
|
$ |
13.15 |
|
$ |
12.54 |
|
$ |
16.79 |
|
$ |
12.86 |
|
$ |
15.00 |
|
|||||||
At the Lucky Friday, 2,000 dry metric tonnes of silver concentrate was inventoried to be shipped to a new customer in the fourth quarter. Costs associated with the deferral of this concentrate shipment were in inventory in the third quarter, and impact on revenues and cash flow for the fourth quarter is expected to be approximately
|
||||||||||||||||||||||||||||
Dollars are in thousands except cost per ton |
Q3-2022 |
Q2-2022 |
Q1-2022 |
Q4-2021 |
Q3-2021 |
YTD-2022 |
YTD-2021 |
|||||||||||||||||||||
|
||||||||||||||||||||||||||||
Tons of ore processed – underground |
|
162,215 |
|
|
176,576 |
|
|
161,609 |
|
|
161,355 |
|
|
167,435 |
|
|
500,400 |
|
|
533,262 |
|
|||||||
Tons of ore processed – surface pit |
|
227,726 |
|
|
225,042 |
|
|
224,541 |
|
|
225,662 |
|
|
230,708 |
|
|
677,309 |
|
|
607,967 |
|
|||||||
Tons of ore processed – total |
|
389,941 |
|
|
401,618 |
|
|
386,150 |
|
|
387,017 |
|
|
398,143 |
|
|
1,177,709 |
|
|
1,141,229 |
|
|||||||
Surface tons mined – ore and waste |
|
2,822,906 |
|
|
2,149,412 |
|
|
1,892,339 |
|
|
1,507,457 |
|
|
1,483,231 |
|
|
6,864,657 |
|
|
4,996,522 |
|
|||||||
Total production cost per ton |
$ |
114.52 |
|
$ |
113.07 |
|
$ |
117.96 |
|
$ |
108.82 |
|
$ |
86.95 |
|
|
115.15 |
|
$ |
95.13 |
|
|||||||
Ore grade milled – Gold (oz./ton) – underground |
|
0.15 |
|
|
0.19 |
|
|
0.14 |
|
|
0.17 |
|
|
0.16 |
|
|
0.17 |
|
|
0.16 |
|
|||||||
Ore grade milled – Gold (oz./ton) - surface pit |
|
0.06 |
|
|
0.05 |
|
|
0.05 |
|
|
0.07 |
|
|
0.04 |
|
|
0.06 |
|
|
0.06 |
|
|||||||
Ore grade milled – Gold (oz./ton) – combined |
|
0.10 |
|
|
0.10 |
|
|
0.09 |
|
|
0.11 |
|
|
0.09 |
|
|
0.09 |
|
|
0.10 |
|
|||||||
Gold produced (oz.) – underground |
|
22,181 |
|
|
22,866 |
|
|
19,374 |
|
|
22,910 |
|
|
24,170 |
|
|
64,421 |
|
|
75,180 |
|
|||||||
Gold produced (oz.) – surface pit |
|
11,154 |
|
|
10,440 |
|
|
10,866 |
|
|
14,356 |
|
|
5,552 |
|
|
32,460 |
|
|
22,065 |
|
|||||||
Gold produced (oz.) – total |
|
33,335 |
|
|
33,306 |
|
|
30,240 |
|
|
37,266 |
|
|
29,722 |
|
|
96,881 |
|
|
97,245 |
|
|||||||
Silver produced (oz.) – total |
|
6,882 |
|
|
8,379 |
|
|
7,068 |
|
|
7,967 |
|
|
7,012 |
|
|
22,329 |
|
|
25,604 |
|
|||||||
Sales |
$ |
56,939 |
|
$ |
62,639 |
|
$ |
62,101 |
|
$ |
60,054 |
|
$ |
56,065 |
|
$ |
181,679 |
|
$ |
185,098 |
|
|||||||
Total cost of sales |
$ |
(59,532 |
) |
$ |
(61,870 |
) |
$ |
(62,168 |
) |
$ |
(57,069 |
) |
$ |
(58,164 |
) |
$ |
(183,570 |
) |
$ |
(172,760 |
) |
|||||||
Gross profit/(loss) |
$ |
(2,593 |
) |
$ |
769 |
|
$ |
(67 |
) |
$ |
2,985 |
|
$ |
(2,099 |
) |
|
(1,891 |
) |
$ |
12,338 |
|
|||||||
Cash flow from operations |
$ |
8,721 |
|
$ |
7,417 |
|
$ |
8,089 |
|
$ |
10,029 |
|
$ |
17,058 |
|
$ |
24,227 |
|
$ |
71,164 |
|
|||||||
Exploration |
$ |
2,624 |
|
$ |
1,341 |
|
$ |
2,635 |
|
$ |
2,124 |
|
$ |
4,382 |
|
$ |
6,600 |
|
$ |
3,551 |
|
|||||||
Capital additions |
$ |
(10,771 |
) |
$ |
(8,093 |
) |
$ |
(7,808 |
) |
$ |
(9,537 |
) |
$ |
(11,488 |
) |
$ |
(26,672 |
) |
$ |
(40,080 |
) |
|||||||
Free cash flow 3 |
$ |
574 |
|
$ |
665 |
|
$ |
2,916 |
|
$ |
2,616 |
|
$ |
9,952 |
|
$ |
4,155 |
|
$ |
34,635 |
|
|||||||
Cash Cost per gold ounce, after by-product credits4 |
$ |
1,349 |
|
$ |
1,371 |
|
$ |
1,516 |
|
$ |
1,137 |
|
$ |
1,175 |
|
$ |
1,409 |
|
$ |
1,127 |
|
|||||||
AISC per gold ounce, after by-product credits5 |
$ |
1,738 |
|
$ |
1,641 |
|
$ |
1,810 |
|
$ |
1,470 |
|
$ |
1,476 |
|
$ |
1,729 |
|
$ |
1,387 |
|
|||||||
Total cost of sales for the third quarter 2022 was
At the Keno Hill mine, focus is on development and drilling of the
Fourth quarter capital spending is forecast at
EXPLORATION AND PRE-DEVELOPMENT UPDATE
Exploration and pre-development expenditures were
Exploration drilling on the underexplored Coral Wigwam target area has discovered high-grade silver mineralization. Assay results to date include 101.5 oz/ton silver over 7.3 feet estimated true width.
At
-
Southwest Bench: 74.3 oz/ton silver, 0.52 oz/ton gold,
5.7% zinc and2.9% lead over 10.5 feet and 25.7 oz/ton silver, 0.15 oz/ton gold,6.4% zinc, and3.1% lead over 20.1 feet -
200 South: 18.5 oz/ton silver, 0.02 oz/ton gold,
2.6% zinc, and1.1% lead over 44.7 feet -
East Zone : 51.6 oz/ton silver, 0.05 oz/ton gold,0.1% zinc, and0.0% lead over 11.1 feet and 227.8 oz/ton silver, 2.84 oz/ton gold,4.2% zinc, and0.4% lead over 2.9 feet -
West Zone : 37.0 oz/ton silver, 0.26 oz/ton gold,18.3% zinc, and9.5% lead over 47.2 feet and 55.2 oz/ton silver, 0.16 oz/ton gold,16.5% zinc, and8.9% lead over 31.2 feet
Detailed complete drill assay highlights can be found in Table A at the end of the release.
Figure 1: Plan view showing drilling locations and areas where assays have been received in relation to the multiple ore zones at
At Casa Berardi, up to seven underground core drills and one surface core drill were focused on definition and exploration drilling in multiple zones and target areas and one surface core drill was focused on condemnation drilling.
Drilling targeted the 113, 118, 119 and Lower Inter zones. In the 113 Zone, two drill rigs are testing offsets and depth extensions of multiple 113 lenses. In the 118 Zone, drilling has been focused on defining continuity and expanding mineralization in the 118-14, and 118-15 lenses up and down plunge and to the east. Most of the 118 drilling has been showing good vertical continuity of mineralization. The drilling targeting the 119-02 lens show that the structure remains open at depth while closing to the east. Highlights include:
- 113: 0.56 oz/ton gold over 9.5 feet, including 1.61 oz/ton gold over 2.6 feet
- 118: 0.20 oz/ton gold over 8.2 feet
- 119: 0.16 oz/t gold over 14.8 feet.
More complete drill assay highlights can be found in Table A at the end of the release.
Aurora,
Exploration drilling has confirmed wide and high-grade vein mineralization along the Martinez-Juniata-Chesco mineral trend. This mineralization continues to be open for expansion along strike and dip. Some significant intercepts are:
-
Martinez Zone : 0.40 oz/ton gold and 1.8 oz/t silver over 31.1 feet estimated true width, which includes 1.26 oz/ton gold and 4.4 oz/t silver over 6.7 feet estimated true width. -
Juniata Zone : 0.43 oz/ton gold and 1.9 oz/ton silver over 14.9 feet estimated true width, which includes 0.76 oz/ton gold, 3.5 oz/ton silver over 8.0 feet estimated true width. -
Chesco Zone : 0.73 oz/ton gold and 7.7 oz/ton silver over 12.2 feet estimated true width
Exploration drilling identified high-grade vein mineralization at both the Lone Pine-Blacktail and Tom Thumb target areas. Wide zones of lower grade, potentially bulk mineable, material surround some of the high-grade vein intercepts at Lone Pine-Blacktail. Drilling also discovered an offset segment of the Tom Thumb Vein 850 feet across the Mud
DIVIDENDS
Common Stock
The Board of Directors declared a quarterly cash dividend of
Preferred Stock
The Board of Directors elected to declare a quarterly cash dividend of
2022 GUIDANCE
The Company has reaffirmed its guidance for annual production, cost, and exploration and pre-development. The Company is maintaining its consolidated capital guidance with lower forecasted capital spend at the Lucky Friday and
|
(millions) |
|
|
Previous |
Current |
Capital expenditures |
|
|
|
|
|
|
|
|
|
|
|
|
NA |
|
CONFERENCE CALL AND WEBCAST
A conference call and webcast will be held
ONE ON ONE CALLS
Hecla will make available members of management for one on one calls with any interested parties on
Hecla invites stockholders, investors, and other interested parties to schedule a personal, 30-minute virtual meeting (video or telephone) with a member of management to discuss operations, exploration, or general matters. Click on the link below to schedule a call (or copy and paste the link into your web browser.) You can select a topic once you have entered the meeting calendar. If you are unable to book a time, either due to high demand or for other reasons, please reach out to
One-on-One meeting URL: https://calendly.com/2022-november-vie
ABOUT HECLA
Founded in 1891, Hecla is the largest silver producer in
NOTES
Non-GAAP Financial Measures
Non-GAAP financial measures are intended to provide additional information only and do not have any standard meaning prescribed by
(1) Adjusted net income (loss) applicable to common stockholders is a non-GAAP measurement, a reconciliation of which to net income (loss) applicable to common stockholders, the most comparable GAAP measure, can be found at the end of the release. Adjusted net income (loss) is a measure used by management to evaluate the Company's operating performance but should not be considered an alternative to net income (loss) as defined by GAAP. They exclude certain impacts which are of a nature which we believe are not reflective of our underlying performance. Management believes that adjusted net income (loss) per common share provides investors with the ability to better evaluate our underlying operating performance.
(2) Adjusted EBITDA is a non-GAAP measurement, a reconciliation of which to net income(loss), the most comparable GAAP measure, can be found at the end of the release. Adjusted EBITDA is a measure used by management to evaluate the Company's operating performance but should not be considered an alternative to net income, or cash provided by operating activities as those terms are defined by GAAP, and does not necessarily indicate whether cash flows will be sufficient to fund cash needs. In addition, the Company may use it when formulating performance goals and targets under its incentive program. Net debt to adjusted EBITDA is a non-GAAP measurement, a reconciliation of which to debt and net income (loss), the most comparable GAAP measurements, can be found at the end of the release. It is an important measure for management to measure relative indebtedness and the ability to service the debt relative to its peers. It is calculated as total debt outstanding less total cash on hand divided by adjusted EBITDA.
(3) Free cash flow is a non-GAAP measure calculated as cash provided by operating activities less additions to properties, plants and equipment. Free cash flow for
(4) Cash cost, after by-product credits, per silver and gold ounce is a non-GAAP measurement, a reconciliation of which to total cost of sales, can be found at the end of the release. It is an important operating statistic that management utilizes to measure each mine's operating performance. It also allows the benchmarking of performance of each mine versus those of our competitors. As a primary silver mining company, management also uses the statistic on an aggregate basis - aggregating the
(5) All-in sustaining cost (AISC), after by-product credits, is a non-GAAP measurement, a reconciliation of which to cost of sales and other direct production costs and depreciation, depletion and amortization, the closest GAAP measurement, can be found in the end of the release. AISC, after by-product credits, includes total cost of sales, expenses for reclamation and exploration at the mines sites, corporate exploration related to sustaining operations, and all site sustaining capital costs. AISC, after by-product credits, is calculated net of depreciation, depletion, and amortization and by-product credits.
Current GAAP measures used in the mining industry, such as cost of goods sold, do not capture all the expenditures incurred to discover, develop and sustain silver and gold production. Management believes that all-in sustaining costs is a non-GAAP measure that provides additional information to management, investors and analysts to help (i) in the understanding of the economics of our operations and performance compared to other producers and (ii) in the transparency by better defining the total costs associated with production. Similarly, the statistic is useful in identifying acquisition and investment opportunities as it provides a common tool for measuring the financial performance of other mines with varying geologic, metallurgical and operating characteristics. In addition, the Company may use it when formulating performance goals and targets under its incentive program.
Cautionary Statements to Investors on Forward-Looking Statements
This news release contains “forward-looking statements” within the meaning of Section 27A of the Securities Act of 1933, as amended, and Section 21E of the Securities Exchange Act of 1934, as amended, which are intended to be covered by the safe harbor created by such sections and other applicable laws, including Canadian securities laws. When a forward-looking statement expresses or implies an expectation or belief as to future events or results, such expectation or belief is expressed in good faith and believed to have a reasonable basis. However, such statements are subject to risks, uncertainties, and other factors, which could cause actual results to differ materially from future results expressed, projected or implied by the forward-looking statements. Forward-looking statements often address our expected future business and financial performance and financial condition and often contain words such as “anticipate,” “intend,” “plan,” “will,” “could,” “would,” “estimate,” “should,” “expect,” “believe,” “project,” “target,” “indicative,” “preliminary,” “potential” and similar expressions. Forward-looking statements in this news release may include, without limitation: (i) the Company could be the largest silver producer in the
Estimates or expectations of future events or results are based upon certain assumptions, which may prove to be incorrect, which could cause actual results to differ from forward-looking statements. Such assumptions, include, but are not limited to: (i) there being no significant change to current geotechnical, metallurgical, hydrological and other physical conditions; (ii) permitting, development, operations and expansion of the Company’s projects being consistent with current expectations and mine plans; (iii) political/regulatory developments in any jurisdiction in which the Company operates being consistent with its current expectations; (iv) the exchange rate for the USD/CAD being approximately consistent with current levels; (v) certain price assumptions for gold, silver, lead and zinc; (vi) prices for key supplies being approximately consistent with current levels; (vii) the accuracy of our current mineral reserve and mineral resource estimates; (viii) the Company’s plans for development and production will proceed as expected and will not require revision as a result of risks or uncertainties, whether known, unknown or unanticipated; (ix) counterparties performing their obligations under hedging instruments and put option contracts; (x) sufficient workforce is available and trained to perform assigned tasks; (xi) weather patterns and rain/snowfall within normal seasonal ranges so as not to impact operations; (xii) relations with interested parties, including
In addition, material risks that could cause actual results to differ from forward-looking statements include, but are not limited to: (i) gold, silver and other metals price volatility; (ii) operating risks; (iii) currency fluctuations; (iv) increased production costs and variances in ore grade or recovery rates from those assumed in mining plans; (v) community relations; (vi) conflict resolution and outcome of projects or oppositions; (vii) litigation, political, regulatory, labor and environmental risks; (viii) exploration risks and results, including that mineral resources are not mineral reserves, they do not have demonstrated economic viability and there is no certainty that they can be upgraded to mineral reserves through continued exploration; (ix) the failure of counterparties to perform their obligations under hedging instruments; (x) the Company takes a material impairment charge on its
Qualified Person (QP)
Condensed Consolidated Statements of Operations (dollars and shares in thousands, except per share amounts - unaudited) |
||||||||||||||||
|
|
Three Months Ended |
|
Nine Months Ended |
||||||||||||
|
|
|
|
|
|
|
|
|
||||||||
Sales |
|
$ |
146,339 |
|
|
$ |
193,560 |
|
|
$ |
524,080 |
|
|
$ |
622,395 |
|
Cost of sales and other direct production costs |
|
|
104,900 |
|
|
|
112,542 |
|
|
|
326,579 |
|
|
|
318,917 |
|
Depreciation, depletion and amortization |
|
|
32,992 |
|
|
|
45,790 |
|
|
|
106,362 |
|
|
|
138,918 |
|
Total cost of sales |
|
|
137,892 |
|
|
|
158,332 |
|
|
|
432,941 |
|
|
|
457,835 |
|
Gross profit |
|
|
8,447 |
|
|
|
35,228 |
|
|
|
91,139 |
|
|
|
164,560 |
|
Other operating expenses: |
|
|
|
|
|
|
|
|
||||||||
General and administrative |
|
|
11,003 |
|
|
|
8,874 |
|
|
|
28,989 |
|
|
|
27,985 |
|
Exploration and pre-development |
|
|
15,128 |
|
|
|
17,108 |
|
|
|
39,136 |
|
|
|
35,039 |
|
Care and maintenance costs |
|
|
5,092 |
|
|
|
6,910 |
|
|
|
16,539 |
|
|
|
17,014 |
|
Provision for closed operations and environmental matters |
|
|
1,781 |
|
|
|
7,564 |
|
|
|
4,154 |
|
|
|
12,297 |
|
Other operating expense |
|
|
902 |
|
|
|
3,344 |
|
|
|
5,310 |
|
|
|
10,626 |
|
Total other operating expenses |
|
|
33,906 |
|
|
|
43,800 |
|
|
|
94,128 |
|
|
|
102,961 |
|
(Loss) income from operations |
|
|
(25,459 |
) |
|
|
(8,572 |
) |
|
|
(2,989 |
) |
|
|
61,599 |
|
Other income (expense): |
|
|
|
|
|
|
|
|
||||||||
Interest expense |
|
|
(10,874 |
) |
|
|
(10,469 |
) |
|
|
(31,785 |
) |
|
|
(31,484 |
) |
Fair value adjustments, net |
|
|
(4,240 |
) |
|
|
9,287 |
|
|
|
(14,703 |
) |
|
|
(10,651 |
) |
Net foreign exchange gain (loss) |
|
|
5,667 |
|
|
|
3,995 |
|
|
|
8,111 |
|
|
|
24 |
|
Other income (expense) |
|
|
1,853 |
|
|
|
247 |
|
|
|
4,828 |
|
|
|
(192 |
) |
Total other (expense) income |
|
|
(7,594 |
) |
|
|
3,060 |
|
|
|
(33,549 |
) |
|
|
(42,303 |
) |
(Loss) income before income and mining taxes |
|
|
(33,053 |
) |
|
|
(5,512 |
) |
|
|
(36,538 |
) |
|
|
19,296 |
|
Income and mining tax (provision) benefit |
|
|
9,527 |
|
|
|
4,533 |
|
|
|
3,642 |
|
|
|
3,924 |
|
Net (loss) income |
|
|
(23,526 |
) |
|
|
(979 |
) |
|
|
(32,896 |
) |
|
|
23,220 |
|
Preferred stock dividends |
|
|
(138 |
) |
|
|
(138 |
) |
|
|
(414 |
) |
|
|
(414 |
) |
(Loss) income applicable to common stockholders |
|
$ |
(23,664 |
) |
|
$ |
(1,117 |
) |
|
$ |
(33,310 |
) |
|
$ |
22,806 |
|
Basic (loss) income per common share after preferred dividends |
|
$ |
(0.04 |
) |
|
$ |
— |
|
|
$ |
(0.06 |
) |
|
$ |
0.04 |
|
Weighted average number of common shares outstanding – basic |
|
|
554,531 |
|
|
|
536,966 |
|
|
|
544,000 |
|
|
|
535,542 |
|
Weighted average number of common shares outstanding – diluted |
|
|
554,531 |
|
|
|
536,966 |
|
|
|
544,000 |
|
|
|
541,769 |
|
Condensed Consolidated Statements of Cash Flows (dollars in thousands - unaudited) |
||||||||||||||||
|
Quarter Ended |
Nine Months Ended |
||||||||||||||
|
|
|
|
|
||||||||||||
OPERATING ACTIVITIES |
|
|
|
|
||||||||||||
Net (loss) income |
$ |
(23,526 |
) |
$ |
(979 |
) |
$ |
(32,896 |
) |
$ |
23,220 |
|
||||
Non-cash elements included in net (loss) income |
|
|
|
|
||||||||||||
Depreciation, depletion and amortization |
|
33,087 |
|
|
46,939 |
|
|
106,743 |
|
|
139,800 |
|
||||
Write-down of inventory |
|
1,405 |
|
|
93 |
|
|
2,159 |
|
|
6,524 |
|
||||
Fair value adjustments, net |
|
17,671 |
|
|
(13,192 |
) |
|
3,486 |
|
|
(7,978 |
) |
||||
Provision for reclamation and closure costs |
|
1,518 |
|
|
1,638 |
|
|
4,789 |
|
|
7,821 |
|
||||
Stock compensation |
|
1,773 |
|
|
1,472 |
|
|
4,298 |
|
|
4,774 |
|
||||
Deferred income taxes |
|
(16,538 |
) |
|
(10,141 |
) |
|
(17,828 |
) |
|
(17,886 |
) |
||||
Foreign exchange loss (gain) |
|
(4,911 |
) |
|
(3,842 |
) |
|
(8,353 |
) |
|
615 |
|
||||
Other non-cash items, net |
|
1,472 |
|
|
98 |
|
|
2,454 |
|
|
1,167 |
|
||||
Change in assets and liabilities: |
|
|
|
|
||||||||||||
Accounts receivable |
|
15,589 |
|
|
5,634 |
|
|
34,788 |
|
|
(3,798 |
) |
||||
Inventories |
|
(11,120 |
) |
|
16,653 |
|
|
(19,472 |
) |
|
22,372 |
|
||||
Other current and non-current assets |
|
(2,526 |
) |
|
(2,475 |
) |
|
(3,420 |
) |
|
1,650 |
|
||||
Accounts payable, accrued and other current liabilities |
|
(38,827 |
) |
|
(8,200 |
) |
|
(21,708 |
) |
|
(14,689 |
) |
||||
Accrued payroll and related benefits |
|
1,401 |
|
|
3,522 |
|
|
1,679 |
|
|
(1,829 |
) |
||||
Accrued taxes |
|
3,031 |
|
|
3,729 |
|
|
(2,652 |
) |
|
2,730 |
|
||||
Accrued reclamation and closure costs and other non-current liabilities |
|
(3,821 |
) |
|
1,793 |
|
|
(297 |
) |
|
2,489 |
|
||||
Cash provided by operating activities |
|
(24,322 |
) |
|
42,742 |
|
|
53,770 |
|
|
166,982 |
|
||||
|
|
|
|
|
||||||||||||
INVESTING ACTIVITIES |
|
|
|
|
||||||||||||
Additions to properties, plants, equipment and mineral interests |
|
(37,430 |
) |
|
(26,899 |
) |
|
(93,237 |
) |
|
(80,210 |
) |
||||
Proceeds from sale of investments |
|
6,888 |
|
|
— |
|
|
9,375 |
|
|
— |
|
||||
Proceeds from disposition of properties, plants and equipment |
|
18 |
|
|
431 |
|
|
748 |
|
|
562 |
|
||||
Purchases of investments |
|
(8,641 |
) |
|
— |
|
|
(30,540 |
) |
|
— |
|
||||
Proceeds from exchange of investments |
|
— |
|
|
1,811 |
|
|
— |
|
|
1,811 |
|
||||
Purchase of carbon credits |
|
— |
|
|
(200 |
) |
|
— |
|
|
(200 |
) |
||||
Acquisition, net |
|
8,952 |
|
|
— |
|
|
8,952 |
|
|
— |
|
||||
Pre-acquisition advance to Alexco |
|
(25,000 |
) |
|
— |
|
|
(25,000 |
) |
|
— |
|
||||
Changes in restricted cash and investment balances |
|
2,011 |
|
|
— |
|
|
2,011 |
|
|
— |
|
||||
Net cash used in investing activities |
|
(53,202 |
) |
|
(24,857 |
) |
|
(127,691 |
) |
|
(78,037 |
) |
||||
|
|
|
|
|
||||||||||||
FINANCING ACTIVITIES |
|
|
|
|
||||||||||||
Draw on revolving credit facility |
|
25,000 |
|
|
— |
|
|
25,000 |
|
|
— |
|
||||
Proceeds from issuance of stock, net of related costs |
|
4,542 |
|
|
— |
|
|
4,542 |
|
|
— |
|
||||
Acquisition of treasury shares |
|
— |
|
|
— |
|
|
(3,677 |
) |
|
(4,525 |
) |
||||
Dividends paid to common and preferred stockholders |
|
(3,522 |
) |
|
(6,178 |
) |
|
(10,549 |
) |
|
(17,169 |
) |
||||
Credit facility fees paid |
|
(443 |
) |
|
(26 |
) |
|
(517 |
) |
|
(108 |
) |
||||
Repayments of finance leases |
|
(1,889 |
) |
|
(1,828 |
) |
|
(5,222 |
) |
|
(5,598 |
) |
||||
Net cash used in financing activities |
|
23,688 |
|
|
(8,032 |
) |
|
9,577 |
|
|
(27,400 |
) |
||||
Effect of exchange rates on cash |
|
517 |
|
|
(443 |
) |
|
(804 |
) |
|
(471 |
) |
||||
Net increase (decrease) in cash, cash equivalents and restricted cash |
|
(53,319 |
) |
|
9,410 |
|
|
(65,148 |
) |
|
61,074 |
|
||||
Cash, cash equivalents and restricted cash at beginning of period |
|
199,234 |
|
$ |
182,547 |
|
|
211,063 |
|
|
130,883 |
|
||||
Cash, cash equivalents and restricted cash at end of period |
$ |
145,915 |
|
$ |
191,957 |
|
$ |
145,915 |
|
$ |
191,957 |
|
||||
Supplemental disclosure of cash flow information: |
|
|
|
|
||||||||||||
Cash paid for interest |
$ |
18,430 |
|
$ |
18,674 |
|
$ |
37,179 |
|
$ |
37,173 |
|
||||
Cash paid for income and mining taxes, net |
$ |
1,173 |
|
$ |
830 |
|
$ |
13,061 |
|
$ |
10,299 |
|
||||
Condensed Consolidated Balance Sheets (dollars and shares in thousands - unaudited) |
||||||||
|
|
|
|
|||||
ASSETS |
|
|
|
|||||
Current assets: |
|
|
|
|||||
Cash and cash equivalents |
$ |
144,669 |
|
|
$ |
210,010 |
|
|
Accounts receivable: |
|
|
|
|||||
Trade |
|
12,477 |
|
|
|
36,437 |
|
|
Other, net |
|
12,846 |
|
|
|
8,149 |
|
|
Inventories |
|
92,005 |
|
|
|
67,765 |
|
|
Derivative assets |
|
7,190 |
|
|
|
2,709 |
|
|
Other current assets |
|
14,733 |
|
|
|
16,557 |
|
|
Total current assets |
|
283,920 |
|
|
|
341,627 |
|
|
Investments |
|
13,299 |
|
|
|
10,844 |
|
|
Restricted cash |
|
1,246 |
|
|
|
1,053 |
|
|
Properties, plants, equipment and mineral interests, net |
|
2,553,974 |
|
|
|
2,310,810 |
|
|
Operating lease right-of-use asset |
|
11,632 |
|
|
|
12,435 |
|
|
Deferred income taxes |
|
45,562 |
|
|
|
45,562 |
|
|
Derivative assets |
|
20,794 |
|
|
|
2,503 |
|
|
Other non-current assets |
|
4,202 |
|
|
|
3,974 |
|
|
Total assets |
$ |
2,934,629 |
|
|
$ |
2,728,808 |
|
|
LIABILITIES |
|
|
|
|||||
Current liabilities: |
|
|
|
|||||
Accounts payable and accrued liabilities |
$ |
87,850 |
|
|
$ |
68,100 |
|
|
Accrued payroll and related benefits |
|
26,385 |
|
|
|
28,714 |
|
|
Accrued taxes |
|
7,344 |
|
|
|
12,306 |
|
|
Finance and operating leases |
|
12,489 |
|
|
|
8,098 |
|
|
Derivative liabilities |
|
5,774 |
|
|
|
19,353 |
|
|
Other current liabilities |
|
10,949 |
|
|
|
14,553 |
|
|
Accrued reclamation and closure costs |
|
10,594 |
|
|
|
9,259 |
|
|
Total current liabilities |
|
161,385 |
|
|
|
160,383 |
|
|
Finance and operating leases |
|
20,242 |
|
|
|
17,726 |
|
|
Accrued reclamation and closure costs |
|
105,717 |
|
|
|
103,972 |
|
|
Long-term debt |
|
530,745 |
|
|
|
508,095 |
|
|
Deferred tax liability |
|
154,225 |
|
|
|
149,706 |
|
|
Derivative liabilities |
|
5,560 |
|
|
|
18,528 |
|
|
Other non-current liabilities |
|
1,987 |
|
|
|
9,611 |
|
|
Total liabilities |
|
979,861 |
|
|
|
968,021 |
|
|
STOCKHOLDERS’ EQUITY |
|
|
|
|||||
Preferred stock |
|
39 |
|
|
|
39 |
|
|
Common stock |
|
150,839 |
|
|
|
136,391 |
|
|
Capital surplus |
|
2,241,649 |
|
|
|
2,034,485 |
|
|
Accumulated deficit |
|
(397,096 |
) |
|
|
(353,651 |
) |
|
Accumulated other comprehensive income (loss) |
|
(8,965 |
) |
|
|
(28,456 |
) |
|
|
|
(31,698 |
) |
|
|
(28,021 |
) |
|
Total stockholders’ equity |
|
1,954,768 |
|
|
|
1,760,787 |
|
|
Total liabilities and stockholders’ equity |
$ |
2,934,629 |
|
|
$ |
2,728,808 |
|
|
Common shares outstanding |
|
603,702 |
|
|
|
545,535 |
|
|
Non-GAAP Measures
(Unaudited)
Reconciliation of Cost of Sales (GAAP) to Cash Cost, Before By-product Credits and Cash Cost, After By-product Credits (non-GAAP) and All-In Sustaining Cost, Before By-product Credits and All-In Sustaining Cost, After By-product Credits (non-GAAP)
The tables below present reconciliations between the most comparable GAAP measure of cost of sales and other direct production costs and depreciation, depletion and amortization to the non-GAAP measures of Cash Cost, Before By-product Credits, Cash Cost, After By-product Credits, AISC, Before By-product Credits and AISC, After By-product Credits for our operations at the
Cash Cost, After By-product Credits, per Ounce and AISC, After By-product Credits, per Ounce are measures developed by precious metals companies (including the
Cash Cost, After By-product Credits, per Ounce is an important operating statistic that we utilize to measure each mine's operating performance. AISC, After By-product Credits, per Ounce is an important operating statistic that we utilize as a measures of our mines' net cash flow after costs for exploration, pre-development, reclamation, and sustaining capital. Current GAAP measures used in the mining industry, such as cost of goods sold, do not capture all the expenditures incurred to discover, develop and sustain silver and gold production. Cash Cost, After By-product Credits, per Ounce and AISC, After By-product Credits, per Ounce also allow us to benchmark the performance of each of our mines versus those of our competitors. As a silver and gold mining company, we also use these statistics on an aggregate basis - aggregating the
Cash Cost, Before By-product Credits and AISC, Before By-product Credits include all direct and indirect operating cash costs related directly to the physical activities of producing metals, including mining, processing and other plant costs, third-party refining expense, on-site general and administrative costs, royalties and mining production taxes. AISC, Before By-product Credits for each mine also includes on-site exploration, reclamation, and sustaining capital costs. AISC, Before By-product Credits for our consolidated silver properties also includes corporate costs for general and administrative expense, reclamation, exploration, and pre-development. By-product credits include revenues earned from all metals other than the primary metal produced at each unit. As depicted in the tables below, by-product credits comprise an essential element of our silver unit cost structure, distinguishing our silver operations due to the polymetallic nature of their orebodies. Cash Cost, After By-product Credits, per Ounce and AISC, After By-product Credits, per Ounce provide management and investors an indication of operating cash flow, after consideration of the average price, received from production. We also use these measurements for the comparative monitoring of performance of our mining operations period-to-period from a cash flow perspective.
The Casa Berardi, Nevada Operations and combined gold properties information below reports Cash Cost, After By-product Credits, per Gold Ounce and AISC, After By-product Credits, per Gold Ounce for the production of gold, its primary product, and by-product revenues earned from silver, which is a by-product at Casa Berardi and Nevada Operations. Only costs and ounces produced relating to units with the same primary product are combined to represent Cash Cost, After By-product Credits, per Ounce and AISC, After By-product Credits, per Ounce. Thus, the gold produced at our
Reconciliation of Cost of Sales to Non-GAAP Measures, continued |
||||||||||||||||||||||||||||||||||||||||||||||||||||||||||||||
In thousands (except per ounce amounts) |
Three Months Ended |
|
Three Months Ended |
|
Nine Months Ended |
|
Nine Months Ended |
|||||||||||||||||||||||||||||||||||||||||||||||||||||||
|
|
|
|
Other |
|
Total Silver |
|
|
|
|
|
Other |
|
Total Silver |
|
|
|
|
|
Other |
|
Total Silver |
|
|
|
|
|
Other(2) |
|
Total Silver |
||||||||||||||||||||||||||||||||
Total cost of sales |
$ |
52,502 |
|
|
$ |
24,164 |
|
|
|
— |
|
$ |
76,666 |
|
|
$ |
60,506 |
|
|
$ |
30,348 |
|
|
|
— |
|
$ |
90,854 |
|
|
$ |
162,644 |
|
|
$ |
83,779 |
|
|
|
— |
|
$ |
246,423 |
|
|
$ |
163,861 |
|
|
$ |
74,287 |
|
|
$ |
95 |
|
|
$ |
238,243 |
|
||
Depreciation, depletion and amortization |
|
(10,305 |
) |
|
|
(7,261 |
) |
|
|
— |
|
|
(17,566 |
) |
|
|
(13,629 |
) |
|
|
(8,862 |
) |
|
|
— |
|
|
(22,491 |
) |
|
|
(35,354 |
) |
|
|
(24,155 |
) |
|
|
— |
|
|
(59,509 |
) |
|
|
(42,410 |
) |
|
|
(20,328 |
) |
|
|
— |
|
|
|
(62,738 |
) |
||
Treatment costs |
|
9,477 |
|
|
|
4,791 |
|
|
|
— |
|
|
14,268 |
|
|
|
8,778 |
|
|
|
4,803 |
|
|
|
— |
|
|
13,581 |
|
|
|
27,369 |
|
|
|
13,271 |
|
|
|
— |
|
|
40,640 |
|
|
|
27,444 |
|
|
|
13,087 |
|
|
|
— |
|
|
|
40,531 |
|
||
Change in product inventory |
|
4,464 |
|
|
|
3,022 |
|
|
|
— |
|
|
7,486 |
|
|
|
(1,102 |
) |
|
|
503 |
|
|
|
— |
|
|
(599 |
) |
|
|
9,899 |
|
|
|
2,620 |
|
|
|
— |
|
|
12,519 |
|
|
|
(156 |
) |
|
|
(1,757 |
) |
|
|
— |
|
|
|
(1,913 |
) |
||
Reclamation and other costs |
|
(118 |
) |
|
|
(152 |
) |
|
|
— |
|
|
(270 |
) |
|
|
(1,005 |
) |
|
|
(256 |
) |
|
|
— |
|
|
(1,261 |
) |
|
|
(1,988 |
) |
|
|
(769 |
) |
|
|
— |
|
|
(2,757 |
) |
|
|
(1,777 |
) |
|
|
(840 |
) |
|
|
(95 |
) |
|
|
(2,712 |
) |
||
Cash Cost, Before By-product Credits (1) |
|
56,020 |
|
|
|
24,564 |
|
|
|
— |
|
|
80,584 |
|
|
|
53,548 |
|
|
|
26,536 |
|
|
|
— |
|
|
80,084 |
|
|
|
162,570 |
|
|
|
74,746 |
|
|
|
— |
|
|
237,316 |
|
|
|
146,962 |
|
|
|
64,449 |
|
|
|
— |
|
|
|
211,411 |
|
||
Reclamation and other costs |
|
705 |
|
|
|
282 |
|
|
|
— |
|
|
987 |
|
|
|
705 |
|
|
|
282 |
|
|
|
— |
|
|
987 |
|
|
|
2,115 |
|
|
|
846 |
|
|
|
— |
|
|
2,961 |
|
|
|
2,543 |
|
|
|
792 |
|
|
|
— |
|
|
|
3,335 |
|
||
Exploration |
|
3,776 |
|
|
|
— |
|
|
|
722 |
|
|
4,498 |
|
|
|
929 |
|
|
|
— |
|
|
|
769 |
|
|
1,698 |
|
|
|
4,870 |
|
|
|
— |
|
|
|
2,207 |
|
|
7,077 |
|
|
|
3,895 |
|
|
|
— |
|
|
|
1,359 |
|
|
|
5,254 |
|
||
Sustaining capital |
|
10,219 |
|
|
|
11,264 |
|
|
|
187 |
|
|
21,670 |
|
|
|
14,668 |
|
|
|
8,110 |
|
|
|
99 |
|
|
22,877 |
|
|
|
30,843 |
|
|
|
24,937 |
|
|
|
334 |
|
|
56,114 |
|
|
|
17,459 |
|
|
|
19,104 |
|
|
|
— |
|
|
|
36,563 |
|
||
General and administrative |
|
— |
|
|
|
— |
|
|
|
11,003 |
|
|
11,003 |
|
|
|
— |
|
|
|
— |
|
|
|
9,692 |
|
|
9,692 |
|
|
|
— |
|
|
|
— |
|
|
|
28,989 |
|
|
28,989 |
|
|
|
— |
|
|
|
— |
|
|
|
27,985 |
|
|
|
27,985 |
|
||
AISC, Before By-product Credits (1) |
|
70,720 |
|
|
|
36,110 |
|
|
|
11,912 |
|
|
118,742 |
|
|
|
69,850 |
|
|
|
34,928 |
|
|
|
10,560 |
|
|
115,338 |
|
|
|
200,398 |
|
|
|
100,529 |
|
|
|
31,530 |
|
|
332,457 |
|
|
|
170,859 |
|
|
|
84,345 |
|
|
|
29,344 |
|
|
|
284,548 |
|
||
By-product credits: |
|
|
|
|
|
|
|
|
|
|
|
|
|
|
|
|
|
|
|
|
|
|
|
|
|
|
|
|
|
|
|
|||||||||||||||||||||||||||||||
Zinc |
|
(26,244 |
) |
|
|
(7,155 |
) |
|
|
— |
|
|
(33,399 |
) |
|
|
(32,828 |
) |
|
|
(8,227 |
) |
|
|
— |
|
|
(41,055 |
) |
|
|
(87,723 |
) |
|
|
(21,358 |
) |
|
|
— |
|
|
(109,081 |
) |
|
|
(74,571 |
) |
|
|
(14,457 |
) |
|
|
— |
|
|
|
(89,028 |
) |
||
Gold |
|
(17,019 |
) |
|
|
— |
|
|
|
— |
|
|
(17,019 |
) |
|
|
(20,364 |
) |
|
|
— |
|
|
|
— |
|
|
(20,364 |
) |
|
|
(55,966 |
) |
|
|
— |
|
|
|
— |
|
|
(55,966 |
) |
|
|
(56,299 |
) |
|
|
— |
|
|
|
— |
|
|
|
(56,299 |
) |
||
Lead |
|
(6,212 |
) |
|
|
(11,796 |
) |
|
|
— |
|
|
(18,008 |
) |
|
|
(8,271 |
) |
|
|
(14,543 |
) |
|
|
— |
|
|
(22,814 |
) |
|
|
(22,449 |
) |
|
|
(38,175 |
) |
|
|
— |
|
|
(60,624 |
) |
|
|
(23,265 |
) |
|
|
(30,762 |
) |
|
|
— |
|
|
|
(54,027 |
) |
||
Total By-product credits |
|
(49,475 |
) |
|
|
(18,951 |
) |
|
|
— |
|
|
(68,426 |
) |
|
|
(61,463 |
) |
|
|
(22,770 |
) |
|
|
— |
|
|
(84,233 |
) |
|
|
(166,138 |
) |
|
|
(59,533 |
) |
|
|
— |
|
|
(225,671 |
) |
|
|
(154,135 |
) |
|
|
(45,219 |
) |
|
|
— |
|
|
|
(199,354 |
) |
||
Cash Cost, After By-product Credits |
$ |
6,545 |
|
|
$ |
5,613 |
|
|
$ |
— |
|
$ |
12,158 |
|
|
$ |
(7,915 |
) |
|
$ |
3,766 |
|
|
$ |
— |
|
$ |
(4,149 |
) |
|
$ |
(3,568 |
) |
|
$ |
15,213 |
|
$ |
— |
|
$ |
11,645 |
|
|
$ |
(7,173 |
) |
|
$ |
19,230 |
|
|
$ |
— |
|
|
$ |
12,057 |
|
|||
AISC, After By-product Credits |
$ |
21,245 |
|
|
$ |
17,159 |
|
|
$ |
11,912 |
|
$ |
50,316 |
|
|
$ |
8,387 |
|
|
$ |
12,158 |
|
|
$ |
10,560 |
|
$ |
31,105 |
|
|
$ |
34,260 |
|
|
$ |
40,996 |
|
|
$ |
31,530 |
|
$ |
106,786 |
|
|
$ |
16,724 |
|
|
$ |
39,126 |
|
|
$ |
29,344 |
|
|
$ |
85,194 |
|
||
Divided by ounces produced |
|
2,469 |
|
|
|
1,075 |
|
|
|
|
|
3,544 |
|
|
|
2,410 |
|
|
|
1,226 |
|
|
|
|
|
3,636 |
|
|
|
7,309 |
|
|
|
3,189 |
|
|
|
|
|
10,498 |
|
|
|
6,981 |
|
1,777 |
|
2,609 |
|
|
|
|
|
9,590 |
|
|||||||
Cash Cost, Before By-product Credits, per Silver Ounce |
$ |
22.69 |
|
|
$ |
22.87 |
|
|
|
|
$ |
22.74 |
|
|
$ |
22.21 |
|
|
$ |
21.65 |
|
|
|
|
$ |
22.03 |
|
|
$ |
22.24 |
|
|
$ |
23.44 |
|
|
|
|
$ |
22.61 |
|
|
$ |
21.05 |
|
|
$ |
24.70 |
|
|
|
|
$ |
22.05 |
|
|||||||
By-product credits per ounce |
|
(20.04 |
) |
|
|
(17.64 |
) |
|
|
|
|
(19.31 |
) |
|
|
(25.50 |
) |
|
|
(18.58 |
) |
|
|
|
|
(23.17 |
) |
|
|
(22.73 |
) |
|
|
(18.67 |
) |
|
|
|
|
(21.50 |
) |
|
|
(22.08 |
) |
|
|
(17.33 |
) |
|
|
|
|
(20.79 |
) |
|||||||
Cash Cost, After By-product Credits, per Silver Ounce |
$ |
2.65 |
|
|
$ |
5.23 |
|
|
|
|
$ |
3.43 |
|
|
$ |
(3.29 |
) |
|
$ |
3.07 |
|
|
|
|
$ |
(1.14 |
) |
|
$ |
(0.49 |
) |
|
$ |
4.77 |
|
|
|
|
$ |
1.11 |
|
|
$ |
(1.03 |
) |
|
$ |
7.37 |
|
|
|
|
$ |
1.26 |
|
|||||||
AISC, Before By-product Credits, per Silver Ounce |
$ |
28.65 |
|
|
$ |
33.62 |
|
|
|
|
$ |
33.51 |
|
|
$ |
28.98 |
|
|
$ |
28.49 |
|
|
|
|
$ |
31.72 |
|
|
$ |
27.42 |
|
|
$ |
31.53 |
|
|
|
|
$ |
31.67 |
|
|
$ |
24.48 |
|
|
$ |
32.33 |
|
|
|
|
$ |
29.67 |
|
|||||||
By-product credits per ounce |
|
(20.04 |
) |
|
|
(17.64 |
) |
|
|
|
|
(19.31 |
) |
|
|
(25.50 |
) |
|
|
(18.58 |
) |
|
|
|
|
(23.17 |
) |
|
|
(22.73 |
) |
|
|
(18.67 |
) |
|
|
|
|
(21.50 |
) |
|
|
(22.08 |
) |
|
|
(17.33 |
) |
|
|
|
|
(20.79 |
) |
|||||||
AISC, After By-product Credits, per Silver Ounce |
$ |
8.61 |
|
|
$ |
15.98 |
|
|
|
|
$ |
14.20 |
|
|
$ |
3.48 |
|
|
$ |
9.91 |
|
|
|
|
$ |
8.55 |
|
|
$ |
4.69 |
|
|
$ |
12.86 |
|
|
|
|
$ |
10.17 |
|
|
$ |
2.40 |
|
|
$ |
15.00 |
|
|
|
|
$ |
8.88 |
|
|||||||
Reconciliation of Cost of Sales to Non-GAAP Measures, continued |
|||||||||||||||||||||||||||||||||||||||
In thousands (except per ounce amounts) |
Three Months Ended
|
|
Three Months Ended
|
|
Nine Months Ended
|
|
Nine Months Ended
|
||||||||||||||||||||||||||||||||
|
Casa
|
|
Total Gold |
|
Casa
|
|
Total Gold |
|
Casa
|
|
Total Gold |
|
Casa
|
|
|
|
Corporate(3) |
|
Total Gold |
||||||||||||||||||||
Total cost of sales |
$ |
59,532 |
|
|
$ |
59,532 |
|
|
$ |
61,870 |
|
|
$ |
61,870 |
|
|
$ |
183,570 |
|
|
$ |
183,570 |
|
|
$ |
172,760 |
|
|
$ |
46,832 |
|
|
|
— |
|
$ |
219,592 |
|
|
Depreciation, depletion and amortization |
|
(15,089 |
) |
|
|
(15,089 |
) |
|
|
(15,459 |
) |
|
|
(15,459 |
) |
|
|
(46,394 |
) |
|
|
(46,394 |
) |
|
|
(61,159 |
) |
|
|
(15,021 |
) |
|
|
— |
|
|
(76,180 |
) |
|
Treatment costs |
|
429 |
|
|
|
429 |
|
|
|
457 |
|
|
|
457 |
|
|
|
1,345 |
|
|
|
1,345 |
|
|
|
1,723 |
|
|
|
1,731 |
|
|
|
— |
|
|
3,454 |
|
|
Change in product inventory |
|
420 |
|
|
|
420 |
|
|
|
(793 |
) |
|
|
(793 |
) |
|
|
(936 |
) |
|
|
(936 |
) |
|
|
(2,401 |
) |
|
|
(9,951 |
) |
|
|
— |
|
|
(12,352 |
) |
|
Reclamation and other costs |
|
(203 |
) |
|
|
(203 |
) |
|
|
(209 |
) |
|
|
(209 |
) |
|
|
(623 |
) |
|
|
(623 |
) |
|
|
(632 |
) |
|
|
299 |
|
|
|
— |
|
|
(333 |
) |
|
Exclusion of Nevada Operations costs |
|
— |
|
|
|
— |
|
|
|
— |
|
|
|
— |
|
|
|
— |
|
|
|
— |
|
|
|
— |
|
|
|
|
|
— |
|
|
— |
|
|||
Cash Cost, Before By-product Credits (1) |
|
45,089 |
|
|
|
45,089 |
|
|
|
45,866 |
|
|
|
45,866 |
|
|
|
136,962 |
|
|
|
136,962 |
|
|
|
110,291 |
|
|
|
23,890 |
|
|
|
— |
|
|
134,181 |
|
|
Reclamation and other costs |
|
204 |
|
|
|
204 |
|
|
|
209 |
|
|
|
209 |
|
|
|
623 |
|
|
|
623 |
|
|
|
632 |
|
|
|
681 |
|
|
|
— |
|
|
1,313 |
|
|
Sustaining Exploration |
|
2,314 |
|
|
|
2,314 |
|
|
|
1,178 |
|
|
|
1,178 |
|
|
|
4,886 |
|
|
|
4,886 |
|
|
|
3,551 |
|
|
|
— |
|
|
|
— |
|
|
3,551 |
|
|
Sustaining capital |
|
10,457 |
|
|
|
10,457 |
|
|
|
7,597 |
|
|
|
7,597 |
|
|
|
25,587 |
|
|
|
25,587 |
|
|
|
21,030 |
|
|
|
195 |
|
|
|
— |
|
|
21,225 |
|
|
AISC, Before By-product Credits (1) |
|
58,064 |
|
|
|
58,064 |
|
|
|
54,850 |
|
|
|
54,850 |
|
|
|
168,058 |
|
|
|
168,058 |
|
|
|
135,504 |
|
|
|
24,766 |
|
|
|
— |
|
|
160,270 |
|
|
By-product credits: |
|
|
|
|
|
|
|
|
|
|
|
|
|
|
|
|
|
— |
|
|
|||||||||||||||||||
Silver |
$ |
(131 |
) |
|
|
(131 |
) |
|
$ |
(188 |
) |
|
|
(188 |
) |
|
|
(485 |
) |
|
|
(485 |
) |
|
|
(656 |
) |
|
|
(1,131 |
) |
|
|
— |
|
|
(1,787 |
) |
|
Total By-product credits |
|
(131 |
) |
|
|
(131 |
) |
|
|
(188 |
) |
|
|
(188 |
) |
|
|
(485 |
) |
|
|
(485 |
) |
|
|
(656 |
) |
|
|
(1,131 |
) |
|
|
— |
|
|
(1,787 |
) |
|
Cash Cost, After By-product Credits |
$ |
44,958 |
|
|
$ |
44,958 |
|
|
$ |
45,678 |
|
|
$ |
45,678 |
|
|
$ |
136,477 |
|
|
$ |
136,477 |
|
|
$ |
109,635 |
|
|
$ |
22,759 |
|
|
$ |
— |
|
$ |
132,394 |
|
|
AISC, After By-product Credits |
$ |
57,933 |
|
|
$ |
57,933 |
|
|
$ |
54,662 |
|
|
$ |
54,662 |
|
|
$ |
167,573 |
|
|
$ |
167,573 |
|
|
$ |
134,848 |
|
|
$ |
23,635 |
|
|
$ |
— |
|
$ |
158,483 |
|
|
Divided by gold ounces produced |
|
33 |
|
|
|
33 |
|
|
|
33 |
|
|
|
33 |
|
|
|
97 |
|
|
|
97 |
|
|
|
97 |
|
|
|
20 |
|
|
|
|
|
117 |
|
||
Cash Cost, Before By-product Credits, per Gold Ounce |
$ |
1,353 |
|
|
$ |
1,353 |
|
|
$ |
1,377 |
|
|
$ |
1,377 |
|
|
$ |
1,415 |
|
|
$ |
1,415 |
|
|
$ |
1,134 |
|
|
$ |
1,180 |
|
|
|
|
$ |
1,142 |
|
||
By-product credits per ounce |
|
(4 |
) |
|
|
(4 |
) |
|
|
(6 |
) |
|
|
(6 |
) |
|
|
(6 |
) |
|
|
(6 |
) |
|
|
(7 |
) |
|
|
(56 |
) |
|
|
|
|
(15 |
) |
||
Cash Cost, After By-product Credits, per Gold Ounce |
$ |
1,349 |
|
|
$ |
1,349 |
|
|
$ |
1,371 |
|
|
$ |
1,371 |
|
|
$ |
1,409 |
|
|
$ |
1,409 |
|
|
$ |
1,127 |
|
|
$ |
1,124 |
|
|
|
|
$ |
1,127 |
|
||
AISC, Before By-product Credits, per Gold Ounce |
$ |
1,742 |
|
|
$ |
1,742 |
|
|
$ |
1,647 |
|
|
$ |
1,647 |
|
|
$ |
1,735 |
|
|
$ |
1,735 |
|
|
$ |
1,394 |
|
|
$ |
1,223 |
|
|
|
|
$ |
1,364 |
|
||
By-product credits per ounce |
|
(4 |
) |
|
|
(4 |
) |
|
|
(6 |
) |
|
|
(6 |
) |
|
|
(6 |
) |
|
|
(6 |
) |
|
|
(7 |
) |
|
|
(56 |
) |
|
|
|
|
(15 |
) |
||
AISC, After By-product Credits, per Gold Ounce |
$ |
1,738 |
|
|
$ |
1,738 |
|
|
$ |
1,641 |
|
|
$ |
1,641 |
|
|
$ |
1,729 |
|
|
$ |
1,729 |
|
|
$ |
1,387 |
|
|
$ |
1,167 |
|
|
|
|
$ |
1,349 |
|
||
Reconciliation of Cost of Sales to Non-GAAP Measures, continued |
||||||||||||||||||||||||||||||||||||||||||||||||
In thousands (except per ounce amounts) |
Three Months Ended |
|
Three Months Ended |
|
Nine Months Ended |
|
Nine Months Ended |
|||||||||||||||||||||||||||||||||||||||||
|
Total Silver |
|
Total Gold |
|
Total |
|
Total Silver |
|
Total Gold |
|
Total |
|
Total Silver |
|
Total Gold |
|
Total |
|
Total Silver |
|
Total Gold |
|
Total |
|||||||||||||||||||||||||
Total cost of sales |
$ |
76,666 |
|
|
$ |
59,532 |
|
|
$ |
136,198 |
|
|
$ |
90,854 |
|
|
$ |
61,870 |
|
|
$ |
152,724 |
|
|
$ |
246,423 |
|
|
$ |
183,570 |
|
|
$ |
429,993 |
|
|
$ |
238,243 |
|
|
$ |
219,592 |
|
|
$ |
457,835 |
|
|
Depreciation, depletion and amortization |
|
(17,566 |
) |
|
|
(15,089 |
) |
|
|
(32,655 |
) |
|
|
(22,491 |
) |
|
|
(15,459 |
) |
|
|
(37,950 |
) |
|
|
(59,509 |
) |
|
|
(46,394 |
) |
|
|
(105,903 |
) |
|
|
(62,738 |
) |
|
|
(76,180 |
) |
|
|
(138,918 |
) |
|
Treatment costs |
|
14,268 |
|
|
|
429 |
|
|
|
14,697 |
|
|
|
13,581 |
|
|
|
457 |
|
|
|
14,038 |
|
|
|
40,640 |
|
|
|
1,345 |
|
|
|
41,985 |
|
|
|
40,531 |
|
|
|
3,454 |
|
|
|
43,985 |
|
|
Change in product inventory |
|
7,486 |
|
|
|
420 |
|
|
|
7,906 |
|
|
|
(599 |
) |
|
|
(793 |
) |
|
|
(1,392 |
) |
|
|
12,519 |
|
|
|
(936 |
) |
|
|
11,583 |
|
|
|
(1,913 |
) |
|
|
(12,352 |
) |
|
|
(14,265 |
) |
|
Reclamation and other costs |
|
(270 |
) |
|
|
(203 |
) |
|
|
(473 |
) |
|
|
(1,261 |
) |
|
|
(209 |
) |
|
|
(1,470 |
) |
|
|
(2,757 |
) |
|
|
(623 |
) |
|
|
(3,380 |
) |
|
|
(2,712 |
) |
|
|
(333 |
) |
|
|
(3,045 |
) |
|
Cash Cost, Before By-product Credits (1) |
|
80,584 |
|
|
|
45,089 |
|
|
|
125,673 |
|
|
|
80,084 |
|
|
|
45,866 |
|
|
|
125,950 |
|
|
|
237,316 |
|
|
|
136,962 |
|
|
|
374,278 |
|
|
|
211,411 |
|
|
|
134,181 |
|
|
$ |
345,592 |
|
|
Reclamation and other costs |
|
987 |
|
|
|
204 |
|
|
|
1,191 |
|
|
|
987 |
|
|
|
209 |
|
|
|
1,196 |
|
|
|
2,961 |
|
|
|
623 |
|
|
|
3,584 |
|
|
|
3,335 |
|
|
|
1,313 |
|
|
|
4,648 |
|
|
Exploration |
|
4,498 |
|
|
|
2,314 |
|
|
|
6,812 |
|
|
|
1,698 |
|
|
|
1,178 |
|
|
|
2,876 |
|
|
|
7,077 |
|
|
|
4,886 |
|
|
|
11,963 |
|
|
|
5,254 |
|
|
|
3,551 |
|
|
|
8,805 |
|
|
Sustaining capital |
|
21,670 |
|
|
|
10,457 |
|
|
|
32,127 |
|
|
|
22,877 |
|
|
|
7,597 |
|
|
|
30,474 |
|
|
|
56,114 |
|
|
|
25,587 |
|
|
|
81,701 |
|
|
|
36,563 |
|
|
|
21,225 |
|
|
|
57,788 |
|
|
General and administrative |
|
11,003 |
|
|
|
— |
|
|
|
11,003 |
|
|
|
9,692 |
|
|
|
— |
|
|
|
9,692 |
|
|
|
28,989 |
|
|
|
— |
|
|
|
28,989 |
|
|
|
27,985 |
|
|
|
— |
|
|
|
27,985 |
|
|
AISC, Before By-product Credits (1) |
|
118,742 |
|
|
|
58,064 |
|
|
|
176,806 |
|
|
|
115,338 |
|
|
|
54,850 |
|
|
|
170,188 |
|
|
|
332,457 |
|
|
|
168,058 |
|
|
|
500,515 |
|
|
|
284,548 |
|
|
|
160,270 |
|
|
$ |
444,818 |
|
|
By-product credits: |
|
|
|
|
|
|
|
|
|
|
|
|
|
|
|
|
|
|
|
|
|
|
|
|||||||||||||||||||||||||
Zinc |
|
(33,399 |
) |
|
|
— |
|
|
|
(33,399 |
) |
|
|
(41,055 |
) |
|
|
— |
|
|
|
(41,055 |
) |
|
|
(109,081 |
) |
|
|
— |
|
|
|
(109,081 |
) |
|
|
(89,028 |
) |
|
|
— |
|
|
|
(89,028 |
) |
|
Gold |
|
(17,019 |
) |
|
|
— |
|
|
|
(17,019 |
) |
|
|
(20,364 |
) |
|
|
— |
|
|
|
(20,364 |
) |
|
|
(55,966 |
) |
|
|
— |
|
|
|
(55,966 |
) |
|
|
(56,299 |
) |
|
|
— |
|
|
|
(56,299 |
) |
|
Lead |
|
(18,008 |
) |
|
|
— |
|
|
|
(18,008 |
) |
|
|
(22,814 |
) |
|
|
— |
|
|
|
(22,814 |
) |
|
|
(60,624 |
) |
|
|
— |
|
|
|
(60,624 |
) |
|
|
(54,027 |
) |
|
|
— |
|
|
|
(54,027 |
) |
|
Silver |
|
— |
|
|
|
(131 |
) |
|
|
(131 |
) |
|
|
— |
|
|
|
(188 |
) |
|
|
(188 |
) |
|
|
— |
|
|
|
(485 |
) |
|
|
(485 |
) |
|
|
— |
|
|
|
(1,787 |
) |
|
|
(1,787 |
) |
|
Total By-product credits |
|
(68,426 |
) |
|
|
(131 |
) |
|
|
(68,557 |
) |
|
|
(84,233 |
) |
|
|
(188 |
) |
|
|
(84,421 |
) |
|
|
(225,671 |
) |
|
|
(485 |
) |
|
|
(226,156 |
) |
|
|
(199,354 |
) |
|
|
(1,787 |
) |
|
|
(201,141 |
) |
|
Cash Cost, After By-product Credits |
$ |
12,158 |
|
|
$ |
44,958 |
|
|
$ |
57,116 |
|
|
$ |
(4,149 |
) |
|
$ |
45,678 |
|
|
$ |
41,529 |
|
|
$ |
11,645 |
|
|
$ |
136,477 |
|
|
$ |
148,122 |
|
|
$ |
12,057 |
|
|
$ |
132,394 |
|
|
$ |
144,451 |
|
|
AISC, After By-product Credits |
$ |
50,316 |
|
|
$ |
57,933 |
|
|
$ |
108,249 |
|
|
$ |
31,105 |
|
|
$ |
54,662 |
|
|
$ |
85,767 |
|
|
$ |
106,786 |
|
|
$ |
167,573 |
|
|
$ |
274,359 |
|
|
$ |
85,194 |
|
|
$ |
158,483 |
|
|
$ |
243,677 |
|
|
Divided by ounces produced |
|
3,544 |
|
|
|
33 |
|
|
|
|
|
3,636 |
|
|
|
33 |
|
|
|
|
|
10,498 |
|
|
|
97 |
|
|
|
|
|
9,590 |
|
|
|
117 |
|
|
|
|||||||||
Cash Cost, Before By-product Credits, per Ounce |
$ |
22.74 |
|
|
$ |
1,353 |
|
|
|
|
$ |
22.03 |
|
|
$ |
1,377 |
|
|
|
|
$ |
22.61 |
|
|
$ |
1,415 |
|
|
|
|
$ |
22.05 |
|
|
$ |
1,142 |
|
|
|
|||||||||
By-product credits per ounce |
|
(19.31 |
) |
|
|
(4 |
) |
|
|
|
|
(23.17 |
) |
|
|
(6 |
) |
|
|
|
|
(21.50 |
) |
|
|
(6 |
) |
|
|
|
|
(20.79 |
) |
|
|
(15 |
) |
|
|
|||||||||
Cash Cost, After By-product Credits, per Ounce |
$ |
3.43 |
|
|
$ |
1,349 |
|
|
|
|
$ |
(1.14 |
) |
|
$ |
1,371 |
|
|
|
|
$ |
1.11 |
|
|
$ |
1,409 |
|
|
|
|
$ |
1.26 |
|
|
$ |
1,127 |
|
|
|
|||||||||
AISC, Before By-product Credits, per Ounce |
$ |
33.51 |
|
|
$ |
1,742 |
|
|
|
|
$ |
31.72 |
|
|
$ |
1,647 |
|
|
|
|
$ |
31.67 |
|
|
$ |
1,735 |
|
|
|
|
$ |
29.67 |
|
|
$ |
1,364 |
|
|
|
|||||||||
By-product credits per ounce |
|
(19.31 |
) |
|
|
(4 |
) |
|
|
|
|
(23.17 |
) |
|
|
(6 |
) |
|
|
|
|
(21.50 |
) |
|
|
(6 |
) |
|
|
|
|
(20.79 |
) |
|
|
(15 |
) |
|
|
|||||||||
AISC, After By-product Credits, per Ounce |
$ |
14.20 |
|
|
$ |
1,738 |
|
|
|
|
$ |
8.55 |
|
|
$ |
1,641 |
|
|
|
|
$ |
10.17 |
|
|
$ |
1,729 |
|
|
|
|
$ |
8.88 |
|
|
$ |
1,349 |
|
|
|
|||||||||
Reconciliation of Cost of Sales to Non-GAAP Measures, continued |
|||||||||||||||||||||||||||||||||||||||||||||||
In thousands (except per ounce amounts) |
Three Months Ended |
|
Three Months Ended |
|
Three Months Ended |
|
|||||||||||||||||||||||||||||||||||||||||
|
Greens
|
|
Lucky
|
|
Other |
|
Total
|
|
Greens
|
|
Lucky
|
|
Other(3) |
|
Total
|
|
Greens
|
|
Lucky
|
|
Other(3) |
|
Total
|
|
|||||||||||||||||||||||
Total cost of sales |
$ |
49,638 |
|
|
$ |
29,264 |
|
|
|
— |
|
$ |
78,902 |
|
|
$ |
49,252 |
|
|
$ |
23,251 |
|
|
$ |
152 |
|
|
$ |
72,655 |
|
|
$ |
55,193 |
|
|
$ |
23,591 |
|
|
$ |
— |
|
$ |
78,784 |
|
|
|
Depreciation, depletion and amortization |
|
(11,420 |
) |
|
|
(8,032 |
) |
|
|
— |
|
|
(19,452 |
) |
|
|
(6,300 |
) |
|
|
(6,518 |
) |
|
|
(152 |
) |
|
|
(12,970 |
) |
|
|
(13,097 |
) |
|
|
(6,590 |
) |
|
|
— |
|
|
(19,687 |
) |
|
|
Treatment costs |
|
9,096 |
|
|
|
3,677 |
|
|
|
— |
|
|
12,773 |
|
|
|
8,655 |
|
|
|
3,636 |
|
|
|
— |
|
|
|
12,291 |
|
|
|
7,979 |
|
|
|
3,427 |
|
|
|
— |
|
|
11,406 |
|
|
|
Change in product inventory |
|
6,538 |
|
|
|
(905 |
) |
|
|
— |
|
|
5,633 |
|
|
|
236 |
|
|
|
1,351 |
|
|
|
— |
|
|
|
1,587 |
|
|
|
(122 |
) |
|
|
(68 |
) |
|
|
— |
|
|
(190 |
) |
|
|
Reclamation and other costs (5) |
|
(850 |
) |
|
|
(361 |
) |
|
|
— |
|
|
(1,211 |
) |
|
|
(1,689 |
) |
|
|
(199 |
) |
|
|
— |
|
|
|
(1,888 |
) |
|
|
(786 |
) |
|
|
(281 |
) |
|
|
— |
|
|
(1,067 |
) |
|
|
Cash Cost, Before By-product Credits (1) |
|
53,002 |
|
|
|
23,643 |
|
|
|
— |
|
|
76,645 |
|
|
|
50,154 |
|
|
|
21,521 |
|
|
|
— |
|
|
|
71,675 |
|
|
|
49,167 |
|
|
|
20,079 |
|
|
|
— |
|
|
69,246 |
|
|
|
Reclamation and other costs |
|
705 |
|
|
|
282 |
|
|
|
— |
|
|
987 |
|
|
|
847 |
|
|
|
264 |
|
|
|
— |
|
|
|
1,111 |
|
|
|
848 |
|
|
|
264 |
|
|
|
— |
|
|
1,112 |
|
|
|
Exploration |
|
165 |
|
|
|
— |
|
|
|
716 |
|
|
881 |
|
|
|
696 |
|
|
|
— |
|
|
|
867 |
|
|
|
1,563 |
|
|
|
2,472 |
|
|
|
— |
|
|
|
474 |
|
|
2,946 |
|
|
|
Sustaining capital |
|
5,956 |
|
|
|
5,562 |
|
|
|
48 |
|
|
11,566 |
|
|
|
10,123 |
|
|
|
7,413 |
|
|
|
172 |
|
|
|
17,708 |
|
|
|
6,228 |
|
|
|
8,406 |
|
|
|
— |
|
|
14,634 |
|
|
|
General and administrative (5) |
|
— |
|
|
|
— |
|
|
|
8,294 |
|
|
8,294 |
|
|
|
— |
|
|
|
— |
|
|
|
6,585 |
|
|
|
6,585 |
|
|
|
— |
|
|
|
— |
|
|
|
8,874 |
|
|
8,874 |
|
|
|
AISC, Before By-product Credits (1) |
|
59,828 |
|
|
|
29,487 |
|
|
|
9,058 |
|
|
98,373 |
|
|
|
61,820 |
|
|
|
29,198 |
|
|
|
7,624 |
|
|
|
98,642 |
|
|
|
58,715 |
|
|
|
28,749 |
|
|
|
9,348 |
|
|
96,812 |
|
|
|
By-product credits: |
|
|
|
|
|
|
|
|
|
|
|
|
|
|
|
|
|
|
|
|
|
|
|
|
|||||||||||||||||||||||
Zinc |
|
(28,651 |
) |
|
|
(5,977 |
) |
|
|
— |
|
|
(34,628 |
) |
|
|
(25,643 |
) |
|
|
(5,022 |
) |
|
|
|
|
(30,665 |
) |
|
|
(25,295 |
) |
|
|
(4,611 |
) |
|
|
|
|
(29,906 |
) |
|
||||
Gold |
|
(18,583 |
) |
|
|
— |
|
|
|
— |
|
|
(18,583 |
) |
|
|
(15,712 |
) |
|
|
— |
|
|
|
|
|
(15,712 |
) |
|
|
(14,864 |
) |
|
|
— |
|
|
|
|
|
(14,864 |
) |
|
||||
Lead |
|
(7,966 |
) |
|
|
(11,836 |
) |
|
|
— |
|
|
(19,802 |
) |
|
|
(7,657 |
) |
|
|
(12,204 |
) |
|
|
|
|
(19,861 |
) |
|
|
(7,640 |
) |
|
|
(10,188 |
) |
|
|
|
|
(17,828 |
) |
|
||||
Total By-product credits |
|
(55,200 |
) |
|
|
(17,813 |
) |
|
|
— |
|
|
(73,013 |
) |
|
|
(49,012 |
) |
|
|
(17,226 |
) |
|
|
— |
|
|
|
(66,238 |
) |
|
|
(47,799 |
) |
|
|
(14,799 |
) |
|
|
— |
|
|
(62,598 |
) |
|
|
Cash Cost, After By-product Credits |
$ |
(2,198 |
) |
|
$ |
5,830 |
|
|
$ |
— |
|
$ |
3,632 |
|
|
$ |
1,142 |
|
|
$ |
4,295 |
|
|
$ |
— |
|
|
$ |
5,437 |
|
|
$ |
1,368 |
|
|
$ |
5,280 |
|
|
$ |
— |
|
$ |
6,648 |
|
|
|
AISC, After By-product Credits |
$ |
4,628 |
|
|
$ |
11,674 |
|
|
$ |
9,058 |
|
$ |
25,360 |
|
|
$ |
12,808 |
|
|
$ |
11,972 |
|
|
$ |
7,624 |
|
|
$ |
32,404 |
|
$ |
10,916 |
|
|
$ |
13,950 |
|
|
$ |
9,348 |
|
$ |
34,214 |
|
|
||
Divided by ounces produced |
|
2,430 |
|
|
|
888 |
|
|
|
|
|
3,318 |
|
|
|
2,262 |
|
|
|
955 |
|
|
|
|
|
3,217 |
|
|
|
1,837 |
|
|
|
832 |
|
|
|
|
|
2,669 |
|
|
|||||
Cash Cost, Before By-product Credits, per Silver Ounce |
$ |
21.82 |
|
|
$ |
26.63 |
|
|
|
|
$ |
23.10 |
|
|
$ |
22.18 |
|
|
$ |
22.54 |
|
|
|
|
$ |
22.28 |
|
|
$ |
26.76 |
|
|
$ |
24.14 |
|
|
|
|
$ |
25.93 |
|
|
|||||
By-product credits per ounce |
|
(22.72 |
) |
|
|
(20.06 |
) |
|
|
|
|
(22.01 |
) |
|
|
(21.68 |
) |
|
|
(18.04 |
) |
|
|
|
|
(20.59 |
) |
|
|
(26.02 |
) |
|
|
(17.79 |
) |
|
|
|
|
(23.44 |
) |
|
|||||
Cash Cost, After By-product Credits, per Silver Ounce |
$ |
(0.90 |
) |
|
$ |
6.57 |
|
|
|
|
$ |
1.09 |
|
|
$ |
0.50 |
|
|
$ |
4.50 |
|
|
|
|
$ |
1.69 |
|
|
$ |
0.74 |
|
|
$ |
6.35 |
|
|
|
|
$ |
2.49 |
|
|
|||||
AISC, Before By-product Credits, per Silver Ounce |
$ |
24.62 |
|
$ |
33.21 |
|
|
|
|
$ |
29.65 |
|
|
$ |
27.34 |
|
|
$ |
30.58 |
|
|
|
|
$ |
30.67 |
|
|
$ |
31.96 |
|
|
$ |
34.58 |
|
|
|
|
$ |
36.26 |
|
|
||||||
By-product credits per ounce |
|
(22.72 |
) |
|
|
(20.06 |
) |
|
|
|
|
(22.01 |
) |
|
|
(21.68 |
) |
|
|
(18.04 |
) |
|
|
|
|
(20.59 |
) |
|
|
(26.02 |
) |
|
|
(17.79 |
) |
|
|
|
|
(23.44 |
) |
|
|||||
AISC, After By-product Credits, per Silver Ounce |
$ |
1.90 |
|
|
$ |
13.15 |
|
|
|
|
$ |
7.64 |
|
|
$ |
5.66 |
|
|
$ |
12.54 |
|
|
|
|
$ |
10.08 |
|
|
$ |
5.94 |
|
|
$ |
16.79 |
|
|
|
|
$ |
12.82 |
|
|
|||||
Reconciliation of Cost of Sales to Non-GAAP Measures, continued |
||||||||||||||||||||||||||||||||||
In thousands (except per ounce amounts) |
Three Months Ended March 31, 2022 |
|
Three Months Ended December 31, 2021 |
|
Three Months Ended September 30, 2021 |
|||||||||||||||||||||||||||||
|
|
|
Total Gold |
|
|
|
Nevada Operations(4) |
|
Total Gold |
|
|
|
Nevada Operations(4) |
|
Corporate(3) |
|
Total Gold |
|||||||||||||||||
Total cost of sales |
$ |
62,168 |
|
|
$ |
62,168 |
|
|
$ |
57,069 |
|
|
$ |
2,113 |
|
|
$ |
59,182 |
|
|
$ |
58,164 |
|
|
$ |
21,384 |
|
|
|
|
$ |
79,548 |
|
|
Depreciation, depletion and amortization |
|
(15,846 |
) |
|
|
(15,846 |
) |
|
|
(19,585 |
) |
|
|
(320 |
) |
|
|
(19,905 |
) |
|
|
(19,968 |
) |
|
|
(6,135 |
) |
|
|
|
|
(26,103 |
) |
|
Treatment costs |
|
458 |
|
|
|
458 |
|
|
|
423 |
|
|
|
— |
|
|
|
423 |
|
|
|
475 |
|
|
|
1 |
|
|
|
|
|
476 |
|
|
Change in product inventory |
|
(563 |
) |
|
|
(563 |
) |
|
|
4,839 |
|
|
|
(956 |
) |
|
|
3,883 |
|
|
|
(3,369 |
) |
|
|
(12,389 |
) |
|
|
|
|
(15,758 |
) |
|
Reclamation and other costs (5) |
|
(210 |
) |
|
|
(210 |
) |
|
|
(208 |
) |
|
|
1 |
|
|
|
(207 |
) |
|
|
(210 |
) |
|
|
— |
|
|
|
|
|
(210 |
) |
|
Cash Cost, Before By-product Credits (1) |
|
46,007 |
|
|
|
46,007 |
|
|
|
42,538 |
|
|
|
838 |
|
|
|
43,376 |
|
|
|
35,092 |
|
|
|
2,861 |
|
|
|
|
|
37,953 |
|
|
Reclamation and other costs |
|
210 |
|
|
|
210 |
|
|
|
209 |
|
|
|
327 |
|
|
|
536 |
|
|
|
209 |
|
|
|
327 |
|
|
|
|
|
536 |
|
|
Exploration |
|
1,394 |
|
|
|
1,394 |
|
|
|
1,775 |
|
|
|
— |
|
|
|
1,775 |
|
|
|
1,541 |
|
|
|
— |
|
|
|
|
|
1,541 |
|
|
Sustaining capital |
|
7,281 |
|
|
|
7,281 |
|
|
|
10,459 |
|
|
|
316 |
|
|
|
10,775 |
|
|
|
7,208 |
|
|
|
29 |
|
|
|
|
|
7,237 |
|
|
AISC, Before By-product Credits (1) |
|
54,892 |
|
|
|
54,892 |
|
|
|
54,981 |
|
|
|
1,481 |
|
|
|
56,462 |
|
|
|
44,050 |
|
|
|
3,217 |
|
|
|
|
|
47,267 |
|
|
By-product credits: |
|
|
|
|
|
|
|
|
|
|
|
|
|
|
|
|
|
|||||||||||||||||
Silver |
|
(166 |
) |
|
|
(166 |
) |
|
|
(183 |
) |
|
|
(21 |
) |
|
|
(204 |
) |
|
|
(169 |
) |
|
|
(6 |
) |
|
|
|
|
(175 |
) |
|
Total By-product credits |
$ |
(166 |
) |
|
$ |
(166 |
) |
|
|
(183 |
) |
|
|
(21 |
) |
|
|
(204 |
) |
|
|
(169 |
) |
|
|
(6 |
) |
|
|
|
|
(175 |
) |
|
Cash Cost, After By-product Credits |
$ |
45,841 |
|
|
$ |
45,841 |
|
|
$ |
42,355 |
|
|
$ |
817 |
|
|
$ |
43,172 |
|
|
$ |
34,923 |
|
|
$ |
2,855 |
|
|
|
|
$ |
37,778 |
|
|
AISC, After By-product Credits |
$ |
54,726 |
|
|
$ |
54,726 |
|
|
$ |
54,798 |
|
|
$ |
1,460 |
|
|
$ |
56,258 |
|
|
$ |
43,881 |
|
|
$ |
3,211 |
|
|
|
|
$ |
47,092 |
|
|
Divided by gold ounces produced |
|
30 |
|
|
|
30 |
|
|
|
37 |
|
|
|
— |
|
|
|
37 |
|
|
|
30 |
|
|
|
3 |
|
|
|
|
|
33 |
|
|
Cash Cost, Before By-product Credits, per Gold Ounce |
$ |
1,521 |
|
|
$ |
1,521 |
|
|
$ |
1,142 |
|
|
$ |
1,737 |
|
|
$ |
1,148 |
|
|
$ |
1,181 |
|
|
$ |
1,040 |
|
|
|
|
$ |
1,168 |
|
|
By-product credits per ounce |
|
(5 |
) |
|
|
(5 |
) |
|
|
(5 |
) |
|
|
(44 |
) |
|
|
(5 |
) |
|
|
(6 |
) |
|
|
(2 |
) |
|
|
|
|
(5 |
) |
|
Cash Cost, After By-product Credits, per Gold Ounce |
$ |
1,516 |
|
|
$ |
1,516 |
|
|
$ |
1,137 |
|
|
$ |
1,693 |
|
|
$ |
1,143 |
|
|
$ |
1,175 |
|
|
$ |
1,038 |
|
|
|
|
$ |
1,163 |
|
|
AISC, Before By-product Credits, per Gold Ounce |
$ |
1,815 |
|
|
$ |
1,815 |
|
|
$ |
1,475 |
|
|
$ |
3,073 |
|
|
$ |
1,499 |
|
|
$ |
1,482 |
|
|
$ |
1,169 |
|
|
|
|
$ |
1,455 |
|
|
By-product credits per ounce |
|
(5 |
) |
|
|
(5 |
) |
|
|
(5 |
) |
|
|
(44 |
) |
|
|
(5 |
) |
|
|
(6 |
) |
|
|
(2 |
) |
|
|
|
|
(5 |
) |
|
AISC, After By-product Credits, per Gold Ounce |
$ |
1,810 |
|
|
$ |
1,810 |
|
|
$ |
1,470 |
|
|
$ |
3,029 |
|
|
$ |
1,494 |
|
|
$ |
1,476 |
|
|
$ |
1,167 |
|
|
|
|
$ |
1,450 |
|
|
Reconciliation of Cost of Sales to Non-GAAP Measures, continued |
||||||||||||||||||||||||||||||||||||||
In thousands (except per ounce amounts) |
Three Months Ended March 31, 2022 |
|
Three Months Ended December 31, 2021 |
|
Three Months Ended September 30, 2021 |
|||||||||||||||||||||||||||||||||
|
Total Silver |
|
Total Gold |
|
Total |
|
Total Silver |
|
Total Gold |
|
Total |
|
Total Silver |
|
Total Gold |
|
Corporate(3) |
|
Total |
|||||||||||||||||||
Cost of sales and other direct production costs and depreciation, depletion and amortization |
$ |
78,902 |
|
|
$ |
62,168 |
|
|
$ |
141,070 |
|
|
$ |
72,655 |
|
|
$ |
59,182 |
|
|
$ |
131,837 |
|
|
$ |
78,784 |
|
|
$ |
79,548 |
|
|
|
|
$ |
158,332 |
|
|
Depreciation, depletion and amortization |
|
(19,452 |
) |
|
|
(15,846 |
) |
|
|
(35,298 |
) |
|
|
(12,970 |
) |
|
|
(19,905 |
) |
|
|
(32,875 |
) |
|
|
(19,687 |
) |
|
|
(26,103 |
) |
|
|
|
|
(45,790 |
) |
|
Treatment costs |
|
12,773 |
|
|
|
458 |
|
|
|
13,231 |
|
|
|
12,291 |
|
|
|
423 |
|
|
|
12,714 |
|
|
|
11,406 |
|
|
|
476 |
|
|
|
|
|
11,882 |
|
|
Change in product inventory |
|
5,633 |
|
|
|
(563 |
) |
|
|
5,070 |
|
|
|
1,587 |
|
|
|
3,883 |
|
|
|
5,470 |
|
|
|
(190 |
) |
|
|
(15,758 |
) |
|
|
|
|
(15,948 |
) |
|
Reclamation and other costs |
|
(1,211 |
) |
|
|
(210 |
) |
|
|
(1,421 |
) |
|
|
(1,888 |
) |
|
|
(207 |
) |
|
|
(2,095 |
) |
|
|
(1,067 |
) |
|
|
(210 |
) |
|
|
|
|
(1,277 |
) |
|
Cash Cost, Before By-product Credits (1) |
|
76,645 |
|
|
|
46,007 |
|
|
|
122,652 |
|
|
|
71,675 |
|
|
|
43,376 |
|
|
|
115,051 |
|
|
|
69,246 |
|
|
|
37,953 |
|
|
|
|
|
107,199 |
|
|
Reclamation and other costs |
|
987 |
|
|
|
210 |
|
|
|
1,197 |
|
|
|
1,111 |
|
|
|
536 |
|
|
|
1,647 |
|
|
|
1,112 |
|
|
|
536 |
|
|
|
|
|
1,648 |
|
|
Exploration |
|
881 |
|
|
|
1,394 |
|
|
|
2,275 |
|
|
|
1,563 |
|
|
|
1,775 |
|
|
|
3,338 |
|
|
|
2,946 |
|
|
|
1,541 |
|
|
|
|
|
4,487 |
|
|
Sustaining capital |
|
11,566 |
|
|
|
7,281 |
|
|
|
18,847 |
|
|
|
17,708 |
|
|
|
10,775 |
|
|
|
28,483 |
|
|
|
14,634 |
|
|
|
7,237 |
|
|
|
|
|
21,871 |
|
|
General and administrative |
|
8,294 |
|
|
|
— |
|
|
|
8,294 |
|
|
|
6,585 |
|
|
|
— |
|
|
|
6,585 |
|
|
|
8,874 |
|
|
|
— |
|
|
|
|
|
8,874 |
|
|
AISC, Before By-product Credits (1) |
|
98,373 |
|
|
|
54,892 |
|
|
|
153,265 |
|
|
|
98,642 |
|
|
|
56,462 |
|
|
|
155,104 |
|
|
|
96,812 |
|
|
|
47,267 |
|
|
|
|
|
144,079 |
|
|
By-product credits: |
|
|
|
|
|
|
|
|
|
|
|
|
|
|
|
|
|
|
|
|||||||||||||||||||
Zinc |
|
(34,628 |
) |
|
|
— |
|
|
|
(34,628 |
) |
|
|
(30,665 |
) |
|
|
— |
|
|
|
(30,665 |
) |
|
|
(29,906 |
) |
|
|
— |
|
|
|
|
|
(29,906 |
) |
|
Gold |
|
(18,583 |
) |
|
|
— |
|
|
|
(18,583 |
) |
|
|
(15,712 |
) |
|
|
— |
|
|
|
(15,712 |
) |
|
|
(14,864 |
) |
|
|
— |
|
|
|
|
|
(14,864 |
) |
|
Lead |
|
(19,802 |
) |
|
|
— |
|
|
|
(19,802 |
) |
|
|
(19,861 |
) |
|
|
— |
|
|
|
(19,861 |
) |
|
|
(17,828 |
) |
|
|
— |
|
|
|
|
|
(17,828 |
) |
|
Silver |
|
— |
|
|
|
(166 |
) |
|
|
(166 |
) |
|
|
— |
|
|
|
(204 |
) |
|
|
(204 |
) |
|
|
— |
|
|
|
(175 |
) |
|
|
|
|
(175 |
) |
|
Total By-product credits |
|
(73,013 |
) |
|
|
(166 |
) |
|
|
(73,179 |
) |
|
|
(66,238 |
) |
|
|
(204 |
) |
|
|
(66,442 |
) |
|
|
(62,598 |
) |
|
|
(175 |
) |
|
|
|
|
(62,773 |
) |
|
Cash Cost, After By-product Credits |
$ |
3,632 |
|
|
$ |
45,841 |
|
|
$ |
49,473 |
|
|
$ |
5,437 |
|
|
$ |
43,172 |
|
|
$ |
48,609 |
|
|
$ |
6,648 |
|
|
$ |
37,778 |
|
|
|
|
$ |
44,426 |
|
|
AISC, After By-product Credits |
$ |
25,360 |
|
|
$ |
54,726 |
|
|
$ |
80,086 |
|
|
$ |
32,404 |
|
|
$ |
56,258 |
|
|
$ |
88,662 |
|
|
$ |
34,214 |
|
|
$ |
47,092 |
|
|
|
|
$ |
81,306 |
|
|
Divided by ounces produced |
|
3,318 |
|
|
|
30 |
|
|
|
|
|
3,217 |
|
|
|
37 |
|
|
|
|
|
2,669 |
|
|
|
33 |
|
|
|
|
|
|||||||
Cash Cost, Before By-product Credits, per Ounce |
$ |
23.10 |
|
|
$ |
1,521 |
|
|
|
|
$ |
22.28 |
|
|
$ |
1,148 |
|
|
|
|
$ |
25.93 |
|
|
|
1,168 |
|
|
|
|
|
|||||||
By-product credits per ounce |
|
(22.01 |
) |
|
|
(5 |
) |
|
|
|
|
(20.59 |
) |
|
|
(5 |
) |
|
|
|
|
(23.44 |
) |
|
|
(5 |
) |
|
|
|
|
|||||||
Cash Cost, After By-product Credits, per Ounce |
$ |
1.09 |
|
|
$ |
1,516 |
|
|
|
|
$ |
1.69 |
|
|
$ |
1,143 |
|
|
|
|
$ |
2.49 |
|
|
$ |
1,163 |
|
|
|
|
|
|||||||
AISC, Before By-product Credits, per Ounce |
$ |
29.65 |
|
|
$ |
1,815 |
|
|
|
|
$ |
30.67 |
|
|
$ |
1,499 |
|
|
|
|
$ |
36.26 |
|
|
$ |
1,455 |
|
|
|
|
|
|||||||
By-product credits per ounce |
|
(22.01 |
) |
|
|
(5 |
) |
|
|
|
|
(20.59 |
) |
|
|
(5 |
) |
|
|
|
|
(23.44 |
) |
|
|
(5 |
) |
|
|
|
|
|||||||
AISC, After By-product Credits, per Ounce |
$ |
7.64 |
|
|
$ |
1,810 |
|
|
|
|
$ |
10.08 |
|
|
$ |
1,494 |
|
|
|
|
$ |
12.82 |
|
|
$ |
1,450 |
|
|
|
|
|
|||||||
- Includes all direct and indirect operating costs related to the physical activities of producing metals, including mining, processing and other plant costs, third-party refining and marketing expense, on-site general and administrative costs, royalties, before by-product revenues earned from all metals other than the primary metal produced at each unit. AISC, Before By-product Credits also includes on-site exploration, reclamation, and sustaining capital costs.
-
Mining at
San Sebastian was completed in the third quarter of 2020, and milling was completed in the fourth quarter of 2020. Care and maintenance costs atSan Sebastian totaling$1.5 million and$2.0 million for the first nine months of 2022 and 2021 are reported in a separate line item on our consolidated statements of operations and excluded from the calculations of cost of sales and other direct production costs and depreciation, depletion and amortization, Cash Cost, Before By-product Credits, Cash Cost, After By-product Credits, AISC, Before By-product Credits, and AISC, After By-product Credits. - AISC, Before By-product Credits for our consolidated silver properties includes corporate costs for general and administrative expense, exploration and sustaining capital.
-
Production was suspended at the
Hollister and Midas mines and Aurora mill in the latter part of 2019. Care and maintenance at Nevada Operations totaling$4.2 million and$6.3 million for the third quarter of 2022 and 2021, respectively, ($14.6 million and$15.0 million for the first nine months of 2022 and 2021) are reported in a separate line item on our consolidated statements of operations and excluded from the calculations of cost of sales and other direct production costs and depreciation, depletion and amortization, Cash Cost, Before By-product Credits, Cash Cost, After By-product Credits, AISC, Before By-product Credits, and AISC, After By-product Credits.
Reconciliation of Net (Loss) Income Applicable to Common Stockholders (GAAP) to Adjusted Net (Loss) Income Applicable to Common Stockholders (non-GAAP)
This release refers to a non-GAAP measure of adjusted net income (loss) applicable to common stockholders and adjusted net income (loss) per share, which are indicators of our performance. They exclude certain impacts which are of a nature which we believe are not reflective of our underlying performance. Management believes that adjusted net income (loss) per common share provides investors with the ability to better evaluate our underlying operating performance.
Dollars are in thousands |
Q3 -2022 |
|
Q2 -2022 |
|
Q1-2022 |
|
Q4 -2021 |
|
Q3 -2021 |
|
YTD - 2022 |
|
YTD-2021 |
|||||||||||||||
Net (loss) income applicable to common stockholders (GAAP) |
|
(23,664 |
) |
|
|
(13,661 |
) |
|
$ |
4,015 |
|
|
|
11,737 |
|
|
|
(1,117 |
) |
|
$ |
(33,310 |
) |
|
|
22,806 |
|
|
Adjusted for items below: |
|
|
|
|
|
|
|
|
|
|
|
— |
|
|
|
|||||||||||||
Derivative contracts losses (gains) |
|
(873 |
) |
|
|
689 |
|
|
|
204 |
|
|
|
25,840 |
|
|
|
(16,053 |
) |
|
|
20 |
|
|
|
(13,937 |
) |
|
Provisional pricing losses (gains) |
|
6,625 |
|
|
|
15,807 |
|
|
|
(968 |
) |
|
|
(5,648 |
) |
|
|
(72 |
) |
|
|
21,464 |
|
|
|
(3,701 |
) |
|
Unrealized losses (gains) on equity investments |
|
5,110 |
|
|
|
15,739 |
|
|
|
(6,100 |
) |
|
|
(2,822 |
) |
|
|
2,861 |
|
|
|
14,749 |
|
|
|
5,959 |
|
|
Environmental accruals |
|
|
|
— |
|
|
|
14 |
|
|
|
— |
|
|
|
— |
|
|
|
14 |
|
|
|
2,882 |
|
|||
Foreign exchange (gain) loss |
|
(5,667 |
) |
|
|
(4,482 |
) |
|
|
2,038 |
|
|
|
(393 |
) |
|
|
(3,995 |
) |
|
|
(8,111 |
) |
|
|
(24 |
) |
|
Care and maintenance costs |
|
5,092 |
|
|
|
5,242 |
|
|
|
6,205 |
|
|
|
5,998 |
|
|
|
6,910 |
|
|
|
16,539 |
|
|
|
17,014 |
|
|
Loss (gain)on disposition of properties, plants, equipment and mineral interests |
|
19 |
|
|
|
5 |
|
|
|
(8 |
) |
|
|
326 |
|
|
|
(390 |
) |
|
|
16 |
|
|
|
(239 |
) |
|
Adjustments of inventory to net realizable value |
|
1,405 |
|
|
|
754 |
|
|
|
— |
|
|
|
— |
|
|
|
93 |
|
|
|
2,159 |
|
|
|
6,524 |
|
|
Adjusted income (loss) applicable to common stockholders |
$ |
(11,953 |
) |
|
$ |
20,093 |
|
|
$ |
5,400 |
|
|
$ |
35,038 |
|
|
$ |
(11,763 |
) |
|
$ |
13,540 |
|
|
$ |
37,284 |
|
|
Weighted average shares - basic |
|
554,531 |
|
|
|
539,401 |
|
|
|
538,490 |
|
|
|
538,124 |
|
|
|
536,966 |
|
|
|
544,000 |
|
|
|
535,542 |
|
|
Weighted average shares - diluted |
|
554,531 |
|
|
|
539,401 |
|
|
|
544,061 |
|
|
|
543,134 |
|
|
|
536,966 |
|
|
|
544,000 |
|
|
|
541,769 |
|
|
Basic adjusted net income (loss) per common stock (in cents) |
|
(0.02 |
) |
|
|
0.04 |
|
|
|
0.01 |
|
|
|
0.07 |
|
|
|
(0.02 |
) |
|
|
0.02 |
|
|
|
0.07 |
|
|
Diluted adjusted net income (loss) per common stock (in cents) |
|
(0.02 |
) |
|
|
0.04 |
|
|
|
0.01 |
|
|
|
0.06 |
|
|
|
(0.02 |
) |
|
|
0.02 |
|
|
|
0.07 |
|
|
Reconciliation of Net Income (Loss) (GAAP) and Debt (GAAP) to Adjusted EBITDA (non-GAAP) and Net Debt (non-GAAP)
This release refers to the non-GAAP measures of adjusted earnings before interest, taxes, depreciation and amortization ("Adjusted EBITDA"), which is a measure of our operating performance, and net debt to adjusted EBITDA for the last 12 months (or "LTM adjusted EBITDA"), which is a measure of our ability to service our debt. Adjusted EBITDA is calculated as net income (loss) before the following items: interest expense, income tax provision, depreciation, depletion, and amortization expense, acquisition costs, foreign exchange gains and losses, gains and losses on derivative contracts, ramp-up and suspension costs, provisional price gains and losses, stock-based compensation, unrealized losses and gains on investments, provisions for closed operations, and interest and other income (expense). Net debt is calculated as total debt, which consists of the liability balances for our Senior Notes, revolving credit facility and finance leases, less the total of our cash and cash equivalents. Management believes that, when presented in conjunction with comparable GAAP measures, Adjusted EBITDA and net debt to LTM adjusted EBITDA are useful to investors in evaluating our operating performance and ability to meet our debt obligations. The following table reconciles net loss and debt to Adjusted EBITDA and net debt:
Dollars are in thousands |
Q3 -2022 |
|
Q2 -2022 |
|
Q1-2022 |
|
Q4 -2021 |
|
Q3 -2021 |
|
LTM
|
|
FY 2021 |
|||||||||||||
Net income (loss) |
|
(23,526 |
) |
|
|
(13,523 |
) |
|
$ |
4,153 |
|
|
11,875 |
|
|
(979 |
) |
|
|
(21,021 |
) |
|
|
35,095 |
|
|
Interest expense |
|
10,874 |
|
|
|
10,505 |
|
|
|
10,406 |
|
|
10,461 |
|
|
10,469 |
|
|
|
42,246 |
|
|
|
41,945 |
|
|
Income and mining tax provision (benefit) |
|
(9,527 |
) |
|
|
254 |
|
|
|
5,631 |
|
|
(25,645 |
) |
|
(4,533 |
) |
|
|
(29,287 |
) |
|
|
(29,569 |
) |
|
Depreciation, depletion and amortization |
|
32,992 |
|
|
|
38,072 |
|
|
|
35,298 |
|
|
32,875 |
|
|
45,790 |
|
|
|
139,237 |
|
|
|
171,793 |
|
|
Foreign exchange (gain) loss |
|
(5,667 |
) |
|
|
(4,482 |
) |
|
|
2,038 |
|
|
(393 |
) |
|
(3,995 |
) |
|
|
(8,504 |
) |
|
|
(417 |
) |
|
Loss/(gain) on undesignated derivative contracts |
|
(873 |
) |
|
|
689 |
|
|
|
204 |
|
|
25,840 |
|
|
(16,053 |
) |
|
|
25,860 |
|
|
|
11,903 |
|
|
Care and maintenance costs |
|
5,092 |
|
|
|
5,242 |
|
|
|
6,205 |
|
|
5,998 |
|
|
6,910 |
|
|
|
22,537 |
|
|
|
23,012 |
|
|
Provisional price losses ( gains) |
|
6,625 |
|
|
|
15,807 |
|
|
|
(968 |
) |
|
(5,648 |
) |
|
(72 |
) |
|
|
15,816 |
|
|
|
(9,349 |
) |
|
Loss (gain) on disposition of properties, plants, equipment and mineral interests |
|
18 |
|
|
|
5 |
|
|
|
(8 |
) |
|
326 |
|
|
(390 |
) |
|
|
341 |
|
|
|
87 |
|
|
Stock-based compensation |
|
1,773 |
|
|
|
1,254 |
|
|
|
1,271 |
|
|
1,307 |
|
|
1,472 |
|
|
|
5,605 |
|
|
|
6,081 |
|
|
Provision for closed operations and environmental matters |
|
1,781 |
|
|
|
1,628 |
|
|
|
1,643 |
|
|
3,693 |
|
|
8,088 |
|
|
|
8,745 |
|
|
|
17,964 |
|
|
Unrealized loss (gain) on investments |
|
5,114 |
|
|
|
15,739 |
|
|
|
(6,100 |
) |
|
(2,822 |
) |
|
2,861 |
|
|
|
11,931 |
|
|
|
4,295 |
|
|
Adjustments of inventory to net realizable value |
|
1,405 |
|
|
|
754 |
|
|
|
— |
|
|
— |
|
|
93 |
|
|
|
2,159 |
|
|
|
6,524 |
|
|
Other |
|
473 |
|
|
|
(1,470 |
) |
|
|
(1,571 |
) |
|
382 |
|
|
(247 |
) |
|
|
(2,186 |
) |
|
|
(584 |
) |
|
Adjusted EBITDA |
$ |
26,554 |
|
|
$ |
70,474 |
|
|
$ |
58,202 |
|
|
58,249 |
|
|
49,414 |
|
|
$ |
213,479 |
|
|
$ |
278,780 |
|
|
Total debt |
|
|
|
|
|
|
|
|
|
|
|
551,841 |
|
|
$ |
521,483 |
|
|||||||||
Less: Cash and cash equivalents |
|
|
|
|
|
|
|
|
|
|
$ |
144,669 |
|
|
$ |
210,010 |
|
|||||||||
Net debt |
|
|
|
|
|
|
|
|
|
|
$ |
407,172 |
|
|
$ |
311,473 |
|
|||||||||
Net debt/LTM adjusted EBITDA (non-GAAP) |
|
|
|
|
|
|
|
|
|
|
|
1.9 |
|
|
|
1.1 |
|
|||||||||
Reconciliation of Cash Provided by Operating Activities (GAAP) to Free Cash Flow (non-GAAP)
This release refers to a non-GAAP measure of free cash flow, calculated as cash provided by operating activities, less additions to properties, plants, equipment and mineral interests. Management believes that, when presented in conjunction with comparable GAAP measures, free cash flow is useful to investors in evaluating our operating performance. The following table reconciles cash provided by operating activities to free cash flow:
Dollars are in thousands |
Three Months Ended
|
|
Nine Months Ended
|
|||||||||||||
|
2022 |
|
2021 |
|
2022 |
|
2021 |
|||||||||
Cash provided by operating activities |
$ |
(24,322 |
) |
|
$ |
42,742 |
|
|
$ |
53,770 |
|
|
$ |
166,982 |
|
|
Less: Additions to properties, plants equipment and mineral interests |
|
(37,430 |
) |
|
|
(26,899 |
) |
|
|
(93,237 |
) |
|
|
(80,210 |
) |
|
Free cash flow |
$ |
(61,752 |
) |
|
$ |
15,843 |
|
|
$ |
(39,467 |
) |
|
$ |
86,772 |
|
|
Table A - Assay Results - Q3 2022
|
||||||||||
Zone |
Drillhole
|
Drill Hole
|
Sample From
|
Sample To
|
Est. True
|
Silver
|
Gold
|
Zinc (%) |
Lead (%) |
Depth From
|
Coral-Wigwam |
K-22-0825 |
275/-73 |
1520.4 |
1533.6 |
7.3 |
101.5 |
0.00 |
0.1 |
0.1 |
-1291 |
Coral-Wigwam |
Including |
1525.6 |
1526.1 |
0.3 |
2522.1 |
0.00 |
0.7 |
0.3 |
-1303 |
|
Aurora, |
||||||||
Zone |
Drillhole
|
Drillhole
|
Sample From
|
Sample To
|
Est. True
|
Gold
|
Silver
|
Depth From
|
Martinez |
MAR-002 |
173 /-37 |
331.5 |
333.0 |
1.3 |
0.13 |
0.3 |
-184 |
Martinez |
MAR-002 |
173 /-37 |
353.1 |
360.0 |
6.0 |
0.22 |
1.1 |
-240 |
Martinez |
Including |
353.1 |
356.0 |
2.5 |
0.50 |
1.9 |
-240 |
|
Martinez |
MAR-002 |
173 /-37 |
396.2 |
408.8 |
7.2 |
0.05 |
0.2 |
-308 |
Martinez |
Including |
396.2 |
397.5 |
0.8 |
0.19 |
0.5 |
-308 |
|
Martinez |
MAR-002 |
173 /-37 |
416.8 |
454.2 |
31.1 |
0.40 |
1.8 |
-341 |
Martinez |
Including |
416.8 |
418.0 |
0.9 |
0.30 |
2.8 |
-341 |
|
Martinez |
Including |
423.1 |
433.5 |
6.7 |
1.26 |
4.4 |
-341 |
|
Martinez |
MAR-002 |
173 /-37 |
456.5 |
465.0 |
6.0 |
0.10 |
0.1 |
-364 |
Martinez |
Including |
463.5 |
465.0 |
1.1 |
0.43 |
0.4 |
-364 |
|
Martinez |
MAR-002 |
173 /-37 |
488.9 |
570.2 |
70.4 |
0.05 |
0.3 |
-436 |
Martinez |
Including |
491.3 |
498.0 |
5.8 |
0.12 |
0.6 |
-436 |
|
Martinez |
Including |
508.9 |
510.3 |
1.0 |
0.19 |
2.0 |
-436 |
|
Martinez |
Including |
518.7 |
523.1 |
3.8 |
0.17 |
0.7 |
-436 |
|
Martinez |
Including |
533.8 |
535.5 |
1.6 |
0.12 |
0.9 |
-436 |
|
|
CHE-001 |
350 /-62 |
14.0 |
26.4 |
12.2 |
0.73 |
7.7 |
-25 |
|
Including |
14.0 |
23.0 |
8.9 |
0.95 |
9.8 |
-25 |
|
|
CHE-001 |
350 /-62 |
28.3 |
29.5 |
1.2 |
0.15 |
2.4 |
-31 |
|
CHE-001 |
350 /-62 |
258.0 |
260.3 |
2.2 |
0.03 |
1.2 |
-231 |
|
CHE-002 |
13 /-39 |
163.5 |
163.9 |
0.4 |
0.13 |
0.3 |
-68 |
|
CHE-002 |
13 /-39 |
170.3 |
171.1 |
0.6 |
0.06 |
0.3 |
-69 |
|
CHE-002 |
13 /-39 |
176.4 |
177.5 |
0.8 |
0.26 |
1.4 |
-72 |
|
CHE-002 |
13 /-39 |
223.8 |
228.1 |
3.7 |
0.25 |
6.4 |
-95 |
|
Including |
224.8 |
226.9 |
1.8 |
0.50 |
12.4 |
-95 |
|
Juniata |
JUN-001 |
000 /-45 |
246.8 |
261.9 |
14.9 |
0.43 |
1.9 |
-180 |
Juniata |
Including |
249.7 |
257.8 |
8.0 |
0.76 |
3.5 |
-180 |
|
Republic, |
||||||||
Zone |
Drillhole
|
Drillhole
|
Sample From
|
Sample To
|
Est. True
|
Gold
|
Silver
|
Depth From
|
Bellicose |
BT2209 |
330/-45 |
518.6 |
523.3 |
3.3 |
0.07 |
0.3 |
-330 |
Blacktail |
BT2209 |
330/-45 |
627.0 |
650.0 |
13.2 |
0.06 |
0.5 |
-420 |
Apex |
BT2210 |
330/-45 |
36.4 |
53.7 |
12.0 |
0.08 |
0.4 |
-32 |
Anchor |
BT2210 |
330/-45 |
125.3 |
132.0 |
2.3 |
0.29 |
0.7 |
-70 |
1470 |
BT2216 |
330/-45 |
321.6 |
332.0 |
9.3 |
0.57 |
1.8 |
-250 |
1470 |
Including |
326.6 |
332.0 |
4.9 |
0.79 |
2.6 |
-253 |
|
1470 Splay |
BT2216 |
330/-45 |
350.0 |
353.0 |
2.1 |
1.18 |
4.3 |
-263 |
Tom Thumb |
TT2213 |
293/-45 |
610.1 |
619.6 |
8.6 |
0.37 |
2.3 |
-255 |
Tom Thumb |
Including |
610.1 |
614.6 |
4.1 |
0.72 |
4.3 |
-255 |
|
Tom Thumb |
TT2214 |
150/-75 |
1848.3 |
1852.5 |
3.6 |
0.34 |
2.7 |
-1800 |
Greens Creek, |
||||||||||
Zone |
Drillhole
|
Drill Hole
|
Sample From
|
Sample To
|
Est. True
|
Silver
|
Gold
|
Zinc (%) |
Lead (%) |
Depth From
|
Southwest Bench |
GC5758 |
63 / -46 |
221.0 |
224.0 |
2.7 |
35.2 |
0.14 |
10.2 |
6.4 |
-916 |
Southwest Bench |
GC5758 |
63 / -46 |
231.0 |
241.0 |
9.7 |
15.7 |
0.06 |
6.1 |
4.4 |
-932 |
Southwest Bench |
GC5762 |
73 / -11 |
144.0 |
159.0 |
14.9 |
40.9 |
0.35 |
7.0 |
2.9 |
-779 |
Southwest Bench |
GC5762 |
73 / -11 |
190.3 |
193.6 |
2.8 |
59.8 |
0.19 |
3.2 |
2.2 |
-785 |
Southwest Bench |
GC5762 |
73 / -11 |
308.5 |
310.5 |
1.9 |
27.3 |
0.07 |
9.0 |
6.0 |
-803 |
Southwest Bench |
GC5767 |
100 / 41 |
170.0 |
185.0 |
14.9 |
20.0 |
0.20 |
4.5 |
1.7 |
-628 |
Southwest Bench |
GC5771 |
91 / 20 |
199.0 |
201.5 |
2.4 |
12.8 |
0.04 |
2.3 |
1.3 |
-685 |
Southwest Bench |
GC5771 |
91 / 20 |
209.0 |
210.0 |
0.8 |
19.1 |
0.02 |
7.9 |
4.6 |
-681 |
Southwest Bench |
GC5787 |
112 / -38 |
103.6 |
124.7 |
10.5 |
74.3 |
0.52 |
5.7 |
2.9 |
-871 |
Southwest Bench |
GC5792 |
213 / -74 |
52.0 |
53.0 |
0.5 |
29.3 |
0.11 |
15.5 |
8.8 |
-815 |
Southwest Bench |
GC5793 |
63 / -71 |
94.5 |
96.0 |
1.4 |
11.5 |
0.04 |
6.2 |
2.6 |
-851 |
Southwest Bench |
GC5793 |
63 / -71 |
98.0 |
100.0 |
1.9 |
51.7 |
0.05 |
4.6 |
3.1 |
-856 |
Southwest Bench |
GC5793 |
63 / -71 |
107.0 |
113.0 |
5.4 |
16.3 |
0.09 |
10.3 |
7.4 |
-868 |
Southwest Bench |
GC5793 |
63 / -71 |
119.0 |
137.5 |
17.7 |
22.3 |
0.09 |
9.1 |
6.0 |
-891 |
Southwest Bench |
GC5797 |
63 / -51 |
125.4 |
131.5 |
4.8 |
18.1 |
0.06 |
5.1 |
3.0 |
-883 |
Southwest Bench |
GC5799 |
63 / -37 |
174.6 |
182.7 |
5.2 |
10.1 |
0.07 |
1.9 |
1.0 |
-872 |
Southwest Bench |
GC5801 |
63 / -26 |
218.5 |
219.5 |
1.0 |
11.7 |
0.03 |
12.4 |
7.2 |
-858 |
Southwest Bench |
GC5803 |
63 / -5 |
219.0 |
241.0 |
20.1 |
25.7 |
0.15 |
6.4 |
3.1 |
-785 |
Southwest Bench |
GC5806 |
63 / 25 |
128.6 |
138.9 |
8.8 |
6.3 |
0.08 |
2.2 |
1.1 |
-697 |
Southwest Bench |
GC5806 |
63 / 25 |
165.1 |
170.5 |
4.9 |
11.1 |
0.05 |
6.4 |
3.0 |
-684 |
Southwest Bench |
GC5806 |
63 / 25 |
189.6 |
198.0 |
8.0 |
11.9 |
0.06 |
1.8 |
1.1 |
-674 |
Southwest Bench |
GC5808 |
63 / 44 |
122.1 |
129.9 |
5.6 |
1.2 |
0.01 |
10.7 |
4.9 |
-660 |
Southwest Bench |
GC5808 |
63 / 44 |
168.0 |
186.0 |
13.3 |
23.4 |
0.14 |
7.5 |
3.4 |
-624 |
Southwest Bench |
GC5810 |
85 / 43 |
180.5 |
194.0 |
13.4 |
7.5 |
0.06 |
3.5 |
1.7 |
-620 |
Southwest Bench |
GC5813 |
83 / 27 |
166.5 |
175.0 |
8.5 |
23.4 |
0.11 |
2.1 |
1.0 |
-616 |
Southwest Bench |
GC5816 |
101 / 25 |
202.5 |
205.5 |
3.0 |
12.3 |
0.14 |
2.0 |
0.9 |
-670 |
Southwest Bench |
GC5817 |
22 / 36 |
245.0 |
250.0 |
4.9 |
11.7 |
0.02 |
0.8 |
0.4 |
-603 |
Southwest Bench |
GC5827 |
24 / -18 |
319.0 |
337.0 |
17.3 |
4.9 |
0.06 |
9.7 |
2.3 |
-857 |
Southwest Bench |
GC5827 |
24 / -18 |
346.0 |
351.7 |
5.6 |
43.0 |
0.08 |
1.7 |
0.8 |
-863 |
Southwest Bench |
GC5827 |
24 / -18 |
355.0 |
360.5 |
5.4 |
18.6 |
0.13 |
8.3 |
4.9 |
-864 |
Southwest Bench |
GC5827 |
24 / -18 |
413.0 |
414.0 |
1.0 |
12.8 |
0.03 |
6.8 |
2.8 |
-879 |
Southwest Bench |
GC5833 |
10 / -68 |
86.0 |
104.0 |
8.0 |
25.7 |
0.09 |
6.2 |
3.4 |
-855 |
Southwest Bench |
GC5833 |
10 / -68 |
152.5 |
165.5 |
9.5 |
21.9 |
0.11 |
6.2 |
3.2 |
-912 |
Southwest Bench |
GC5838 |
63 / -4 |
137.0 |
143.5 |
4.8 |
85.9 |
1.34 |
3.0 |
2.1 |
-737 |
Southwest Bench |
GC5841 |
85 / -22 |
129.0 |
140.0 |
10.6 |
15.4 |
0.05 |
7.7 |
4.9 |
-783 |
200 South |
GC5672 |
210 / -71 |
201.0 |
203.3 |
0.6 |
5.6 |
0.01 |
14.9 |
6.6 |
-1489 |
200 South |
GC5672 |
210 / -71 |
235.5 |
241.5 |
1.6 |
14.4 |
0.00 |
0.7 |
0.2 |
-1523 |
200 South |
GC5672 |
210 / -71 |
278.5 |
279.5 |
0.4 |
6.6 |
0.01 |
6.0 |
2.4 |
-1557 |
200 South |
GC5672 |
210 / -71 |
296.5 |
298.0 |
0.7 |
15.1 |
0.01 |
6.9 |
3.2 |
-1572 |
200 South |
GC5672 |
210 / -71 |
301.0 |
306.7 |
3.4 |
10.5 |
0.01 |
3.7 |
1.7 |
-1580 |
200 South |
GC5672 |
210 / -71 |
318.0 |
319.0 |
0.8 |
16.1 |
0.01 |
0.4 |
0.2 |
-1591 |
200 South |
GC5672 |
210 / -71 |
502.0 |
505.0 |
2.9 |
20.0 |
0.01 |
0.3 |
0.2 |
-1761 |
200 South |
GC5672 |
210 / -71 |
699.5 |
700.7 |
1.0 |
31.4 |
0.01 |
0.4 |
0.2 |
-1941 |
200 South |
GC5672 |
210 / -71 |
716.0 |
722.7 |
5.3 |
21.3 |
0.02 |
0.5 |
0.3 |
-1963 |
200 South |
GC5672 |
210 / -71 |
728.5 |
731.0 |
2.0 |
11.3 |
0.07 |
0.5 |
0.3 |
-1971 |
200 South |
GC5672 |
210 / -71 |
756.0 |
760.0 |
3.8 |
3.0 |
0.31 |
0.2 |
0.1 |
-1995 |
200 South |
GC5681 |
184 / -80 |
168.9 |
180.7 |
11.8 |
33.1 |
0.02 |
4.1 |
1.9 |
-1481 |
200 South |
GC5681 |
184 / -80 |
193.0 |
196.4 |
3.4 |
13.0 |
0.01 |
0.3 |
0.1 |
-1515 |
200 South |
GC5681 |
184 / -80 |
206.0 |
265.3 |
44.7 |
18.5 |
0.02 |
2.6 |
1.1 |
-1551 |
200 South |
GC5681 |
184 / -80 |
276.0 |
279.9 |
0.9 |
10.3 |
0.02 |
4.5 |
2.0 |
-1563 |
200 South |
GC5681 |
184 / -80 |
472.2 |
486.9 |
13.6 |
14.2 |
0.02 |
1.3 |
0.7 |
-1767 |
200 South |
GC5681 |
184 / -80 |
492.6 |
506.9 |
13.6 |
23.8 |
0.02 |
0.8 |
0.3 |
-1777 |
200 South |
GC5681 |
184 / -80 |
513.5 |
516.9 |
3.2 |
11.7 |
0.01 |
1.0 |
0.4 |
-1785 |
200 South |
GC5681 |
184 / -80 |
649.2 |
651.2 |
2.0 |
0.8 |
0.22 |
0.0 |
0.0 |
-1926 |
200 South |
GC5681 |
184 / -80 |
664.3 |
678.0 |
13.7 |
43.0 |
0.17 |
2.8 |
1.7 |
-1950 |
200 South |
GC5681 |
184 / -80 |
684.0 |
687.0 |
3.0 |
14.8 |
0.14 |
0.6 |
0.2 |
-1960 |
200 South |
GC5708 |
237 / -70 |
64.4 |
67.5 |
3.0 |
23.9 |
0.02 |
14.0 |
8.0 |
-1350 |
200 South |
GC5708 |
237 / -70 |
317.5 |
343.5 |
25.6 |
7.8 |
0.03 |
3.8 |
1.7 |
-1595 |
200 South |
GC5708 |
237 / -70 |
369.0 |
377.5 |
7.5 |
24.9 |
0.01 |
10.8 |
5.9 |
-1611 |
200 South |
GC5708 |
237 / -70 |
406.2 |
407.2 |
1.0 |
1.2 |
0.01 |
10.2 |
4.5 |
-1642 |
200 South |
GC5708 |
237 / -70 |
413.5 |
415.1 |
1.1 |
1.3 |
0.01 |
8.2 |
4.7 |
-1669 |
200 South |
GC5708 |
237 / -70 |
429.1 |
430.5 |
1.2 |
5.6 |
0.02 |
13.8 |
6.5 |
-1678 |
200 South |
GC5708 |
237 / -70 |
472.2 |
503.5 |
30.7 |
7.8 |
0.06 |
7.3 |
4.0 |
-1759 |
200 South |
GC5708 |
237 / -70 |
642.3 |
648.5 |
6.1 |
29.3 |
0.01 |
1.1 |
0.6 |
-1896 |
200 South |
GC5708 |
237 / -70 |
726.1 |
727.5 |
0.7 |
18.9 |
0.03 |
7.1 |
2.3 |
-1972 |
200 South |
GC5708 |
237 / -70 |
736.5 |
737.8 |
0.6 |
7.3 |
0.25 |
0.7 |
0.4 |
-1981 |
200 South |
GC5717 |
212 / -30 |
76.5 |
78.0 |
1.4 |
8.2 |
0.01 |
3.7 |
1.9 |
-1323 |
200 South |
GC5718 |
243 / -27 |
79.5 |
84.0 |
4.4 |
13.8 |
0.01 |
13.3 |
6.3 |
-1325 |
200 South |
GC5728 |
243 / -13 |
145.0 |
146.5 |
1.1 |
17.9 |
0.01 |
3.6 |
1.9 |
-1317 |
200 South |
GC5728 |
243 / -13 |
153.5 |
154.8 |
0.7 |
11.4 |
0.01 |
2.2 |
1.0 |
-1319 |
200 South |
GC5728 |
243 / -13 |
158.5 |
159.5 |
0.5 |
56.4 |
0.02 |
15.3 |
7.3 |
-1319 |
200 South |
GC5728 |
243 / -13 |
162.0 |
164.0 |
0.8 |
7.6 |
0.01 |
12.3 |
6.4 |
-1320 |
200 South |
GC5728 |
243 / -13 |
176.0 |
178.0 |
0.9 |
1.1 |
0.01 |
7.9 |
3.6 |
-1325 |
200 South |
GC5728 |
243 / -13 |
190.5 |
191.5 |
1.0 |
1.2 |
0.02 |
7.6 |
3.8 |
-1319 |
200 South |
GC5728 |
243 / -13 |
265.0 |
267.5 |
1.1 |
1.8 |
0.08 |
5.1 |
1.9 |
-1321 |
200 South |
GC5728 |
243 / -13 |
316.7 |
319.6 |
1.4 |
13.5 |
0.01 |
0.7 |
0.3 |
-1322 |
200 South |
GC5728 |
243 / -13 |
727.8 |
732.0 |
3.8 |
4.3 |
0.06 |
5.2 |
2.9 |
-1448 |
200 South |
GC5728 |
243 / -13 |
758.4 |
771.7 |
13.3 |
4.5 |
0.09 |
8.1 |
4.9 |
-1456 |
200 South |
GC5734 |
236 / -72 |
69.4 |
78.0 |
8.3 |
26.4 |
0.01 |
12.1 |
6.7 |
-1361 |
200 South |
GC5734 |
236 / -72 |
134.2 |
136.4 |
2.1 |
23.8 |
0.01 |
9.3 |
4.3 |
-1417 |
200 South |
GC5734 |
236 / -72 |
746.9 |
768.0 |
14.7 |
17.4 |
0.07 |
0.7 |
0.3 |
-2008 |
200 South |
GC5734 |
236 / -72 |
778.0 |
781.0 |
2.5 |
6.9 |
0.13 |
0.5 |
0.2 |
-2017 |
200 South |
GC5734 |
236 / -72 |
792.0 |
801.4 |
9.4 |
12.3 |
0.20 |
0.5 |
0.2 |
-2029 |
200 South |
GC5738 |
239 / -79 |
76.2 |
80.5 |
3.9 |
33.7 |
0.02 |
19.2 |
9.4 |
-1365 |
200 South |
GC5738 |
239 / -79 |
116.0 |
117.0 |
1.0 |
34.0 |
0.01 |
0.3 |
0.2 |
-1403 |
200 South |
GC5738 |
239 / -79 |
124.0 |
132.0 |
7.9 |
12.4 |
0.01 |
1.6 |
0.7 |
-1417 |
200 South |
GC5738 |
239 / -79 |
137.0 |
154.0 |
11.1 |
35.2 |
0.07 |
2.1 |
1.1 |
-1443 |
200 South |
GC5738 |
239 / -79 |
751.0 |
787.0 |
31.9 |
10.8 |
0.19 |
0.3 |
0.1 |
-2058 |
200 South |
GC5743 |
227 / -69 |
74.0 |
79.6 |
5.6 |
24.9 |
0.02 |
11.3 |
5.9 |
-1364 |
200 South |
GC5743 |
227 / -69 |
84.5 |
88.0 |
3.3 |
25.0 |
0.01 |
0.4 |
0.1 |
-1371 |
200 South |
GC5743 |
227 / -69 |
747.0 |
765.0 |
9.9 |
32.9 |
0.05 |
1.1 |
0.5 |
-1988 |
200 South |
GC5743 |
227 / -69 |
783.7 |
796.5 |
5.9 |
8.6 |
0.05 |
0.4 |
0.2 |
-2002 |
200 South |
GC5748 |
230 / -54 |
73.0 |
74.0 |
0.8 |
15.1 |
0.02 |
6.6 |
3.3 |
-1350 |
200 South |
GC5748 |
230 / -54 |
277.0 |
278.0 |
1.0 |
12.4 |
0.02 |
1.9 |
1.3 |
-1514 |
200 South |
GC5748 |
230 / -54 |
375.5 |
376.6 |
0.7 |
13.9 |
0.02 |
1.2 |
0.3 |
-1597 |
200 South |
GC5748 |
230 / -54 |
397.0 |
409.0 |
7.5 |
32.8 |
0.01 |
2.6 |
1.2 |
-1625 |
200 South |
GC5750 |
230 / -9 |
211.0 |
212.1 |
0.4 |
16.3 |
0.01 |
4.2 |
2.1 |
-1310 |
200 South |
GC5750 |
230 / -9 |
220.0 |
221.9 |
0.7 |
5.5 |
0.01 |
6.8 |
3.3 |
-1312 |
200 South |
GC5754 |
250 / -80 |
744.0 |
749.0 |
4.8 |
6.4 |
0.28 |
0.4 |
0.2 |
-2024 |
200 South |
GC5759 |
248 / -73 |
797.0 |
808.0 |
8.2 |
40.8 |
0.11 |
0.5 |
0.3 |
-2061 |
200 South |
GC5759 |
248 / -73 |
813.0 |
817.0 |
2.2 |
10.0 |
0.13 |
0.1 |
0.0 |
-2068 |
200 South |
GC5759 |
248 / -73 |
820.0 |
835.0 |
14.5 |
25.9 |
0.22 |
0.6 |
0.3 |
-2080 |
200 South |
GC5764 |
247 / -67 |
742.9 |
749.5 |
3.0 |
30.0 |
0.00 |
1.0 |
0.5 |
-1981 |
200 South |
GC5764 |
247 / -67 |
765.1 |
769.1 |
2.1 |
20.3 |
0.02 |
0.6 |
0.3 |
-1998 |
200 South |
GC5764 |
247 / -67 |
785.4 |
788.4 |
1.6 |
12.0 |
0.09 |
0.4 |
0.2 |
-2015 |
200 South |
GC5764 |
247 / -67 |
791.4 |
794.2 |
1.5 |
7.2 |
0.25 |
0.3 |
0.1 |
-2020 |
200 South |
GC5774 |
210 / -79 |
794.0 |
798.5 |
4.4 |
18.7 |
0.26 |
1.3 |
0.8 |
-2075 |
200 South |
GC5775 |
228 / -67 |
818.0 |
823.0 |
4.8 |
10.7 |
0.12 |
0.2 |
0.1 |
-2069 |
200 South |
GC5775 |
228 / -67 |
833.0 |
838.9 |
5.7 |
14.8 |
0.08 |
0.5 |
0.3 |
-2084 |
200 South |
GC5779 |
229 / -48 |
372.0 |
413.0 |
24.4 |
14.8 |
0.01 |
2.8 |
1.6 |
-1612 |
200 South |
GC5783 |
238 / -67 |
773.0 |
775.1 |
1.6 |
40.6 |
0.02 |
0.5 |
0.2 |
-2018 |
200 South |
GC5783 |
238 / -67 |
785.7 |
797.0 |
9.1 |
10.6 |
0.06 |
0.6 |
0.3 |
-2037 |
200 South |
GC5783 |
238 / -67 |
817.0 |
829.0 |
9.5 |
67.4 |
0.47 |
1.2 |
0.5 |
-2068 |
200 South |
GC5786 |
243 / -40 |
303.1 |
306.7 |
3.1 |
23.3 |
0.04 |
1.5 |
0.9 |
-1487 |
200 South |
GC5802 |
230 / -75 |
846.0 |
851.0 |
5.0 |
8.6 |
0.09 |
1.1 |
0.6 |
-2116 |
200 South |
GC5809 |
241 / -54 |
629.0 |
630.0 |
0.9 |
7.0 |
0.01 |
3.8 |
1.9 |
-1804 |
200 South |
GC5812 |
243 / -37 |
233.5 |
236.5 |
3.0 |
12.0 |
0.01 |
0.7 |
0.4 |
-1491 |
200 South |
GC5812 |
243 / -37 |
242.9 |
246.5 |
3.5 |
13.6 |
0.01 |
1.0 |
0.5 |
-1495 |
200 South |
GC5812 |
243 / -37 |
319.0 |
343.8 |
24.1 |
21.4 |
0.01 |
3.6 |
2.0 |
-1503 |
200 South |
GC5815 |
243 / -25 |
90.1 |
91.1 |
0.6 |
10.9 |
0.01 |
7.4 |
4.4 |
-1330 |
200 South |
GC5818 |
243 / 11 |
60.6 |
63.5 |
2.8 |
17.9 |
0.02 |
15.5 |
9.5 |
-1274 |
200 South |
GC5818 |
243 / 11 |
67.5 |
73.0 |
5.1 |
26.0 |
0.03 |
20.5 |
12.5 |
-1272 |
200 South |
GC5820 |
243 / 59 |
45.5 |
50.0 |
3.9 |
4.8 |
0.07 |
3.3 |
1.7 |
-1237 |
200 South |
GC5823 |
243 / 90 |
99.0 |
103.0 |
4.0 |
2.4 |
0.06 |
4.7 |
2.6 |
-1174 |
200 South |
GC5823 |
243 / 90 |
129.0 |
131.0 |
2.0 |
2.6 |
0.01 |
7.6 |
3.4 |
-1146 |
200 South |
GC5824 |
63 / 79 |
101.8 |
104.0 |
2.2 |
4.9 |
0.09 |
3.6 |
2.0 |
-1175 |
200 South |
GC5824 |
63 / 79 |
116.7 |
128.0 |
11.3 |
5.2 |
0.14 |
5.0 |
2.6 |
-1153 |
200 South |
GC5828 |
63 / 59 |
104.5 |
105.5 |
1.0 |
5.4 |
0.06 |
4.1 |
2.3 |
-1190 |
200 South |
GC5828 |
63 / 59 |
141.5 |
142.5 |
0.9 |
17.5 |
0.02 |
5.7 |
5.4 |
-1159 |
200 South |
GC5828 |
63 / 59 |
232.0 |
234.5 |
0.4 |
59.2 |
0.04 |
2.3 |
1.3 |
-1080 |
200 South |
GC5834 |
63 / -56 |
63.5 |
68.0 |
4.2 |
6.3 |
0.02 |
6.8 |
3.6 |
-1354 |
200 South |
GC5837 |
63 / -788 |
50.0 |
55.0 |
4.0 |
14.9 |
0.15 |
1.3 |
0.9 |
-1351 |
200 South |
GC5839 |
63 / -40 |
43.5 |
45.0 |
1.4 |
2.0 |
0.01 |
12.6 |
5.5 |
-1329 |
200 South |
GC5839 |
63 / -40 |
81.0 |
82.5 |
1.5 |
9.2 |
0.02 |
5.9 |
7.7 |
-1354 |
200 South |
GC5842 |
63 / -4 |
51.0 |
53.0 |
1.8 |
0.7 |
0.01 |
9.0 |
6.8 |
-1300 |
200 South |
GC5842 |
63 / -4 |
81.0 |
82.0 |
0.9 |
14.6 |
0.01 |
8.2 |
3.8 |
-1301 |
200 South |
GC5842 |
63 / -4 |
87.5 |
90.0 |
2.3 |
2.7 |
0.01 |
7.0 |
3.5 |
-1302 |
200 South |
GC5855 |
243 / -82 |
47.0 |
48.0 |
0.5 |
7.4 |
0.01 |
4.2 |
2.3 |
-1348 |
200 South |
GC5855 |
243 / -82 |
161.0 |
163.0 |
1.4 |
4.0 |
0.01 |
6.0 |
5.1 |
-1461 |
East |
GC5722 |
63 / -32 |
313.5 |
315.0 |
1.5 |
5.9 |
0.05 |
4.2 |
3.0 |
470 |
East |
GC5722 |
63 / -32 |
325.0 |
329.0 |
4.0 |
15.5 |
0.15 |
12.4 |
3.9 |
464 |
East |
GC5727 |
71 / -7 |
394.0 |
398.5 |
4.3 |
17.7 |
0.10 |
1.8 |
0.6 |
591 |
East |
GC5730 |
72 / -21 |
322.5 |
323.5 |
0.9 |
8.5 |
0.04 |
11.3 |
3.5 |
519 |
East |
GC5730 |
72 / -21 |
356.3 |
359.6 |
2.9 |
7.9 |
0.14 |
17.3 |
3.0 |
506 |
East |
GC5732 |
78 / -38 |
323.1 |
333.0 |
9.6 |
9.8 |
0.06 |
11.9 |
3.0 |
431 |
East |
GC5741 |
48 / -54 |
302.0 |
303.0 |
1.0 |
3.3 |
0.07 |
14.9 |
5.4 |
396 |
East |
GC5741 |
48 / -54 |
304.0 |
305.7 |
1.6 |
3.6 |
0.04 |
11.8 |
3.0 |
394 |
East |
GC5741 |
48 / -54 |
307.8 |
311.0 |
3.2 |
4.1 |
0.03 |
13.5 |
4.0 |
390 |
East |
GC5741 |
48 / -54 |
321.0 |
324.0 |
3.0 |
22.8 |
0.38 |
4.6 |
1.1 |
379 |
East |
GC5744 |
46 / -25 |
342.7 |
346.1 |
3.2 |
7.3 |
0.06 |
13.0 |
3.8 |
494 |
East |
GC5744 |
46 / -25 |
362.8 |
364.0 |
1.1 |
14.5 |
0.22 |
24.9 |
8.8 |
487 |
East |
GC5747 |
52 / -37 |
329.2 |
330.2 |
1.0 |
19.6 |
0.25 |
23.2 |
4.8 |
447 |
East |
GC5751 |
75 / -37 |
298.0 |
299.0 |
1.0 |
14.7 |
0.00 |
16.9 |
5.4 |
464 |
East |
GC5751 |
75 / -37 |
329.0 |
337.0 |
7.9 |
20.4 |
0.12 |
10.4 |
2.5 |
442 |
East |
GC5753 |
79 / -55 |
311.0 |
333.5 |
22.0 |
6.4 |
0.17 |
18.7 |
4.3 |
369 |
East |
GC5755 |
92 / -72 |
356.5 |
357.5 |
0.9 |
28.9 |
0.16 |
18.1 |
5.8 |
302 |
East |
GC5763 |
46 / -62 |
351.0 |
355.5 |
4.2 |
9.2 |
0.09 |
12.1 |
3.8 |
337 |
East |
GC5765 |
51 / -46 |
331.0 |
333.0 |
2.0 |
13.9 |
0.10 |
16.2 |
6.6 |
412 |
East |
GC5765 |
51 / -46 |
341.0 |
342.5 |
1.5 |
8.8 |
0.08 |
30.3 |
8.0 |
405 |
East |
GC5766 |
54 / -29 |
331.0 |
332.0 |
1.0 |
10.2 |
0.06 |
15.9 |
8.3 |
492 |
East |
GC5766 |
54 / -29 |
344.4 |
347.1 |
2.7 |
16.2 |
0.24 |
17.7 |
5.2 |
484 |
East |
GC5769 |
56 / -14 |
364.4 |
371.0 |
5.6 |
26.7 |
0.35 |
14.9 |
4.7 |
558 |
East |
GC5772 |
63 / -74 |
391.7 |
398.0 |
5.8 |
72.3 |
0.34 |
4.6 |
1.4 |
268 |
East |
GC5778 |
80 / -62 |
367.5 |
380.0 |
11.1 |
51.6 |
0.05 |
0.1 |
0.0 |
312 |
East |
GC5782 |
119 / -77 |
415.5 |
421.3 |
4.2 |
13.7 |
0.11 |
30.9 |
8.7 |
239 |
East |
GC5785 |
243 / -62 |
410.0 |
412.0 |
1.9 |
10.1 |
0.03 |
21.5 |
5.3 |
291 |
East |
GC5785 |
243 / -62 |
445.0 |
448.0 |
2.9 |
227.8 |
2.84 |
4.2 |
0.4 |
261 |
East |
GC5785 |
243 / -62 |
474.0 |
476.0 |
1.9 |
32.3 |
0.55 |
3.0 |
0.9 |
236 |
East |
GC5800 |
289 / -83 |
468.0 |
472.5 |
4.5 |
11.5 |
0.11 |
20.9 |
7.5 |
188 |
East |
GC5804 |
243 / -90 |
478.0 |
482.0 |
4.0 |
16.1 |
0.52 |
30.6 |
9.6 |
175 |
East |
GC5807 |
135 / -79 |
505.5 |
509.5 |
3.9 |
7.7 |
0.07 |
21.7 |
7.3 |
158 |
East |
GC5807 |
135 / -79 |
521.0 |
522.0 |
1.0 |
6.2 |
0.03 |
22.9 |
10.4 |
144 |
East |
GC5814 |
55 / -82 |
498.5 |
501.5 |
2.9 |
10.5 |
0.07 |
32.3 |
10.1 |
160 |
East |
GC5819 |
46 / -75 |
498.0 |
517.0 |
14.6 |
27.6 |
0.27 |
18.3 |
6.8 |
157 |
East |
GC5822 |
99 / -58 |
69.0 |
73.5 |
3.9 |
23.5 |
0.05 |
17.7 |
3.7 |
470 |
East |
GC5822 |
99 / -58 |
80.0 |
82.0 |
1.6 |
6.7 |
0.06 |
8.2 |
2.1 |
462 |
East |
GC5826 |
223 / -77 |
383.5 |
388.8 |
5.2 |
7.8 |
0.18 |
10.4 |
3.1 |
155 |
East |
GC5829 |
234 / -66 |
418.5 |
422.5 |
3.6 |
6.1 |
0.17 |
23.8 |
6.1 |
150 |
East |
GC5836 |
123 / -74 |
137.5 |
140.0 |
2.5 |
46.4 |
0.06 |
10.9 |
2.4 |
397 |
East |
GC5851 |
14 / -77 |
123.6 |
125.0 |
0.6 |
6.5 |
0.04 |
12.0 |
3.3 |
409 |
East |
GC5851 |
14 / -77 |
129.0 |
130.0 |
0.5 |
8.7 |
0.05 |
7.5 |
1.7 |
400 |
East |
GC5851 |
14 / -77 |
133.0 |
140.0 |
3.2 |
33.9 |
0.18 |
25.7 |
5.4 |
394 |
East |
GC5863 |
123 / 28 |
338.5 |
355.5 |
11.1 |
12.4 |
0.07 |
5.6 |
2.9 |
66 |
East |
GC5867 |
36 / -22 |
306.0 |
308.0 |
1.5 |
15.2 |
0.07 |
6.6 |
4.3 |
515 |
East |
GC5869 |
59 / -53 |
305.8 |
309.6 |
3.6 |
10.6 |
0.21 |
5.4 |
2.1 |
390 |
West |
GC5715 |
80 / 7 |
99.0 |
104.0 |
4.1 |
7.5 |
0.03 |
10.7 |
5.0 |
-176 |
West |
GC5715 |
80 / 7 |
117.0 |
118.0 |
0.8 |
13.5 |
0.05 |
6.5 |
2.9 |
-178 |
West |
GC5719 |
105 / 10 |
120.2 |
121.2 |
1.0 |
17.6 |
0.02 |
22.2 |
10.2 |
-167 |
West |
GC5719 |
105 / 10 |
130.0 |
133.5 |
3.1 |
26.1 |
0.00 |
0.0 |
0.0 |
-171 |
West |
GC5724 |
76 / 25 |
97.0 |
104.0 |
1.6 |
8.6 |
0.18 |
16.0 |
8.6 |
-136 |
West |
GC5725 |
128 / -61 |
0.0 |
1.0 |
1.0 |
7.5 |
0.01 |
22.4 |
14.4 |
-170 |
West |
GC5725 |
128 / -61 |
28.1 |
33.2 |
4.3 |
3.0 |
0.01 |
12.8 |
6.3 |
-211 |
West |
GC5725 |
128 / -61 |
36.7 |
41.4 |
4.2 |
45.9 |
0.26 |
7.9 |
3.3 |
-220 |
West |
GC5725 |
128 / -61 |
74.5 |
81.3 |
6.4 |
30.8 |
0.30 |
13.9 |
6.8 |
-271 |
West |
GC5726 |
210 / -39 |
19.0 |
22.7 |
3.6 |
10.5 |
0.02 |
22.3 |
12.5 |
-189 |
West |
GC5726 |
210 / -39 |
56.0 |
71.5 |
13.9 |
19.4 |
0.21 |
3.1 |
1.7 |
-230 |
West |
GC5729 |
235 / -22 |
95.4 |
106.0 |
4.5 |
13.4 |
0.19 |
13.0 |
5.9 |
-217 |
West |
GC5729 |
235 / -22 |
172.0 |
182.7 |
9.9 |
36.5 |
0.15 |
10.5 |
4.4 |
-255 |
West |
GC5729 |
235 / -22 |
232.7 |
254.0 |
19.0 |
7.4 |
0.14 |
10.1 |
1.5 |
-288 |
West |
GC5731 |
229 / 1 |
124.0 |
125.2 |
1.2 |
6.4 |
0.06 |
30.8 |
12.0 |
-148 |
West |
GC5731 |
229 / 1 |
144.7 |
176.0 |
31.2 |
55.2 |
0.16 |
16.5 |
8.9 |
-162 |
West |
GC5731 |
229 / 1 |
189.0 |
195.1 |
6.1 |
16.8 |
0.23 |
16.0 |
11.7 |
-165 |
West |
GC5731 |
229 / 1 |
213.8 |
244.9 |
31.0 |
7.6 |
0.17 |
23.3 |
7.2 |
-167 |
West |
GC5731 |
229 / 1 |
259.7 |
268.3 |
8.6 |
15.2 |
0.05 |
14.7 |
7.0 |
-173 |
West |
GC5731 |
229 / 1 |
273.0 |
285.9 |
12.9 |
8.1 |
0.01 |
18.5 |
7.7 |
-178 |
West |
GC5731 |
229 / 1 |
300.0 |
305.0 |
5.0 |
22.7 |
0.13 |
1.1 |
0.6 |
-176 |
West |
GC5733 |
63 / -63 |
1.0 |
5.6 |
4.3 |
19.0 |
0.05 |
22.9 |
11.7 |
-183 |
West |
GC5733 |
63 / -63 |
10.3 |
21.5 |
2.8 |
12.1 |
0.19 |
12.5 |
4.6 |
-197 |
West |
GC5733 |
63 / -63 |
75.0 |
82.3 |
5.5 |
11.7 |
0.20 |
3.6 |
1.4 |
-251 |
West |
GC5737 |
91 / -21 |
6.0 |
13.0 |
6.7 |
12.5 |
0.27 |
11.2 |
5.6 |
-146 |
West |
GC5737 |
91 / -21 |
24.3 |
25.3 |
0.7 |
15.5 |
0.08 |
17.1 |
5.6 |
-155 |
West |
GC5737 |
91 / -21 |
129.6 |
130.9 |
1.3 |
10.9 |
0.05 |
18.0 |
6.0 |
-235 |
West |
GC5739 |
108 / -41 |
13.5 |
16.1 |
2.4 |
11.4 |
0.12 |
12.4 |
3.7 |
-151 |
West |
GC5739 |
108 / -41 |
19.5 |
20.5 |
0.9 |
3.4 |
0.08 |
7.4 |
1.5 |
-156 |
West |
GC5739 |
108 / -41 |
89.2 |
92.2 |
2.5 |
0.9 |
0.01 |
15.1 |
5.2 |
-236 |
West |
GC5739 |
108 / -41 |
117.3 |
118.5 |
1.0 |
10.1 |
0.13 |
29.4 |
10.4 |
-266 |
West |
GC5740 |
154 / -52 |
0.0 |
3.5 |
3.3 |
5.9 |
0.05 |
9.2 |
5.7 |
-137 |
West |
GC5740 |
154 / -52 |
7.8 |
11.3 |
3.4 |
32.1 |
0.03 |
23.7 |
12.8 |
-147 |
West |
GC5740 |
154 / -52 |
16.1 |
20.0 |
3.5 |
13.0 |
0.13 |
18.2 |
5.4 |
-159 |
West |
GC5740 |
154 / -52 |
65.2 |
67.1 |
1.9 |
4.8 |
0.06 |
11.7 |
5.2 |
-221 |
West |
GC5740 |
154 / -52 |
82.0 |
83.0 |
1.0 |
32.6 |
0.45 |
6.3 |
2.4 |
-241 |
West |
GC5742 |
199 / -38 |
32.0 |
82.5 |
47.2 |
37.0 |
0.26 |
18.3 |
9.5 |
-198 |
West |
GC5742 |
199 / -38 |
101.5 |
113.5 |
11.0 |
6.3 |
0.06 |
8.1 |
3.5 |
-222 |
West |
GC5742 |
199 / -38 |
163.0 |
164.0 |
0.9 |
12.5 |
0.07 |
26.6 |
10.3 |
-254 |
West |
GC5746 |
82 / -2 |
19.0 |
22.2 |
3.1 |
60.5 |
0.09 |
10.0 |
4.7 |
-139 |
West |
GC5746 |
82 / -2 |
113.0 |
126.3 |
12.6 |
6.4 |
0.06 |
10.3 |
3.1 |
-172 |
9A |
GC5622 |
63 / 78 |
246.0 |
247.0 |
1.0 |
11.9 |
0.07 |
0.1 |
0.0 |
10 |
Gallagher Fault Block |
GC-5728 |
243 / -13 |
727.8 |
732.0 |
3.8 |
4.3 |
0.06 |
5.2 |
2.9 |
-1448 |
Gallagher Fault Block |
GC-5728 |
243 / -13 |
758.4 |
771.7 |
13.3 |
4.5 |
0.09 |
8.1 |
4.9 |
-1456 |
|
|||||||
Zone |
Drillhole
|
Drill Hole
|
Sample From
|
Sample To
|
Est. True
|
Gold
|
Depth From
|
113 Zone |
CBW-1182 |
334 / 20 |
793.8 |
806.9 |
12.5 |
0.02 |
-2976 |
113 Zone |
CBW-1183 |
334 /-2 |
624.8 |
634.7 |
9.5 |
0.56 |
-3284 |
113 Zone |
Including |
631.7 |
634.7 |
2.6 |
1.61 |
-3284 |
|
113 Zone |
CBW-1183 |
334 /-2 |
733.1 |
747.8 |
14.1 |
0.06 |
-3313 |
113 Zone |
Including |
742.9 |
745.5 |
2.6 |
0.18 |
-3314 |
|
113 Zone |
CBW-1183 |
334 /-2 |
799.7 |
802.9 |
3.0 |
0.08 |
-3330 |
113 Zone |
CBW-1183 |
334 /-2 |
815.4 |
820.0 |
4.3 |
0.03 |
-3334 |
113 Zone |
CBW-1186 |
336 / 10 |
728.2 |
742.9 |
14.8 |
0.02 |
-3122 |
118 Zone |
CBP-1175 |
350 /-4 |
312.3 |
321.8 |
8.2 |
0.19 |
-3632 |
118 Zone |
Including |
312.3 |
315.5 |
2.6 |
0.41 |
-3632 |
|
118 Zone |
CBP-1176 |
330/-13 |
317.5 |
324.7 |
5.9 |
0.10 |
-3677 |
118 Zone |
Including |
317.5 |
321.1 |
3.0 |
0.21 |
-3676 |
|
118 Zone |
CBP-1179 |
309 / 4 |
909.2 |
922.7 |
8.2 |
0.20 |
-3585 |
118 Zone |
Including |
909.2 |
912.8 |
1.3 |
0.67 |
-3585 |
|
118 Zone |
CBP-1180 |
354 /-55 |
280.8 |
290.6 |
6.2 |
0.02 |
-3829 |
118 Zone |
CBP-1182 |
354 / 4 |
272.9 |
282.7 |
7.9 |
0.03 |
-3062 |
118 Zone |
CBP-1186 |
56 /-50 |
323.1 |
335.5 |
8.2 |
0.05 |
-3325 |
118 Zone |
Including |
327.3 |
329.3 |
1.3 |
0.31 |
-3325 |
|
118 Zone |
CBP-1187 |
46 /-20 |
275.5 |
286.7 |
10.5 |
0.06 |
-3169 |
118 Zone |
Including |
278.8 |
283.7 |
4.6 |
0.13 |
-3169 |
|
119 Zone |
CBP-1162 |
179 /-11 |
788.2 |
801.3 |
12.1 |
0.00 |
-1080 |
119 Zone |
CBP-1163 |
180 /-1 |
704.2 |
713.4 |
4.9 |
0.02 |
-944 |
119 Zone |
CBP-1164 |
186 /-19 |
775.7 |
791.5 |
13.8 |
0.05 |
-1153 |
119 Zone |
Including |
784.9 |
786.9 |
1.3 |
0.29 |
-1153 |
|
119 Zone |
CBP-1165 |
188 /28 |
694.4 |
709.1 |
12.8 |
0.00 |
-626 |
119 Zone |
CBP-1169 |
169 /-35 |
629.1 |
645.5 |
14.8 |
0.16 |
-1286 |
119 Zone |
Including |
642.9 |
645.5 |
2.0 |
0.61 |
-1289 |
|
119 Zone |
CBP-1169 |
169 /-35 |
662.6 |
682.2 |
18.7 |
0.08 |
-1305 |
119 Zone |
CBP-1169 |
169 /-35 |
688.8 |
701.9 |
12.5 |
0.08 |
-1317 |
119 Zone |
Including |
700.6 |
701.9 |
1.3 |
0.31 |
-1320 |
|
123 Zone |
CBP-1213 |
28 /-76 |
1538.6 |
1547.8 |
5.9 |
0.11 |
-4954 |
123 Zone |
Including |
1543.2 |
1547.8 |
3.0 |
0.22 |
-4956 |
|
123 Zone |
CBP-1215 |
40 /-57 |
995.8 |
1018.4 |
21.0 |
0.17 |
-4268 |
123 Zone |
Including |
995.8 |
999.1 |
2.6 |
0.26 |
-4261 |
|
123 Zone |
CBP-1216 |
74 /-83 |
2481.0 |
2495.8 |
8.2 |
0.02 |
-5891 |
148 Zone |
CBE-0248 |
341 /-29 |
1279.5 |
1299.2 |
16.7 |
0.05 |
-2180 |
148 Zone |
CBE-0249 |
351 /-28 |
1288.7 |
1306.8 |
16.1 |
0.05 |
-2147 |
148 Zone |
CBE-0250 |
351 /-39 |
1351.4 |
1363.8 |
9.8 |
0.03 |
-2326 |
148 Zone |
CBE-0251 |
351 /-55 |
1520.9 |
1550.5 |
19.7 |
0.04 |
-2713 |
148 Zone |
CBE-0251 |
351 /-55 |
2307.8 |
2316.3 |
6.2 |
0.06 |
-3273 |
148 Zone |
CBE-0253 |
7 /-40 |
1570.5 |
1581.3 |
8.2 |
0.04 |
-2490 |
148 Zone |
|
329 /-69 |
1599.0 |
1603.9 |
3.0 |
0.14 |
-1425 |
View source version on businesswire.com: https://www.businesswire.com/news/home/20221109005426/en/
For further information, please contact:
Vice President, Investor Relations and Treasurer
Communications Coordinator
800-HECLA91 (800-432-5291)
Investor Relations
Email: hmc-info@hecla-mining.com
Website: www.hecla-mining.com
Source: