America’s Car-Mart Reports First Quarter Fiscal Year 2025 Results
America's Car-Mart (NASDAQ: CRMT) reported Q1 FY2025 results with revenue down 5.2% to $347.8 million. The company experienced a loss per share of $0.15 compared to earnings of $0.63 in the previous year. Key highlights include:
- Interest income increased 7.2% to $4.1 million
- Total collections rose 4.3% to $172.9 million
- Net charge-offs as a percentage of average finance receivables increased to 6.4% from 5.8%
- Interest expense grew 28.3% to $4.0 million
The company saw improvements in down payments and deal structures due to a new loan origination system. Despite challenges, Car-Mart's focus remains on affordability and strengthening its competitive position through strategic initiatives and cost control measures.
America's Car-Mart (NASDAQ: CRMT) ha riportato i risultati del primo trimestre dell'anno fiscale 2025, con un fatturato in calo del 5,2% a 347,8 milioni di dollari. L'azienda ha registrato una perdita per azione di 0,15 dollari rispetto agli utili di 0,63 dollari dell'anno precedente. Tra i punti salienti ci sono:
- I proventi da interessi sono aumentati del 7,2% a 4,1 milioni di dollari
- Le riscossioni totali sono cresciute del 4,3% a 172,9 milioni di dollari
- I crediti inesigibili netti come percentuale delle recezioni finanziarie medie sono aumentati al 6,4% dal 5,8%
- Le spese per interessi sono cresciute del 28,3% a 4,0 milioni di dollari
L'azienda ha visto miglioramenti nei pagamenti iniziali e nelle strutture degli affari grazie a un nuovo sistema di origine prestiti. Nonostante le sfide, Car-Mart rimane concentrata sull'accessibilità e sul rafforzamento della sua posizione competitiva attraverso iniziative strategiche e misure di controllo dei costi.
America's Car-Mart (NASDAQ: CRMT) reportó los resultados del primer trimestre del año fiscal 2025, con ingresos en descenso del 5.2% a 347.8 millones de dólares. La compañía experimentó una pérdida por acción de 0.15 dólares en comparación con ganancias de 0.63 dólares del año anterior. Los aspectos destacados incluyen:
- Los ingresos por intereses aumentaron un 7.2% a 4.1 millones de dólares
- Las cobranza totales subieron un 4.3% a 172.9 millones de dólares
- Las bajas netas en cuentas incobrables como porcentaje de las cuentas por cobrar financieras promedio aumentaron al 6.4% desde el 5.8%
- Los gastos por intereses crecieron un 28.3% a 4.0 millones de dólares
La empresa observó mejoras en los pagos iniciales y en las estructuras de negocios gracias a un nuevo sistema de origen de préstamos. A pesar de los desafíos, Car-Mart sigue enfocándose en la asequibilidad y en fortalecer su posición competitiva a través de iniciativas estratégicas y medidas de control de costos.
아메리카스 카마트 (NASDAQ: CRMT)는 2025 회계연도 1분기 실적을 보고하며 수익이 5.2% 감소한 3억 4,780만 달러를 기록했습니다. 이 회사는 전년의 주당 수익 0.63 달러에 비해 주당 손실 0.15 달러를 경험했습니다. 주요 하이라이트는 다음과 같습니다:
- 이자 수익이 7.2% 증가하여 410만 달러
- 총 징수액이 4.3% 증가하여 1억 7,290만 달러
- 평균 금융채권 대비 순 부실 채권 비율이 5.8%에서 6.4%로 증가
- 이자 비용이 28.3% 증가하여 400만 달러
회사는 새로운 대출 원천 시스템 덕분에 계약금 및 거래 구조에서 개선을 보았습니다. 도전 과제에도 불구하고 Car-Mart는 가격 접근성과 전략적 이니셔티브 및 비용 통제 조치를 통한 경쟁력 강화를 목표로 하고 있습니다.
America's Car-Mart (NASDAQ: CRMT) a rapporté les résultats du premier trimestre de l'exercice 2025, avec un chiffre d'affaires en baisse de 5,2% à 347,8 millions de dollars. L'entreprise a connu une perte par action de 0,15 dollar par rapport à un bénéfice de 0,63 dollar l'année précédente. Parmi les points saillants, on note :
- Les produits d'intérêts ont augmenté de 7,2% pour atteindre 4,1 millions de dollars
- Les encaissements totaux ont crû de 4,3% pour atteindre 172,9 millions de dollars
- Les pertes nettes en pourcentage des créances financières moyennes ont augmenté à 6,4% contre 5,8%
- Les charges d'intérêts ont grimpé de 28,3% pour atteindre 4,0 millions de dollars
L'entreprise a constaté des améliorations dans les acomptes et les structures de contrats grâce à un nouveau système d'origine de prêts. Malgré les défis, Car-Mart reste axé sur l'accessibilité et le renforcement de sa position concurrentielle grâce à des initiatives stratégiques et des mesures de contrôle des coûts.
America's Car-Mart (NASDAQ: CRMT) berichtete über die Ergebnisse des ersten Quartals des Finanzjahres 2025, mit einem Umsatzrückgang von 5,2% auf 347,8 Millionen US-Dollar. Das Unternehmen verzeichnete einen Verlust pro Aktie von 0,15 US-Dollar im Vergleich zu einem Gewinn von 0,63 US-Dollar im Vorjahr. Zu den wichtigsten Höhepunkten gehören:
- Die Zinserträge stiegen um 7,2% auf 4,1 Millionen US-Dollar
- Die Gesamteinzahlungen erhöhten sich um 4,3% auf 172,9 Millionen US-Dollar
- Die Nettobelastungen als Prozentsatz der durchschnittlichen Finanzforderungen stiegen auf 6,4% von 5,8%
- Die Zinsaufwendungen wuchsen um 28,3% auf 4,0 Millionen US-Dollar
Das Unternehmen sah Verbesserungen bei Anzahlungen und Geschäftsstrukturen durch ein neues Darlehensursprungssystem. Trotz der Herausforderungen bleibt Car-Mart auf Erschwinglichkeit und die Stärkung seiner Wettbewerbsposition durch strategische Initiativen und Kostenkontrollmaßnahmen fokussiert.
- Interest income increased by 7.2% to $4.1 million
- Total collections rose 4.3% to $172.9 million
- Gross profit margin improved to 35%, up 30 basis points
- Average down payments improved to 5.2%, up 20 basis points
- Delinquencies improved by 90 basis points to 3.5% of finance receivables
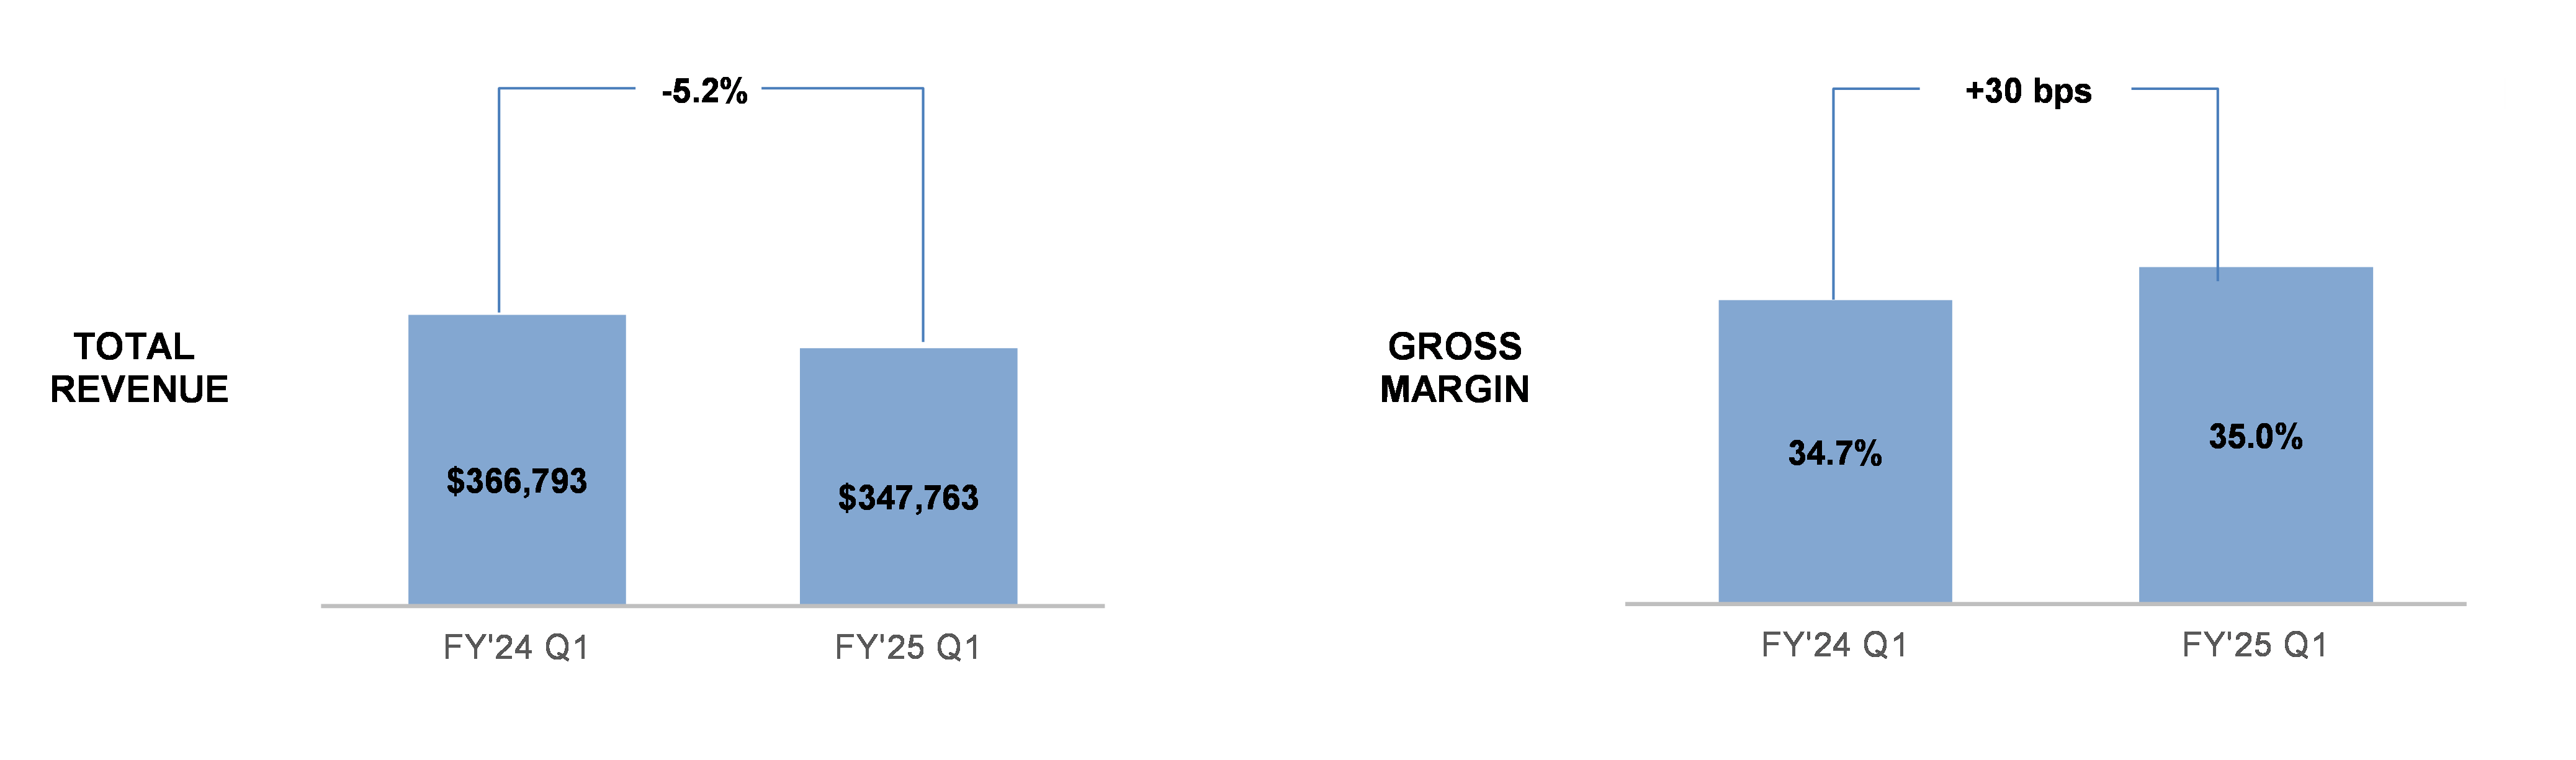
- Revenue decreased 5.2% to $347.8 million
- Loss per share of $0.15 compared to earnings of $0.63 in the previous year
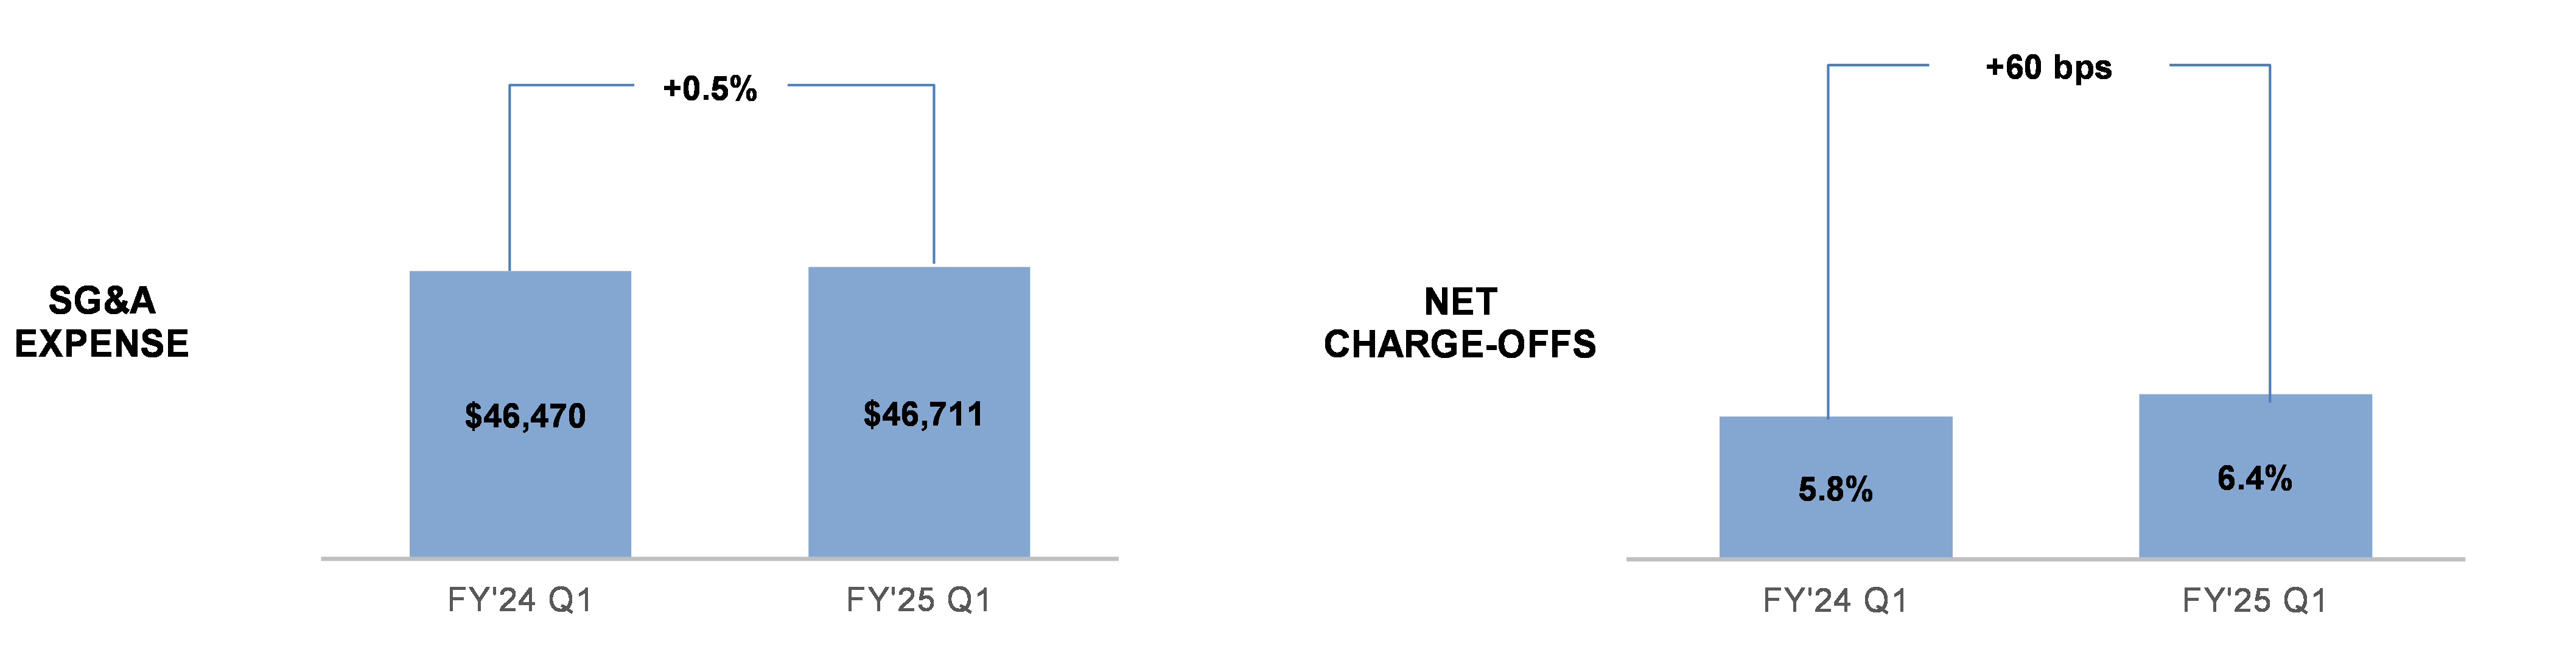
- Net charge-offs as a percentage of average finance receivables increased to 6.4% from 5.8%
- Interest expense grew 28.3% to $4.0 million
- Retail units sold decreased by 9.6% to 14,391 units
Insights
America's Car-Mart's Q1 FY2025 results reveal a mixed financial picture. The
- Gross profit margin improved by 30 basis points to
35% - Interest income increased by
7.2% - Total collections grew by
4.3%
The company's focus on improving deal structures and implementing a new loan origination system is showing promise, with higher down payments and better projected cash-on-cash returns. However, the
The used car market is facing economic headwinds, as evidenced by America's Car-Mart's results. The
- New loan origination system improving deal structures
- Focus on acquisitions (e.g., Texas Auto Center) to strengthen market position
- Cost control measures being implemented
The slight increase in average retail sales price (
America's Car-Mart's credit metrics show a mixed performance. Positive developments include:
- Allowance for credit losses decreased from
25.32% to25% - Delinquencies improved by 90 basis points year-over-year to
3.5% - Recency (accounts current) increased to
82.3% , highest in two years
However, there are concerning trends:
- Net charge-offs increased to
6.4% from5.8% - Higher frequency and severity of losses from FY22 and FY23 originations
The new loan origination system is showing promise, with better performance compared to legacy underwriting. With
ROGERS, Ark., Sept. 04, 2024 (GLOBE NEWSWIRE) -- America’s Car-Mart, Inc. (NASDAQ: CRMT) (“we,” “Car-Mart” or the “Company”), today reported financial results for the first quarter ended July 31, 2024.
First Quarter Key Highlights (FY'25 vs. FY'24 Q1, unless otherwise noted)
- Revenue was
$347.8 million , down5.2% - Interest income increased
$4.1 million , up7.2% - Total collections increased
4.3% to$172.9 million - Favorable adjustment to allowance for credit loss to
25.0% , down from25.32% - Net charge-offs as a % of average finance receivables were
6.4% vs.5.8% - Interest expense increased
$4.0 million , or28.3% - Loss per share of
$0.15 vs. diluted earnings per share of$0.63
President and CEO Doug Campbell commentary:
“I’m encouraged with our rebound in sales volume from two quarters ago, despite the ongoing economic challenges facing the customer today. During the quarter, our new loan origination system (“LOS”) contributed to higher down payments and improved deal structures. I’d like to recognize our operations team for improvements on several credit metrics. Affordability remains Car-Mart’s number one focus in putting and keeping customers on the road. We believe that our strategic priorities, including acquisitions like Texas Auto Center completed in June, will strengthen our competitive position and along with cost control initiatives, can drive better results for the remainder of the fiscal year.”
| First Quarter Fiscal Year 2025 Key Operating Metrics |
Dollars in thousands, except per share data. Dollar and percentage changes may not recalculate due to rounding. Charts may not be to scale.
Note: Discussions in each section provide information for the first quarter of fiscal year 2025 compared to the first quarter of fiscal year 2024, unless otherwise noted.
| First Quarter Business Review |
TOTAL REVENUE – A
SALES – Sales for the quarter were 14,391 units vs. 15,912 units, down
GROSS PROFIT – Gross profit margin as a percentage of sales was
NET CHARGE-OFFS – Net charge-offs as a percentage of average finance receivables were
ALLOWANCE FOR CREDIT LOSSES – The allowance for credit loss as a percentage of finance receivables, net of deferred revenue and pending accident protection plan claims, decreased from
UNDERWRITING – Average down payments improved to
SG&A EXPENSE – SG&A expense was
LEVERAGE & LIQUIDITY – Debt to finance receivables and debt, net of cash, to finance receivables (non-GAAP)1 were
ANNUAL CASH-ON-CASH RETURNS – We continue to generate solid cash-on-cash returns. During the quarter, the frequency of losses on originations in fiscal years 2021 through 2023 were higher than prior projections; however, these contracts represent a smaller balance of our total portfolio. In contrast, the originations generated during fiscal year 2024 improved cash-on-cash returns by 140 basis points, mainly due to lower than projected loss rates. Fiscal year 2025 is off to a solid start with projected returns of
The following table sets forth the actual and projected cash-on-cash returns as of July 31, 2024, for the Company’s finance receivables by origination year. The return percentages provided for contracts originated in fiscal years 2017 through 2020 reflect the Company’s actual cash-on-cash returns.
| Cash-on-Cash Returns2 | ||||
| Loan Origination Year | Prior Quarter Projected | Current Quarter Actual/Projected | Variance | % of A/R Remaining |
| FY2017 | * | * | ||
| FY2018 | * | * | ||
| FY2019 | * | * | ||
| FY2020 | * | * | ||
| FY2021 | - | |||
| FY2022 | - | |||
| FY2023 | - | |||
| FY2024 | ||||
| FY2025 | * | * | ||
| * 2017 - 2020 Pools' Current Projection reflects actual cash-on-cash returns | ||||
1 Calculation of this non-GAAP financial measure and a reconciliation to the most directly comparable GAAP measure are included in the tables accompanying this release
2“Cash-on-cash returns” represent the return on cash invested by the Company in the vehicle finance loans the Company originates and is calculated with respect to a pool of loans (or finance receivables) by dividing total “cash in” less “cash out” by total “cash out” with respect to such pool. “Cash in” represents the total cash the Company expects to collect on the pool of finance receivables, including credit losses. This includes down-payments, principal and interest collected (including special and seasonal payments) and the fair market value of repossessed vehicles, if applicable. “Cash out” includes purchase price paid by the Company to acquire the vehicle (including reconditioning and transportation costs), and all other post-sale expenses as well as expenses related to our ancillary products. The calculation assumes estimates on expected credit losses net of fair market value of repossessed vehicles and the related timing of such losses as well as post sales repair expenses and special payments. The Company evaluates and updates expected credit losses quarterly. The credit quality of each pool is monitored and compared to prior and initial forecasts and is reflected in our on-going internal cash-on-cash projections.
| Key Operating Results |
| Three Months Ended | ||||||||||||
| July 31, | ||||||||||||
| 2024 | 2023 | % Change | ||||||||||
| Operating Data: | ||||||||||||
| Retail units sold | 14,391 | 15,912 | (9.6 | )% | ||||||||
| Average number of stores in operation | 155 | 155 | - | |||||||||
| Average retail units sold per store per month | 30.9 | 34.2 | (9.6 | ) | ||||||||
| Average retail sales price | $ | 19,250 | $ | 18,799 | 2.4 | |||||||
| Total gross profit per retail unit sold | $ | 6,996 | $ | 6,768 | 3.4 | |||||||
| Total gross profit percentage | 35.0 | % | 34.7 | % | ||||||||
| Same store revenue growth | (8.6 | )% | 8.2 | % | ||||||||
| Net charge-offs as a percent of average finance receivables | 6.4 | % | 5.8 | % | ||||||||
| Total collected (principal, interest and late fees) | $ | 172,872 | $ | 165,747 | 4.3 | |||||||
| Average total collected per active customer per month | $ | 562 | $ | 535 | 5.0 | |||||||
| Average percentage of finance receivables-current (excl. 1-2 day) | 82.3 | % | 80.5 | % | ||||||||
| Average down-payment percentage | 5.2 | % | 5.0 | % | ||||||||
| Period End Data: | ||||||||||||
| Stores open | 156 | 154 | 1.3 | % | ||||||||
| Accounts over 30 days past due | 3.5 | % | 4.4 | % | ||||||||
| Active customer count | 103,231 | 104,734 | (1.4 | ) | ||||||||
| Principal balance of finance receivables | $ | 1,465,259 | $ | 1,440,707 | 1.7 | |||||||
| Weighted average total contract term | 48.1 | 46.9 | 2.5 | |||||||||
| Conference Call and Webcast |
The Company will hold a conference call to discuss its quarterly results on Wednesday, September 4, 2024, at 9 am ET. Participants may access the conference call via webcast using this link: Webcast Link. To participate via telephone, please register in advance using this Registration Link. Upon registration, all telephone participants will receive a one-time confirmation email detailing how to join the conference call, including the dial-in number along with a unique PIN that can be used to access the call. All participants are encouraged to dial in 10 minutes prior to the start time. A replay and transcript of the conference call and webcast will be available on-demand for 12 months.
| About America's Car-Mart, Inc. |
America’s Car-Mart, Inc. (the “Company”) operates automotive dealerships in 12 states and is one of the largest publicly held automotive retailers in the United States focused exclusively on the “Integrated Auto Sales and Finance” segment of the used car market. The Company emphasizes superior customer service and the building of strong personal relationships with its customers. The Company operates its dealerships primarily in smaller cities throughout the South-Central United States, selling quality used vehicles and providing financing for substantially all of its customers. For more information about America’s Car-Mart, including investor presentations, please visit our website at www.car-mart.com.
| Non-GAAP Financial Measures |
This news release contains financial information determined by methods other than in accordance with generally accepted accounting principles (GAAP). We present total debt, net of total cash, to finance receivables, a non-GAAP measure, as a supplemental measure of our performance. We believe total debt, net of total cash, to finance receivables is a useful measure to monitor leverage and evaluate balance sheet risk. This measure should not be considered in isolation or as a substitute for reported GAAP results because it may include or exclude certain items as compared to similar GAAP-based measures, and such measures may not be comparable to similarly-titled measures reported by other companies. We strongly encourage investors to review our consolidated financial statements included in publicly filed reports in their entirety and not rely solely on any one, single financial measure or communication. The most directly comparable GAAP financial measure, as well as a reconciliation to the comparable GAAP financial measure, for non-GAAP financial measures are presented in the tables of this release.
| Forward-Looking Statements |
This news release contains “forward-looking statements” within the meaning of the Private Securities Litigation Reform Act of 1995. These forward-looking statements address the Company’s future objectives, plans and goals, as well as the Company’s intent, beliefs and current expectations and projections regarding future operating performance and can generally be identified by words such as “may,” “will,” “should,” “could,” “expect,” “anticipate,” “intend,” “plan,” “project,” “foresee,” and other similar words or phrases. Specific events addressed by these forward-looking statements may include, but are not limited to:
- operational infrastructure investments;
- same dealership sales and revenue growth;
- customer growth and engagement;
- gross profit percentages;
- gross profit per retail unit sold;
- business acquisitions;
- inventory acquisition, reconditioning, transportation, and remarketing;
- technological investments and initiatives;
- future revenue growth;
- receivables growth as related to revenue growth;
- new dealership openings;
- performance of new dealerships;
- interest rates;
- future credit losses;
- the Company’s collection results, including but not limited to collections during income tax refund periods;
- cash-on-cash returns from the collection of contracts originated by the Company
- seasonality; and
- the Company’s business, operating and growth strategies and expectations.
These forward-looking statements are based on the Company’s current estimates and assumptions and involve various risks and uncertainties. As a result, you are cautioned that these forward-looking statements are not guarantees of future performance, and that actual results could differ materially from those projected in these forward-looking statements. Factors that may cause actual results to differ materially from the Company’s projections include, but are not limited to:
- general economic conditions in the markets in which the Company operates, including but not limited to fluctuations in gas prices, grocery prices and employment levels and inflationary pressure on operating costs;
- the availability of quality used vehicles at prices that will be affordable to our customers, including the impacts of changes in new vehicle production and sales;
- the ability to leverage the Cox Automotive services agreement to perform reconditioning and improve vehicle quality to reduce the average vehicle cost, improve gross margins, reduce credit loss, and enhance cash flow;
- the availability of credit facilities and access to capital through securitization financings or other sources on terms acceptable to us, and any increase in the cost of capital, to support the Company’s business;
- the Company’s ability to underwrite and collect its contracts effectively, including whether anticipated benefits from the Company’s recently implemented loan origination system are achieved as expected or at all;
- competition;
- dependence on existing management;
- ability to attract, develop, and retain qualified general managers;
- changes in consumer finance laws or regulations, including but not limited to rules and regulations that have recently been enacted or could be enacted by federal and state governments;
- the ability to keep pace with technological advances and changes in consumer behavior affecting our business;
- security breaches, cyber-attacks, or fraudulent activity;
- the ability to identify and obtain favorable locations for new or relocated dealerships at reasonable cost;
- the ability to successfully identify, complete and integrate new acquisitions;
- the occurrence and impact of any adverse weather events or other natural disasters affecting the Company’s dealerships or customers; and
- potential business and economic disruptions and uncertainty that may result from any future public health crises and any efforts to mitigate the financial impact and health risks associated with such developments.
Additionally, risks and uncertainties that may affect future results include those described from time to time in the Company’s SEC filings. The Company undertakes no obligation to update or revise any forward-looking statements, whether as a result of new information, future events or otherwise. Readers are cautioned not to place undue reliance on these forward-looking statements, which speak only as of the dates on which they are made.
| Contact for information |
Vickie Judy, CFO
479-464-9944
Investor_relations@car-mart.com
America’s Car-Mart
Consolidated Results of Operations
(Amounts in thousands, except per share data)
| As a % of Sales | ||||||||||||||||||||||||
| Three Months Ended | Three Months Ended | |||||||||||||||||||||||
| July 31, | July 31, | |||||||||||||||||||||||
| 2024 | 2023 | % Change | 2024 | 2023 | ||||||||||||||||||||
| Statements of Operations: | ||||||||||||||||||||||||
| Revenues: | ||||||||||||||||||||||||
| Sales(1) | $ | 287,248 | $ | 310,337 | (7.4 | )% | 100.0 | % | 100.0 | % | ||||||||||||||
| Interest income | 60,515 | 56,456 | 7.2 | 21.1 | 18.2 | |||||||||||||||||||
| Total(1) | 347,763 | 366,793 | (5.2 | ) | 121.1 | 118.2 | ||||||||||||||||||
| Costs and expenses: | ||||||||||||||||||||||||
| Cost of sales(1) | 186,570 | 202,647 | (7.9 | ) | 65.0 | 65.3 | ||||||||||||||||||
| Selling, general and administrative | 46,711 | 46,470 | 0.5 | 16.3 | 15.0 | |||||||||||||||||||
| Provision for credit losses | 95,423 | 96,323 | (0.9 | ) | 33.2 | 31.0 | ||||||||||||||||||
| Interest expense | 18,312 | 14,274 | 28.3 | 6.4 | 4.6 | |||||||||||||||||||
| Depreciation and amortization | 1,884 | 1,693 | 11.3 | 0.7 | 0.5 | |||||||||||||||||||
| Loss on disposal of property and equipment | 46 | 166 | (72.4 | ) | - | - | ||||||||||||||||||
| Total(1) | 348,946 | 361,573 | (3.5 | ) | 121.5 | 116.5 | ||||||||||||||||||
| (Loss) income before taxes | (1,183 | ) | 5,220 | (0.4 | ) | 1.7 | ||||||||||||||||||
| (Benefit) provision for income taxes | (219 | ) | 1,034 | (0.1 | ) | 0.3 | ||||||||||||||||||
| Net (loss) income | $ | (964 | ) | $ | 4,186 | (0.3 | ) | 1.3 | ||||||||||||||||
| Dividends on subsidiary preferred stock | $ | (10 | ) | $ | (10 | ) | ||||||||||||||||||
| Net (loss) income attributable to common shareholders | $ | (974 | ) | $ | 4,176 | |||||||||||||||||||
| Earnings per share: | ||||||||||||||||||||||||
| Basic | $ | (0.15 | ) | $ | 0.65 | |||||||||||||||||||
| Diluted | $ | - | $ | 0.63 | ||||||||||||||||||||
| Weighted average number of shares used in calculation: | ||||||||||||||||||||||||
| Basic | 6,396,757 | 6,381,704 | ||||||||||||||||||||||
| Diluted | 6,396,757 | 6,635,002 | ||||||||||||||||||||||
| (1) | Some items in the prior year financial statements were reclassified to conform to the current presentation. Reclassification had no effect on the prior year net income or shareholders equity. | |||||||||||||||||||||||
America’s Car-Mart
Condensed Consolidated Balance Sheet and Other Data
(Amounts in thousands, except per share data)
| July 31, | April 30, | July 31, | ||||||||||||||
| 2024 | 2024 | 2023 | ||||||||||||||
| Cash and cash equivalents | $ | 4,748 | $ | 5,522 | $ | 6,314 | ||||||||||
| Restricted cash from collections on auto finance receivables | $ | 93,873 | $ | 88,925 | $ | 85,887 | ||||||||||
| Finance receivables, net(1) | $ | 1,126,271 | $ | 1,098,591 | $ | 1,115,246 | (1) | |||||||||
| Inventory | $ | 114,548 | $ | 107,470 | $ | 117,186 | ||||||||||
| Total assets(1) | $ | 1,531,270 | $ | 1,477,644 | $ | 1,498,906 | (1) | |||||||||
| Revolving lines of credit, net | $ | 184,846 | $ | 200,819 | $ | (1,035 | ) | |||||||||
| Notes payable, net | $ | 597,494 | $ | 553,629 | $ | 711,789 | ||||||||||
| Treasury stock | $ | 297,810 | $ | 297,786 | $ | 297,489 | ||||||||||
| Total equity | $ | 471,153 | $ | 470,750 | $ | 504,729 | ||||||||||
| Shares outstanding | 6,396,757 | 6,394,675 | 6,381,954 | |||||||||||||
| Book value per outstanding share | $ | 73.72 | $ | 73.68 | $ | 79.15 | ||||||||||
| Allowance as % of principal balance net of deferred revenue | 25.00 | % | 25.32 | % | 23.91 | % | ||||||||||
| Changes in allowance for credit losses: | ||||||||||||||||
| Three months ended | ||||||||||||||||
| July 31, | ||||||||||||||||
| 2024 | 2023 | |||||||||||||||
| Balance at beginning of period | $ | 331,260 | $ | 299,608 | ||||||||||||
| Provision for credit losses | 95,423 | 96,323 | ||||||||||||||
| Charge-offs, net of collateral recovered | (92,259 | ) | (81,489 | ) | ||||||||||||
| Balance at end of period | $ | 334,424 | $ | 314,442 | ||||||||||||
| (1) | Some items in the prior year financial statements were reclassified to conform to the current presentation. Reclassification had no effect on the prior year net income or shareholders equity. | |||||||||||||||
America’s Car-Mart
Condensed Consolidated Statements of Cash Flows
(Amounts in thousands)
| Years Ended | |||||||||
| July 31, | |||||||||
| 2024 | 2023 | ||||||||
| Operating activities: | |||||||||
| Net income | $ | (964 | ) | $ | 4,186 | ||||
| Provision for credit losses | 95,423 | 96,323 | |||||||
| Losses on claims for accident protection plan | 9,321 | 7,769 | |||||||
| Depreciation and amortization | 1,884 | 1,693 | |||||||
| Finance receivable originations | (271,756 | ) | (297,732 | ) | |||||
| Finance receivable collections | 112,358 | 109,291 | |||||||
| Inventory | 25,603 | 23,953 | |||||||
| Deferred accident protection plan revenue | 205 | 1,651 | |||||||
| Deferred service contract revenue | 707 | 3,479 | |||||||
| Income taxes, net | 1,078 | 900 | |||||||
| Other | 11,169 | 3,088 | |||||||
| Net cash used in operating activities | (14,972 | ) | (45,399 | ) | |||||
| Investing activities: | |||||||||
| Purchase of investments | (7,527 | ) | (1,379 | ) | |||||
| Purchase of property and equipment and other | (986) | 529 | |||||||
| Net cash used in investing activities | (8,513 | ) | (850 | ) | |||||
| Financing activities: | |||||||||
| Change in revolving credit facility, net | (15,798 | ) | (168,516 | ) | |||||
| Payments on notes payable | (106,076 | ) | (116,862 | ) | |||||
| Change in cash overdrafts | 989 | - | |||||||
| Issuances of notes payable | 149,889 | 360,340 | |||||||
| Debt issuance costs | (1,387 | ) | (4,091 | ) | |||||
| Purchase of common stock | (24 | ) | (68 | ) | |||||
| Dividend payments | (10 | ) | (10 | ) | |||||
| Exercise of stock options and issuance of common stock | 76 | (377 | ) | ||||||
| Net cash provided by financing activities | 27,659 | 70,416 | |||||||
| Increase in cash, cash equivalents, and restricted cash | $ | 4,174 | $ | 24,167 | |||||
America’s Car-Mart
Reconciliation of Non-GAAP Financial Measures
(Amounts in thousands)
| Calculation of Debt, Net of Total Cash, to Finance Receivables: | |||||||||
| July 31, 2024 | April 30, 2024 | ||||||||
| Debt: | |||||||||
| Revolving lines of credit, net | $ | 184,846 | $ | 200,819 | |||||
| Notes payable, net | 597,494 | 553,629 | |||||||
| Total debt | $ | 782,340 | $ | 754,448 | |||||
| Cash: | |||||||||
| Cash and cash equivalents | $ | 4,748 | $ | 5,522 | |||||
| Restricted cash from collections on auto finance receivables | 93,873 | 88,925 | |||||||
| Total cash, cash equivalents, and restricted cash | $ | 98,621 | $ | 94,447 | |||||
| Debt, net of total cash | $ | 683,719 | $ | 660,001 | |||||
| Principal balance of finance receivables | $ | 1,465,259 | $ | 1,435,388 | |||||
| Ratio of debt to finance receivables | 53.4 | % | 52.6 | % | |||||
| Ratio of debt, net of total cash, to finance receivables | 46.7 | % | 46.0 | % | |||||
Photos accompanying this announcement are available at
https://www.globenewswire.com/NewsRoom/AttachmentNg/b9f4d0eb-3e21-478d-9b3b-c117d6f81833
https://www.globenewswire.com/NewsRoom/AttachmentNg/29a93946-aa70-408b-a499-cd78853dff71
