America’s Car-Mart Reports Third Quarter Fiscal Year 2025 Results
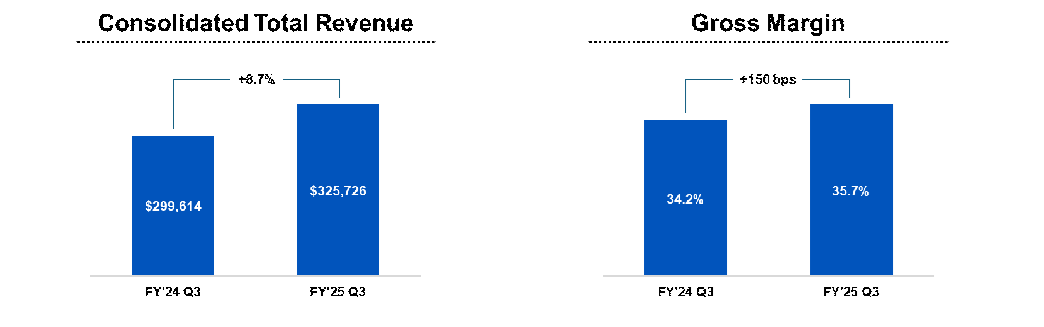
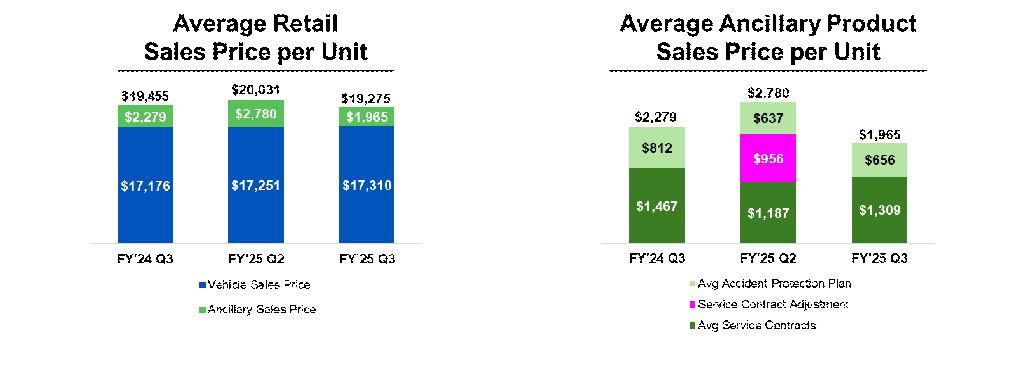
America's Car-Mart (NASDAQ: CRMT) reported strong Q3 FY2025 results with notable improvements across key metrics. Total revenue increased 8.7%, driven by a 13.2% rise in sales volumes to 13,198 units, despite a 0.9% decrease in average retail sales price. The average vehicle retail price was $17,310.
Gross profit margin improved by 150 basis points to 35.7%, benefiting from enhanced vehicle procurement and disposal. Net charge-offs improved to 6.1% from 6.8%, while the allowance for credit losses decreased to 24.31%. The company completed a $200 million securitization with a 6.49% coupon rate and expanded its ABL facility to $350 million.
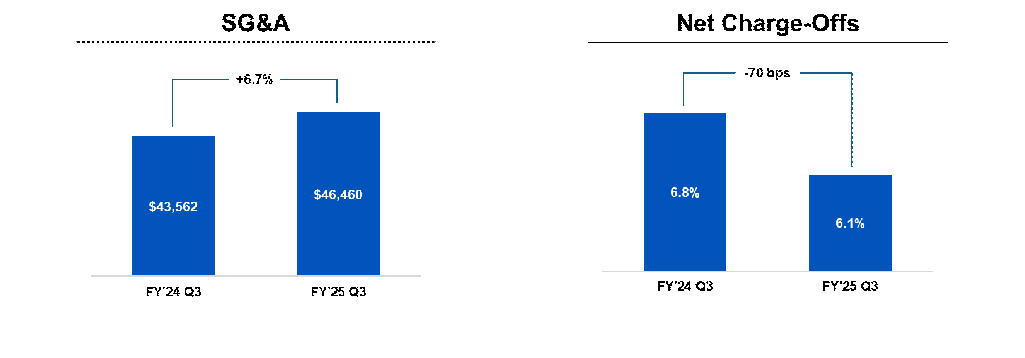
Notable operational metrics include stable down payments at 5.1%, average originating term of 44.6 months, and slight increase in delinquencies to 3.7% due to weather events. SG&A expenses rose to $46.5 million, partly due to recent acquisitions.
America's Car-Mart (NASDAQ: CRMT) ha riportato risultati solidi per il terzo trimestre dell'anno fiscale 2025, con notevoli miglioramenti in vari indicatori chiave. Il fatturato totale è aumentato dell'8,7%, grazie a un incremento del 13,2% nei volumi di vendita, raggiungendo 13.198 unità, nonostante una diminuzione dello 0,9% nel prezzo medio di vendita al dettaglio. Il prezzo medio di vendita al dettaglio dei veicoli era di $17.310.
Il margine di profitto lordo è migliorato di 150 punti base, raggiungendo il 35,7%, beneficiando di un miglioramento nell'acquisto e nella vendita dei veicoli. Le cancellazioni nette sono migliorate al 6,1% rispetto al 6,8%, mentre l'accantonamento per perdite su crediti è diminuito al 24,31%. L'azienda ha completato una cartolarizzazione da 200 milioni di dollari con un tasso d'interesse del 6,49% e ha ampliato la sua linea di credito ABL a 350 milioni di dollari.
I principali indicatori operativi includono acconti stabili al 5,1%, una durata media di origine di 44,6 mesi e un leggero aumento dei ritardi nei pagamenti al 3,7% a causa di eventi meteorologici. Le spese SG&A sono aumentate a 46,5 milioni di dollari, in parte a causa di recenti acquisizioni.
America's Car-Mart (NASDAQ: CRMT) reportó resultados sólidos para el tercer trimestre del año fiscal 2025, con mejoras notables en varias métricas clave. Los ingresos totales aumentaron un 8.7%, impulsados por un incremento del 13.2% en los volúmenes de venta, alcanzando las 13,198 unidades, a pesar de una disminución del 0.9% en el precio medio de venta al por menor. El precio medio de venta al por menor de los vehículos fue de $17,310.
El margen de ganancia bruta mejoró en 150 puntos básicos, alcanzando el 35.7%, beneficiándose de una mejor adquisición y disposición de vehículos. Las cancelaciones netas mejoraron al 6.1% desde el 6.8%, mientras que la provisión para pérdidas crediticias disminuyó al 24.31%. La compañía completó una titulización de $200 millones con una tasa de cupón del 6.49% y amplió su línea de crédito ABL a $350 millones.
Las métricas operativas notables incluyen pagos iniciales estables del 5.1%, un plazo medio de origen de 44.6 meses y un ligero aumento en los incumplimientos al 3.7% debido a eventos climáticos. Los gastos SG&A aumentaron a $46.5 millones, en parte debido a adquisiciones recientes.
아메리카스 카마트 (NASDAQ: CRMT)는 2025 회계연도 3분기 실적을 발표하며 주요 지표에서 눈에 띄는 개선을 보였습니다. 총 수익은 8.7% 증가했습니다, 판매량이 13.2% 증가하여 13,198대에 도달했음에도 불구하고 평균 소매 판매 가격은 0.9% 감소했습니다. 평균 차량 소매 가격은 $17,310이었습니다.
총 이익률은 150bp 개선되어 35.7%에 도달했으며, 이는 차량 조달 및 처분의 개선 덕분입니다. 순 대손상각은 6.1%로 개선되었고, 신용 손실 충당금은 24.31%로 감소했습니다. 회사는 6.49%의 쿠폰 금리를 가진 2억 달러의 증권화 작업을 완료하고 ABL 시설을 3억 5천만 달러로 확대했습니다.
주요 운영 지표로는 5.1%의 안정적인 계약금, 44.6개월의 평균 원금 기간, 기후 사건으로 인한 연체율 3.7%의 소폭 증가가 있습니다. SG&A 비용은 최근 인수로 인해 4,650만 달러로 증가했습니다.
America's Car-Mart (NASDAQ: CRMT) a annoncé de bons résultats pour le troisième trimestre de l'exercice 2025, avec des améliorations notables dans plusieurs indicateurs clés. Le chiffre d'affaires total a augmenté de 8,7%, soutenu par une hausse de 13,2% des volumes de vente, atteignant 13 198 unités, malgré une baisse de 0,9% du prix de vente au détail moyen. Le prix de vente au détail moyen des véhicules était de 17 310 $.
La marge brute s'est améliorée de 150 points de base pour atteindre 35,7%, bénéficiant d'une meilleure acquisition et disposition des véhicules. Les créances irrécouvrables ont diminué à 6,1% contre 6,8%, tandis que la provision pour pertes sur créances a diminué à 24,31%. L'entreprise a complété une titrisation de 200 millions de dollars avec un taux de coupon de 6,49% et a élargi sa ligne de crédit ABL à 350 millions de dollars.
Les indicateurs opérationnels notables comprennent des acomptes stables à 5,1%, une durée moyenne d'origine de 44,6 mois et une légère augmentation des retards de paiement à 3,7% en raison d'événements météorologiques. Les dépenses SG&A ont augmenté à 46,5 millions de dollars, en partie en raison de récentes acquisitions.
America's Car-Mart (NASDAQ: CRMT) hat starke Ergebnisse für das dritte Quartal des Geschäftsjahres 2025 gemeldet, mit bemerkenswerten Verbesserungen in wichtigen Kennzahlen. Der Gesamtumsatz stieg um 8,7%, was durch einen Anstieg der Verkaufszahlen um 13,2% auf 13.198 Einheiten unterstützt wurde, obwohl der durchschnittliche Verkaufspreis im Einzelhandel um 0,9% sank. Der durchschnittliche Verkaufspreis für Fahrzeuge betrug $17.310.
Die Bruttogewinnmarge verbesserte sich um 150 Basispunkte auf 35,7%, was von einer verbesserten Fahrzeugbeschaffung und -veräußertung profitierte. Die Nettoausfälle verbesserten sich auf 6,1% von 6,8%, während die Rückstellungen für Kreditausfälle auf 24,31% sanken. Das Unternehmen schloss eine Verbriefung in Höhe von 200 Millionen Dollar mit einem Kupon von 6,49% ab und erweiterte seine ABL-Fazilität auf 350 Millionen Dollar.
Bemerkenswerte betriebliche Kennzahlen umfassen stabile Anzahlungen von 5,1%, eine durchschnittliche Laufzeit von 44,6 Monaten und einen leichten Anstieg der Zahlungsausfälle auf 3,7% aufgrund von Wetterereignissen. Die SG&A-Ausgaben stiegen auf 46,5 Millionen Dollar, teilweise aufgrund von jüngsten Akquisitionen.
- Revenue growth of 8.7% year-over-year
- Sales volume increased 13.2% to 13,198 units
- Gross profit margin improved 150 basis points to 35.7%
- Net charge-offs improved to 6.1% from 6.8%
- Secured $200M securitization with improved 6.49% coupon rate
- ABL facility expanded to $350M
- 0.9% decrease in average retail sales price
- Delinquencies increased 40 basis points to 3.7%
- SG&A expenses increased to $46.5M from $43.6M
- SG&A per average customer rose 6.7% to $449
Insights
America's Car-Mart delivered a mixed Q3 FY2025 with several encouraging operational improvements amid ongoing challenges in the subprime auto lending space. The 8.7% revenue growth driven primarily by a substantial 13.2% increase in units sold demonstrates recovering sales momentum following previous underwriting restrictions.
Credit performance metrics show measured improvement, with net charge-offs declining to 6.1% from 6.8% year-over-year and the allowance for credit losses improving to 24.31% from 24.72% sequentially. This improvement likely stems from the company's loan origination system implementation, which now covers 58% of the outstanding portfolio balance.
However, the 40 basis point increase in delinquencies to 3.7% warrants monitoring, even with the weather-related explanation provided. The company is also showing subtle signs of term extension, with average loan terms increasing to 44.6 months from 43.3 while maintaining consistent down payment percentages at 5.1%.
From a capital structure perspective, Car-Mart has meaningfully strengthened its position. The completed $200 million securitization at a 6.49% coupon (95 basis points improvement from October) and 10x oversubscription signals strong institutional confidence. Additionally, the expanded $350 million ABL facility with extended maturity provides enhanced financial flexibility.
The 150 basis point gross margin improvement to 35.7% reflects successful vehicle procurement strategies, although higher accident protection plan claims partially offset these gains. Meanwhile, SG&A expenses increased 6.7% per customer, primarily driven by recent acquisitions that have yet to build their customer bases to scale.
Car-Mart's Q3 results reveal an evolving risk profile with several notable improvements but persistent challenges. The company's credit metrics show a bifurcated pattern worth unpacking for investors.
The improvement in net charge-offs to 6.1% represents meaningful progress in loss mitigation, particularly given the challenging economic environment for subprime consumers. The decline in the allowance for credit losses to 24.31% suggests management's increasing confidence in portfolio performance, specifically from loans originated through their new underwriting system.
However, the 40 basis point rise in delinquencies to 3.7% introduces an element of caution. While attributed to weather events with subsequent improvement noted, this metric requires close monitoring as an early warning indicator. The company is also gradually extending loan terms (now 44.6 months), which typically increases long-term default risk.
The capital markets developments are decidedly positive. The $200 million securitization with 95 basis point coupon improvement and substantial oversubscription demonstrates strengthening institutional confidence in Car-Mart's receivables quality. The expanded ABL facility to $350 million significantly enhances liquidity optionality.
The leverage metrics warrant attention, with debt to finance receivables increasing to 53.5% from 51.8% year-over-year. While not alarming, this uptick combined with portfolio growth and increased inventory levels ($36.5 million) suggests an expanding balance sheet that will require disciplined risk management, particularly if consumer credit conditions deteriorate.
ROGERS, Ark., March 06, 2025 (GLOBE NEWSWIRE) -- America’s Car-Mart, Inc. (NASDAQ: CRMT) (“we,” “Car-Mart” or the “Company”), today reported financial results for the third quarter ended January 31, 2025.
Third Quarter Key Highlights (FY’25 Q3 vs. FY’24 Q3, unless otherwise noted)
| ||
President and CEO Doug Campbell commentary:
“We continue to strengthen our business by enhancing our financial flexibility, improving our operational and technology capabilities, and adding proven leaders to our team which allowed us to grow volumes, gross margin, and minimize losses during the quarter. Both our amended ABL facility and most recent ABS transaction have further advanced our capital position and provide a foundation for further development of a competitive funding structure going forward. Our LOS has transformed our underwriting with meaningfully improved credit performance, which gives us tremendous confidence in our ability to support both current and future customers. I would also like to thank our associates who are helping our customers navigate the current environment.”
| Third Quarter Fiscal Year 2025 Key Operating Metrics |
Dollars in thousands, except per share data. Dollar and percentage changes may not recalculate due to rounding. Charts may not be to scale.
| Third Quarter Business Review |
Note: Discussions in each section provide information for the third quarter of fiscal year 2025 compared to the third quarter of fiscal year 2024, unless otherwise noted.
TOTAL REVENUE – An
SALES – Sales volumes increased
GROSS PROFIT – Gross profit margin as a percentage of sales was
NET CHARGE-OFFS – Net charge-offs as a percentage of average finance receivables improved to
ALLOWANCE FOR CREDIT LOSSES – The allowance for credit losses as a percentage of finance receivables, net of deferred revenue and pending accident protection plan claims, improved to
UNDERWRITING – The average down payment, as a percentage of the average retail sales price, remained stable and was
SG&A EXPENSE – SG&A expense was
LEVERAGE & LIQUIDITY –Debt to finance receivables and debt, net of cash, to finance receivables (non-GAAP)1 were
FINANCINGS – On January 31, 2025, the Company completed a term securitization transaction involving the issuance of
Additionally, as previously reported, following the completion of the third quarter, on February 28, 2025, the Company entered into an amendment to its existing asset-based lending revolving credit facility (“ABL Facility”) that expanded the total available borrowings under the facility to
ANNUAL CASH-ON-CASH RETURNS – The Company continues to generate solid cash-on-cash returns.
The following table sets forth the actual and projected cash-on-cash returns as of January 31, 2025, for the Company’s finance receivables by origination year. The return percentages provided for contracts originated in fiscal years 2017 through 2020 reflect the Company’s actual cash-on-cash returns.
| Cash on Cash Return | |||||
| Loan Origination Year | % of A/R Remaining | Current Projected/Actual | Prior Projected | Variance | |
| FY2017 | * | * | |||
| FY2018 | * | * | |||
| FY2019 | * | * | |||
| FY2020 | * | * | |||
| FY2021 | - | ||||
| FY2022 | - | ||||
| FY2023 | - | ||||
| FY2024 | - | ||||
| FY2025 | |||||
| * 2017 -2020 Pools' Current Projection reflects actual cash on cash return | |||||
1 Calculation of this non-GAAP financial measure and a reconciliation to the most directly comparable GAAP measure are included in the tables accompanying this release
2 “Cash-on-cash returns” represent the return on cash invested by the Company in the vehicle finance loans the Company originates and is calculated with respect to a pool of loans (or finance receivables) by dividing total “cash in” less “cash out” by total “cash out” with respect to such pool. “Cash in” represents the total cash the Company expects to collect on the pool of finance receivables, including credit losses. This includes down-payments, principal and interest collected (including special and seasonal payments) and the fair market value of repossessed vehicles, if applicable. “Cash out” includes purchase price paid by the Company to acquire the vehicle (including reconditioning and transportation costs), and all other post-sale expenses as well as expenses related to our ancillary products. The calculation assumes estimates on expected credit losses net of fair market value of repossessed vehicles and the related timing of such losses as well as post sales repair expenses and special payments. The Company evaluates and updates expected credit losses quarterly. The credit quality of each pool is monitored and compared to prior and initial forecasts and is reflected in our on-going internal cash-on-cash projections.
| Key Operating Results |
| Three Months Ended | ||||||||||||
| January 31, | ||||||||||||
| 2025 | 2024 | % Change | ||||||||||
| Operating Data: | ||||||||||||
| Retail units sold | 13,198 | 11,664 | 13.2 | % | ||||||||
| Average number of stores in operation | 154 | 154 | - | |||||||||
| Average retail units sold per store per month | 28.6 | 25.2 | 13.5 | |||||||||
| Average retail sales price | $ | 19,275 | $ | 19,455 | (0.9 | ) | ||||||
| Total gross profit per retail unit sold | $ | 7,131 | $ | 7,043 | 1.2 | |||||||
| Total gross profit percentage | 35.7 | % | 34.2 | % | ||||||||
| Same store revenue growth | 3.1 | % | (9.3 | )% | ||||||||
| Net charge-offs as a percent of average finance receivables | 6.1 | % | 6.8 | % | ||||||||
| Total collected (principal, interest and late fees), in thousands | $ | 176,338 | $ | 167,664 | 5.2 | |||||||
| Average total collected per active customer per month | $ | 568 | $ | 540 | 5.2 | |||||||
| Average percentage of finance receivables-current (excl. 1-2 day) | 81.3 | % | 80.4 | % | ||||||||
| Average down-payment percentage | 5.1 | % | 5.1 | % | ||||||||
| Nine Months Ended | ||||||||||||
| January 31, | ||||||||||||
| 2025 | 2024 | % Change | ||||||||||
| Operating Data: | ||||||||||||
| Retail units sold | 41,373 | 42,738 | (3.2 | ) | % | |||||||
| Average number of stores in operation | 155 | 154 | 0.6 | |||||||||
| Average retail units sold per store per month | 29.7 | 30.8 | (3.6 | ) | ||||||||
| Average retail sales price | $ | 19,531 | $ | 19,062 | 2.5 | |||||||
| Total gross profit per retail unit sold | $ | 7,429 | $ | 6,867 | 8.2 | |||||||
| Total gross profit percentage | 36.7 | % | 34.4 | % | ||||||||
| Same store revenue growth | (5.2 | )% | 1.0 | % | ||||||||
| Net charge-offs as a percent of average finance receivables | 19.1 | % | 20.0 | % | ||||||||
| Total collected (principal, interest and late fees), in thousands | $ | 522,988 | $ | 501,692 | 4.2 | |||||||
| Average total collected per active customer per month | $ | 563 | $ | 536 | 5.1 | |||||||
| Average percentage of finance receivables-current (excl. 1-2 day) | 81.3 | % | 80.4 | % | ||||||||
| Average down-payment percentage | 5.2 | % | 5.0 | % | ||||||||
| Period End Data: | ||||||||||||
| Stores open | 154 | 154 | - | % | ||||||||
| Accounts over 30 days past due | 3.7 | % | 3.3 | % | ||||||||
| Active customer count | 103,663 | 102,175 | 1.5 | |||||||||
| Principal balance of finance receivables (in thousands) | $ | 1,485,981 | $ | 1,428,908 | 4.0 | |||||||
| Weighted average total contract term | 48.3 | 47.6 | 1.5 | |||||||||
| Conference Call and Webcast |
The Company will hold a conference call to discuss its quarterly results on Thursday, March 6, at 9:00 am ET. Participants may access the conference call via webcast using this link: Webcast Link. To participate via telephone, please register in advance using this Registration Link. Upon registration, all telephone participants will receive a one-time confirmation email detailing how to join the conference call, including the dial-in number along with a unique PIN that can be used to access the call. All participants are encouraged to dial in 10 minutes prior to the start time. A replay and transcript of the conference call and webcast will be available on-demand for 12 months.
| About America’s Car-Mart, Inc. |
America’s Car-Mart, Inc. (the “Company”) operates automotive dealerships in 12 states and is one of the largest publicly held automotive retailers in the United States focused exclusively on the “Integrated Auto Sales and Finance” segment of the used car market. The Company emphasizes superior customer service and the building of strong personal relationships with its customers. The Company operates its dealerships primarily in smaller cities throughout the South-Central United States, selling quality used vehicles and providing financing for substantially all of its customers. For more information about America’s Car-Mart, including investor presentations, please visit our website at www.car-mart.com.
| Non-GAAP Financial Measures |
This news release contains financial information determined by methods other than in accordance with generally accepted accounting principles (GAAP). We present total debt, net of total cash, to finance receivables, a non-GAAP measure, as a supplemental measure of our performance. We believe total debt, net of total cash, to finance receivables is a useful measure to monitor leverage and evaluate balance sheet risk. This measure should not be considered in isolation or as a substitute for reported GAAP results because it may include or exclude certain items as compared to similar GAAP-based measures, and such measures may not be comparable to similarly-titled measures reported by other companies. We strongly encourage investors to review our consolidated financial statements included in publicly filed reports in their entirety and not rely solely on any one, single financial measure or communication. The most directly comparable GAAP financial measure, as well as a reconciliation to the comparable GAAP financial measure, for non-GAAP financial measures are presented in the tables of this release.
| Forward-Looking Statements |
This news release contains “forward-looking statements” within the meaning of the Private Securities Litigation Reform Act of 1995. These forward-looking statements address the Company’s future objectives, plans and goals, as well as the Company’s intent, beliefs and current expectations and projections regarding future operating performance and can generally be identified by words such as “may,” “will,” “should,” “could,” “expect,” “anticipate,” “intend,” “plan,” “project,” “foresee,” and other similar words or phrases. Specific events addressed by these forward-looking statements may include, but are not limited to:
- operational infrastructure investments;
- same dealership sales and revenue growth;
- customer growth and engagement;
- gross profit percentages;
- gross profit per retail unit sold;
- business acquisitions;
- inventory acquisition, reconditioning, transportation, and remarketing;
- technological investments and initiatives;
- future revenue growth;
- receivables growth as related to revenue growth;
- new dealership openings;
- performance of new dealerships;
- interest rates;
- future credit losses;
- the Company’s collection results, including but not limited to collections during income tax refund periods;
- cash-on-cash returns from the collection of contracts originated by the Company
- seasonality; and
- the Company’s business, operating and growth strategies and expectations.
These forward-looking statements are based on the Company’s current estimates and assumptions and involve various risks and uncertainties. As a result, you are cautioned that these forward-looking statements are not guarantees of future performance, and that actual results could differ materially from those projected in these forward-looking statements. Factors that may cause actual results to differ materially from the Company’s projections include, but are not limited to:
- general economic conditions in the markets in which the Company operates, including but not limited to fluctuations in gas prices, grocery prices and employment levels and inflationary pressure on operating costs;
- the availability of quality used vehicles at prices that will be affordable to our customers, including the impacts of changes in new vehicle production and sales;
- the ability to leverage the Cox Automotive services agreement to perform reconditioning and improve vehicle quality to reduce the average vehicle cost, improve gross margins, reduce credit loss, and enhance cash flow;
- the availability of credit facilities and access to capital through securitization financings or other sources on terms acceptable to us, and any increase in the cost of capital, to support the Company’s business;
- the Company’s ability to underwrite and collect its contracts effectively, including whether anticipated benefits from the Company’s recently implemented loan origination system are achieved as expected or at all;
- competition;
- dependence on existing management;
- ability to attract, develop, and retain qualified general managers;
- changes in consumer finance laws or regulations, including but not limited to rules and regulations that have recently been enacted or could be enacted by federal and state governments;
- the ability to keep pace with technological advances and changes in consumer behavior affecting our business;
- security breaches, cyber-attacks, or fraudulent activity;
- the ability to identify and obtain favorable locations for new or relocated dealerships at reasonable cost;
- the ability to successfully identify, complete and integrate new acquisitions;
- the occurrence and impact of any adverse weather events or other natural disasters affecting the Company’s dealerships or customers; and
- potential business and economic disruptions and uncertainty that may result from any future public health crises and any efforts to mitigate the financial impact and health risks associated with such developments.
Additionally, risks and uncertainties that may affect future results include those described from time to time in the Company’s SEC filings. The Company undertakes no obligation to update or revise any forward-looking statements, whether as a result of new information, future events or otherwise. Readers are cautioned not to place undue reliance on these forward-looking statements, which speak only as of the dates on which they are made.
| Contact for information |
Vickie Judy, CFO
479-464-9944
Investor_relations@car-mart.com
SM Berger & Company
Andrew Berger, Managing Director
andrew@smberger.com
(216) 464-6400
| America’s Car-Mart Consolidated Results of Operations | |||||||||||||||||||||||
| (Amounts in thousands, except per share data) | |||||||||||||||||||||||
| As a % of Sales | |||||||||||||||||||||||
| Three Months Ended | Three Months Ended | ||||||||||||||||||||||
| January 31, | January 31, | ||||||||||||||||||||||
| 2025 | 2024 | % Change | 2025 | 2024 | |||||||||||||||||||
| Statements of Operations: | |||||||||||||||||||||||
| Revenues: | |||||||||||||||||||||||
| Sales | $ | 263,484 | $ | 240,401 | 9.6 | % | 100.0 | % | 100.0 | % | |||||||||||||
| Interest income | 62,242 | 59,213 | 5.1 | 23.6 | 24.6 | ||||||||||||||||||
| Total | 325,726 | 299,614 | 8.7 | 123.6 | 124.6 | ||||||||||||||||||
| . | |||||||||||||||||||||||
| Costs and expenses: | |||||||||||||||||||||||
| Cost of sales | 169,374 | 158,250 | 7.0 | 64.3 | 65.8 | ||||||||||||||||||
| Selling, general and administrative | 46,460 | 43,562 | 6.7 | 17.6 | 18.1 | ||||||||||||||||||
| Provision for credit losses | 86,652 | 89,582 | (3.3 | ) | 32.9 | 37.3 | |||||||||||||||||
| Interest expense | 16,923 | 16,731 | 1.1 | 6.4 | 7.0 | ||||||||||||||||||
| Depreciation and amortization | 1,890 | 1,712 | 10.4 | 0.7 | 0.7 | ||||||||||||||||||
| Loss on disposal of property and equipment | 37 | 119 | (68.9 | ) | - | - | |||||||||||||||||
| Total | 321,336 | 309,956 | 3.7 | 121.9 | 128.9 | ||||||||||||||||||
| Income (loss) before taxes | 4,390 | (10,342 | ) | 1.7 | (4.3 | ) | |||||||||||||||||
| Provision (benefit) for income taxes | 1,228 | (1,800 | ) | 0.5 | (0.7 | ) | |||||||||||||||||
| Net income (loss) | $ | 3,162 | $ | (8,542 | ) | 1.2 | (3.6 | ) | |||||||||||||||
| Dividends on subsidiary preferred stock | $ | (10 | ) | $ | (10 | ) | |||||||||||||||||
| Net income (loss) attributable to common shareholders | $ | 3,152 | $ | (8,552 | ) | ||||||||||||||||||
| Earnings per share: | |||||||||||||||||||||||
| Basic | $ | 0.38 | $ | (1.34 | ) | ||||||||||||||||||
| Diluted | $ | 0.37 | $ | (1.34 | ) | ||||||||||||||||||
| Weighted average number of shares used in calculation: | |||||||||||||||||||||||
| Basic | 8,256,681 | 6,393,080 | |||||||||||||||||||||
| Diluted | 8,413,088 | 6,393,080 | |||||||||||||||||||||
| America’s Car-Mart Consolidated Results of Operations | |||||||||||||||||||||||
| (Amounts in thousands, except per share data) | |||||||||||||||||||||||
| As a % of Sales | |||||||||||||||||||||||
| Nine Months Ended | Nine Months Ended | ||||||||||||||||||||||
| January 31, | January 31, | ||||||||||||||||||||||
| 2025 | 2024 | % Change | 2025 | 2024 | |||||||||||||||||||
| Statements of Operations: | |||||||||||||||||||||||
| Revenues: | |||||||||||||||||||||||
| Sales | $ | 836,506 | $ | 854,170 | (2.1 | ) | % | 100.0 | % | 100.0 | % | ||||||||||||
| Interest income | 184,252 | 175,051 | 5.3 | 22.0 | 20.5 | ||||||||||||||||||
| Total | 1,020,758 | 1,029,221 | (0.8 | ) | 122.0 | 120.5 | |||||||||||||||||
| Costs and expenses: | |||||||||||||||||||||||
| Cost of sales | 529,159 | 560,692 | (5.6 | ) | 63.3 | 65.6 | |||||||||||||||||
| Selling, general and administrative | 140,578 | 134,895 | 4.2 | 16.8 | 15.8 | ||||||||||||||||||
| Provision for credit losses | 281,597 | 321,300 | (12.4 | ) | 33.7 | 37.6 | |||||||||||||||||
| Interest expense | 53,277 | 47,587 | 12.0 | 6.4 | 5.6 | ||||||||||||||||||
| Depreciation and amortization | 5,700 | 5,101 | 11.7 | 0.6 | 0.6 | ||||||||||||||||||
| Loss on disposal of property and equipment | 124 | 359 | (65.5 | ) | - | - | |||||||||||||||||
| Total | 1,010,435 | 1,069,934 | (5.6 | ) | 120.8 | 125.2 | |||||||||||||||||
| Income (loss) before taxes | 10,323 | (40,713 | ) | 1.2 | (4.7 | ) | |||||||||||||||||
| Provision (benefit) for income taxes | 3,026 | (8,894 | ) | 0.4 | (1.0 | ) | |||||||||||||||||
| Net income (loss) | $ | 7,297 | $ | (31,819 | ) | 0.8 | (3.7 | ) | |||||||||||||||
| Dividends on subsidiary preferred stock | $ | (30 | ) | $ | (30 | ) | |||||||||||||||||
| Net income (loss) attributable to common shareholders | $ | 7,267 | $ | (31,849 | ) | ||||||||||||||||||
| Earnings per share: | |||||||||||||||||||||||
| Basic | $ | 0.96 | $ | (4.99 | ) | ||||||||||||||||||
| Diluted | $ | 0.94 | $ | (4.99 | ) | ||||||||||||||||||
| Weighted average number of shares used in calculation: | |||||||||||||||||||||||
| Basic | 7,600,470 | 6,386,997 | |||||||||||||||||||||
| Diluted | 7,753,654 | 6,386,997 | |||||||||||||||||||||
| America's Car-Mart, Inc. | |||||||||||||
| Condensed Consolidated Balance Sheet and Other Data | |||||||||||||
| (Amounts in thousands, except per share data) | |||||||||||||
| January 31, | April 30, | January 31, | |||||||||||
| 2025 | 2024 | 2024 | |||||||||||
| Cash and cash equivalents | $ | 8,532 | $ | 5,522 | $ | 4,239 | |||||||
| Restricted cash from collections on auto finance receivables | $ | 117,826 | $ | 88,925 | $ | 90,350 | |||||||
| Finance receivables, net | $ | 1,146,212 | $ | 1,098,591 | $ | 1,085,772 | |||||||
| Inventory | $ | 143,933 | $ | 107,470 | $ | 109,313 | |||||||
| Total assets | $ | 1,607,099 | $ | 1,477,644 | $ | 1,466,947 | |||||||
| Revolving lines of credit, net | $ | 73,119 | $ | 200,819 | $ | 55,374 | |||||||
| Notes payable, net | $ | 722,245 | $ | 553,629 | $ | 684,688 | |||||||
| Treasury stock | $ | 298,218 | $ | 297,786 | $ | 297,757 | |||||||
| Total equity | $ | 557,911 | $ | 470,750 | $ | 469,007 | |||||||
| Shares outstanding | 8,256,765 | 6,394,675 | 6,391,061 | ||||||||||
| Book value per outstanding share | $ | 67.62 | $ | 73.68 | $ | 73.45 | |||||||
| Allowance as % of principal balance net of deferred revenue | 24.31 | % | 25.32 | % | 25.74 | % | |||||||
| Changes in allowance for credit losses: | |||||||||||||
| Nine months ended | |||||||||||||
| January 31, | |||||||||||||
| 2025 | 2024 | ||||||||||||
| Balance at beginning of period | $ | 331,260 | $ | 299,608 | |||||||||
| Provision for credit losses | 281,597 | 321,300 | |||||||||||
| Charge-offs, net of collateral recovered | (279,519 | ) | (285,921 | ) | |||||||||
| Balance at end of period | $ | 333,338 | $ | 334,987 | |||||||||
| America's Car-Mart, Inc. | |||||||||
| Condensed Consolidated Statements of Cash Flows | |||||||||
| (Amounts in thousands) | |||||||||
| Nine Months Ended | |||||||||
| January 31, | |||||||||
| 2025 | 2024 | ||||||||
| Operating activities: | |||||||||
| Net income (loss) | $ | 7,297 | $ | (31,819 | ) | ||||
| Provision for credit losses | 281,597 | 321,300 | |||||||
| Losses on claims for accident protection plan | 25,013 | 24,480 | |||||||
| Depreciation and amortization | 5,700 | 5,101 | |||||||
| Finance receivable originations | (779,013 | ) | (794,477 | ) | |||||
| Finance receivable collections | 338,736 | 324,703 | |||||||
| Inventory | 53,330 | 103,451 | |||||||
| Deferred accident protection plan revenue | (1,462 | ) | (1,926 | ) | |||||
| Deferred service contract revenue | (11,818 | ) | (130 | ) | |||||
| Income taxes, net | (4,862 | ) | (10,735 | ) | |||||
| Other | 17,500 | (3,120 | ) | ||||||
| Net cash used in operating activities | (67,982 | ) | (63,172 | ) | |||||
| Investing activities: | |||||||||
| Purchase of investments | (7,527 | ) | (4,815 | ) | |||||
| Purchase of property and equipment and other | (3,065 | ) | (4,514 | ) | |||||
| Net cash used in investing activities | (10,592 | ) | (9,329 | ) | |||||
| Financing activities: | |||||||||
| Change in revolving credit facility, net | (126,752 | ) | (112,522 | ) | |||||
| Payments on notes payable | (479,326 | ) | (394,450 | ) | |||||
| Change in cash overdrafts | 58 | 2,183 | |||||||
| Issuances of notes payable | 649,889 | 610,340 | |||||||
| Debt issuance costs | (6,963 | ) | (5,892 | ) | |||||
| Purchase of common stock | (432 | ) | (336 | ) | |||||
| Dividend payments | (30 | ) | (30 | ) | |||||
| Exercise of stock options and issuance of common stock | 74,041 | (237 | ) | ||||||
| Net cash provided by financing activities | 110,485 | 99,056 | |||||||
| Increase in cash, cash equivalents, and restricted cash | $ | 31,911 | $ | 26,555 | |||||
| America's Car-Mart, Inc. | |||||||||||||
| Reconciliation of Non-GAAP Financial Measures | |||||||||||||
| (Amounts in thousands) | |||||||||||||
| Calculation of Debt, Net of Total Cash, to Finance Receivables: | |||||||||||||
| January 31, 2025 | April 30, 2024 | January 31, 2024 | |||||||||||
| Debt: | |||||||||||||
| Revolving lines of credit, net | $ | 73,119 | $ | 200,819 | $ | 55,374 | |||||||
| Notes payable, net | 722,245 | 553,629 | 684,688 | ||||||||||
| Total debt | $ | 795,364 | $ | 754,448 | $ | 740,062 | |||||||
| Cash: | |||||||||||||
| Cash and cash equivalents | $ | 8,532 | $ | 5,522 | $ | 4,239 | |||||||
| Restricted cash from collections on auto finance receivables | 117,826 | 88,925 | 90,350 | ||||||||||
| Total cash, cash equivalents, and restricted cash | $ | 126,358 | $ | 94,447 | $ | 94,589 | |||||||
| Debt, net of total cash | $ | 669,006 | $ | 660,001 | $ | 645,473 | |||||||
| Principal balance of finance receivables | $ | 1,485,981 | $ | 1,435,388 | $ | 1,428,908 | |||||||
| Ratio of debt to finance receivables | 53.5 | % | 52.6 | % | 51.8 | % | |||||||
| Ratio of debt, net of total cash, to finance receivables | 45.0 | % | 46.0 | % | 45.2 | % | |||||||
Photos accompanying this announcement are available at
https://www.globenewswire.com/NewsRoom/AttachmentNg/0298ffd4-b76d-415a-a10f-c81091532782
https://www.globenewswire.com/NewsRoom/AttachmentNg/d1b76ebe-38ad-4c64-810f-be78437460cd
https://www.globenewswire.com/NewsRoom/AttachmentNg/11909d0f-ecc9-4929-b187-5238ed04ce0b
