Confluent Announces Fourth Quarter and Fiscal Year 2024 Financial Results
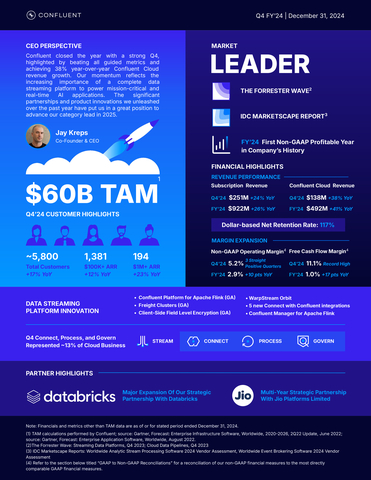
Confluent (CFLT) reported strong Q4 2024 results with subscription revenue reaching $251 million, up 24% year over year, while Confluent Cloud revenue grew 38% to $138 million. For fiscal year 2024, subscription revenue increased 26% to $922 million, with Cloud revenue up 41% to $492 million.
The company achieved significant financial improvements, including a non-GAAP operating income of $13.6 million in Q4 and $27.5 million for FY2024. Free cash flow margin expanded to 11.1% in Q4, up from 3.2% year over year. The company maintains 1,381 customers with $100,000+ in ARR, representing 12% growth.
Looking ahead to FY2025, Confluent projects subscription revenue between $1.117-$1.121 billion and expects a non-GAAP operating margin of approximately 6%, with non-GAAP net income per diluted share of around $0.35.
Confluent (CFLT) ha riportato risultati robusti per il quarto trimestre del 2024, con ricavi da abbonamenti che hanno raggiunto i 251 milioni di dollari, in aumento del 24% rispetto all'anno precedente, mentre i ricavi di Confluent Cloud sono cresciuti del 38% a 138 milioni di dollari. Per l'anno fiscale 2024, i ricavi da abbonamenti sono aumentati del 26% a 922 milioni di dollari, con i ricavi cloud in crescita del 41% a 492 milioni di dollari.
L'azienda ha raggiunto significativi miglioramenti finanziari, includendo un reddito operativo non-GAAP di 13,6 milioni di dollari nel quarto trimestre e 27,5 milioni di dollari per l'anno fiscale 2024. Il margine di flusso di cassa libero si è espanso all'11,1% nel quarto trimestre, in aumento rispetto al 3,2% dell'anno precedente. L'azienda mantiene 1.381 clienti con un ARR superiore ai 100.000 dollari, rappresentando una crescita del 12%.
Guardando avanti all'anno fiscale 2025, Confluent prevede ricavi da abbonamenti tra 1,117 e 1,121 miliardi di dollari e si aspetta un margine operativo non-GAAP di circa il 6%, con un reddito netto non-GAAP per azione diluita di circa 0,35 dollari.
Confluent (CFLT) reportó resultados sólidos en el cuarto trimestre de 2024, con ingresos por suscripción que alcanzaron los 251 millones de dólares, un aumento del 24% año tras año, mientras que los ingresos de Confluent Cloud crecieron un 38% hasta los 138 millones de dólares. Para el año fiscal 2024, los ingresos por suscripción aumentaron un 26% hasta los 922 millones de dólares, con ingresos por la nube creciendo un 41% hasta los 492 millones de dólares.
La compañía logró mejoras financieras significativas, incluyendo un ingreso operativo no-GAAP de 13.6 millones de dólares en el cuarto trimestre y 27.5 millones de dólares para el año fiscal 2024. El margen de flujo de caja libre se expandió al 11.1% en el cuarto trimestre, en comparación con el 3.2% año tras año. La empresa mantiene 1,381 clientes con un ARR superior a 100,000 dólares, representando un crecimiento del 12%.
Mirando hacia el año fiscal 2025, Confluent proyecta ingresos por suscripción entre 1.117 y 1.121 mil millones y espera un margen operativo no-GAAP de aproximadamente el 6%, con un ingreso neto no-GAAP por acción diluida de alrededor de 0.35 dólares.
Confluent (CFLT)는 2024년 4분기 실적이 강력하다고 보고했으며, 구독 수익이 2억 5천 1백만 달러에 달하여 전년 대비 24% 증가했으며, Confluent Cloud 수익은 38% 증가하여 1억 3천 8백만 달러에 달했습니다. 2024 회계연도 동안 구독 수익은 26% 증가하여 9억 2천 2백만 달러에 도달했으며, 클라우드 수익은 41% 증가하여 4억 9천 2백만 달러가 되었습니다.
회사는 4분기 동안 1,360만 달러의 비GAAP 운영 수익과 2024 회계연도 동안 2,750만 달러의 비GAAP 운영 수익을 포함하여 상당한 재정적 개선을 달성했습니다. 자유 현금 흐름 마진은 4분기 11.1%로 확대되어 전년 대비 3.2%에서 증가했습니다. 회사는 1,381명의 고객을 유지하고 있으며, 이들은 10만 달러 이상의 ARR을 갖고 있으며 12%의 증가를 나타냅니다.
2025 회계연도를 앞두고 Confluent는 구독 수익이 11억 1천 7백만 달러에서 11억 2천 1백만 달러 사이로 예상되며, 약 6%의 비GAAP 운영 마진과 희석 주당 약 0.35달러의 비GAAP 순이익을 예상합니다.
Confluent (CFLT) a rapporté de solides résultats pour le quatrième trimestre 2024, avec des revenus d'abonnements atteignant 251 millions de dollars, en hausse de 24 % par rapport à l'année précédente, tandis que les revenus de Confluent Cloud ont augmenté de 38 % pour atteindre 138 millions de dollars. Pour l'année fiscale 2024, les revenus d'abonnements ont augmenté de 26 % pour atteindre 922 millions de dollars, avec des revenus cloud en hausse de 41 % à 492 millions de dollars.
L'entreprise a réalisé d'importantes améliorations financières, y compris un bénéfice d'exploitation non-GAAP de 13,6 millions de dollars au quatrième trimestre et 27,5 millions de dollars pour l'année fiscale 2024. La marge de flux de trésorerie libre est passée à 11,1 % au quatrième trimestre, contre 3,2 % l'année précédente. L'entreprise compte 1.381 clients avec un ARR supérieur à 100 000 dollars, représentant une croissance de 12 %.
En prévision de l'année fiscale 2025, Confluent projette des revenus d'abonnements compris entre 1,117 et 1,121 milliard de dollars et s'attend à une marge d'exploitation non-GAAP d'environ 6 %, avec un bénéfice net non-GAAP par action diluée d'environ 0,35 dollar.
Confluent (CFLT) hat im vierten Quartal 2024 starke Ergebnisse gemeldet, wobei die Abonnementumsätze 251 Millionen Dollar erreichten, was einem Anstieg von 24% im Vergleich zum Vorjahr entspricht, während die Umsätze von Confluent Cloud um 38% auf 138 Millionen Dollar wuchsen. Im Geschäftsjahr 2024 stiegen die Abonnementumsätze um 26% auf 922 Millionen Dollar, wobei die Cloud-Umsätze um 41% auf 492 Millionen Dollar anstiegen.
Das Unternehmen erzielte erhebliche finanzielle Verbesserungen, darunter ein Non-GAAP Betriebsgewinn von 13,6 Millionen Dollar im vierten Quartal und 27,5 Millionen Dollar für das Geschäftsjahr 2024. Die Marge des freien Cashflows erhöhte sich im vierten Quartal auf 11,1%, gegenüber 3,2% im Vorjahr. Das Unternehmen betreut 1.381 Kunden mit über 100.000 Dollar ARR, was einem Wachstum von 12% entspricht.
Für das Geschäftsjahr 2025 rechnet Confluent mit Abonnementumsätzen in einer Spanne von 1,117 bis 1,121 Milliarden Dollar und erwartet eine Non-GAAP Betriebsmarge von etwa 6%, mit einem Non-GAAP Nettogewinn pro verwässerter Aktie von etwa 0,35 Dollar.
- Q4 subscription revenue grew 24% YoY to $251 million
- Confluent Cloud revenue increased 38% YoY to $138 million
- Non-GAAP operating income reached $13.6 million in Q4
- Free cash flow margin improved to 11.1% from 3.2% YoY
- Strong FY2025 guidance with projected subscription revenue of $1.117-$1.121 billion
- GAAP Operating Loss increased to $105.8 million in Q4 from $84.7 million YoY
- GAAP Operating Margin declined to -40.5% from -39.7% YoY
- Customer growth rate with $100k+ ARR slowed to 12% YoY
Insights
Confluent's Q4 2024 results reveal a compelling transformation in its financial profile, marked by three critical developments. First, the company has achieved a remarkable balance between growth and profitability, with subscription revenue growing 24% YoY to $250.6M while maintaining a positive non-GAAP operating margin of
The standout metric is the dramatic improvement in cash flow generation. Free cash flow reached
However, there are notable dynamics in the customer metrics that warrant attention. The 12% YoY growth in customers with $100K+ ARR represents a deceleration from previous quarters, suggesting potential challenges in enterprise expansion. This is partially offset by the robust
Looking ahead, the FY2025 guidance suggests continued momentum with subscription revenue projected between
-
Fourth quarter subscription revenue of
$251 million 24% year over year; Confluent Cloud revenue of$138 million 38% year over year -
Fiscal year 2024 subscription revenue of
$922 million 26% year over year; Confluent Cloud revenue of$492 million 41% year over year -
1,381 customers with
$100,000 12% year over year
Q4 2024 Confluent Infographic (Graphic: Confluent)
“Confluent closed the year with a strong Q4, highlighted by beating all guided metrics and achieving
“Confluent has become a major data platform for the enterprise, with thousands of customers relying on our data streaming platform to win in the era of cloud, data, and AI,” said Rohan Sivaram, CFO, Confluent. “This has enabled an important combination of growth, scale, and double-digit expansion for both operating and free cash flow margins in 2024. Building on this momentum, we are well-positioned to achieve our growth and profitability targets for 2025.”
Fourth Quarter 2024 Financial Highlights (In millions, except per share data and percentages) |
|||
|
Q4 2024 |
Q4 2023 |
Y/Y Change |
Subscription Revenue |
|
|
|
Total Revenue |
|
|
|
GAAP Operating Loss |
|
|
|
Non-GAAP Operating Income |
|
|
|
GAAP Operating Margin |
( |
( |
(0.8) pts |
Non-GAAP Operating Margin |
|
|
(0.1) pts |
GAAP Net Loss Per Share |
|
|
|
Non-GAAP Net Income Per Diluted Share |
|
|
|
Net Cash Provided by Operating Activities |
|
|
|
Free Cash Flow |
|
|
|
Free Cash Flow Margin |
|
|
7.9 pts |
Fiscal Year 2024 Financial Highlights (In millions, except per share data and percentages) |
|||
|
FY 2024 |
FY 2023 |
Y/Y Change |
Subscription Revenue |
|
|
|
Total Revenue |
|
|
|
GAAP Operating Loss |
|
|
|
Non-GAAP Operating Income (Loss) |
|
|
|
GAAP Operating Margin |
( |
( |
18.1 pts |
Non-GAAP Operating Margin |
|
( |
10.3 pts |
GAAP Net Loss Per Share |
|
|
|
Non-GAAP Net Income Per Diluted Share |
|
|
|
Net Cash Provided by (Used in) Operating Activities |
|
|
|
Free Cash Flow |
|
|
|
Free Cash Flow Margin |
|
( |
17.0 pts |
Financial Outlook
For the first quarter and fiscal year 2025, Confluent expects:
|
Q1 2025 Outlook |
FY 2025 Outlook |
Subscription Revenue |
|
|
Non-GAAP Operating Margin |
~ |
~ |
Non-GAAP Net Income Per Diluted Share |
|
|
A reconciliation of forward-looking non-GAAP operating margin, adjusted free cash flow margin and non-GAAP net income per diluted share to the most directly comparable GAAP measures is not available without unreasonable effort, as certain items cannot be reasonably predicted because of their high variability, complexity and low visibility. In particular, the measures and effects of our stock-based compensation-related charges, which include stock-based compensation expenses, employer payroll taxes on employee stock transactions, and amortization of stock-based compensation capitalized in internal-use software, are directly impacted by the timing of employee stock transactions and unpredictable fluctuations in our stock price, which we expect to have a significant impact on our future GAAP financial results.
Conference Call Information
Confluent will host a video webcast to discuss the company’s fourth quarter and fiscal year 2024 results as well as its financial outlook today at 4:30 p.m. Eastern Time/1:30 p.m. Pacific Time. Open to the public, investors may access the webcast, earnings press release, supplemental financial information, and investor presentation on Confluent’s investor relations website at investors.confluent.io before the commencement of the webcast. A replay of the webcast will also be accessible from Confluent’s investor relations website a few hours after the conclusion of the live event.
Confluent uses its investor relations website and may use its X (Twitter), LinkedIn, and Facebook accounts as a means of disclosing material non-public information and for complying with its disclosure obligations under Regulation FD.
Forward-Looking Statements
This press release and the earnings call referencing this press release contain forward-looking statements including, among other things, statements regarding (i) our financial outlook, including expected subscription revenue, Confluent Cloud revenue, non-GAAP operating margin, free cash flow margin, adjusted free cash flow margin, non-GAAP net income per share, revenue mix, including Confluent Cloud subscription revenue mix, revenue run rates, Confluent Cloud and data streaming platform growth, adoption and traction, operating margins and margin improvements, targeted or anticipated gross and operating margin levels, earnings per share levels and improvements, in-product optimizations of Confluent Cloud, continued business momentum, and expected revenue and consumption growth rate and efficient growth, (ii) our market and category leadership position, (iii) our expected investments in research and development and go-to-market functions and anticipated effectiveness and timing of product and pricing innovations, features and functionalities, (iv) our ability to drive efficient growth and rate and pace of investments, including expected resource and capital allocation, (v) our expectations and trends relating to growth of our Data Streaming Platform products, including Confluent Cloud, (vi) rates of Confluent Cloud consumption and demand for and retention of data streaming platforms like Confluent, (vii) our expectations regarding subscription revenue seasonality, (viii) customer growth, retention and engagement, (ix) ability for Confluent Cloud to provide cost savings for users and customers, including lower total cost of ownership, and drive greater monetization of the open source Kafka user base as a result, and our ability to drive return-on-investment-based expansions for our customers, (x) increased adoption of our offerings and fully managed solutions for data streaming in general, including from customers building generative AI applications, (xi) dependence of businesses on data in motion, (xii) growth in and growth rate of revenue, customers, dollar-based net retention rate, and gross retention rate, (xiii) our ability to increase engagement of customers for Confluent and expand customer cohorts, (xiv) our market opportunity and our ability to capture our market opportunity, (xv) the anticipated benefits and overall effectiveness of our transition to a consumption-oriented sales model, (xvi) our go-to-market strategy, (xvii) our product differentiation and market acceptance of our products, (xviii) our strategy and expected results and market acceptance for our Flink offering, Tableflow, and our other Data Streaming Platform offerings, (xix) our expectations for market acceptance, direction and growth of stream processing, its potential to accelerate adoption of our platform and growth of our business, and our ability and positioning to capture this market, (xx) our expectations of meeting near-term and mid-term financial targets, (xxi) our expectations regarding the generative AI landscape and our offerings, (xxii) our expectations of relevance of certain key financial and operating metrics, (xxiii) our ability to drive long-term growth, (xxiv) our expectations regarding the impact of the WarpStream acquisition, (xxv) our expectations regarding our strategic partnerships and alliances, and (xxvi) our overall future prospects. The words “believe,” “may,” “will,” “estimate,” “continue,” “anticipate,” “intend,” “expect,” “seek,” “plan,” “project,” “target,” “looking ahead,” “look to,” “move into,” and similar expressions are intended to identify forward-looking statements. Forward-looking statements represent our current beliefs, estimates and assumptions only as of the date of this press release and information contained in this press release should not be relied upon as representing our estimates as of any subsequent date. These forward-looking statements are subject to risks, uncertainties, and assumptions. If the risks materialize or assumptions prove incorrect, actual results could differ materially from the results implied by these forward-looking statements. Risks include, but are not limited to: (i) our limited operating history, including in uncertain macroeconomic environments, (ii) our ability to sustain and manage our rapid growth, (iii) our ability to increase consumption of our offerings, including by existing customers and through the acquisition of new customers, including by addressing customer consumption preferences, successfully adding new features and functionality to our offerings, and partnering with our customers to help them realize increased value in Confluent in an efficient and sustainable manner, (iv) our ability to successfully execute our go-to-market strategy and initiatives, (v) our ability to attract new customers and successfully ramp their consumption of our offerings, as well as retain and sell additional features and services to our existing customers, (vi) uncertain macroeconomic conditions, including high inflation, high interest rates, bank failures, supply chain challenges, geopolitical events, recessionary risks, and exchange rate fluctuations, which have resulted and may continue to result in reduced consumption of Confluent Cloud, volatility in consumption, including due to customer focus on cloud cost controls and increased efficiency, customer pullback in information technology spending, lengthening of sales cycles, reduced contract sizes, generally increased scrutiny on IT spending from existing and potential customers, or customer preference for open source alternatives, as well as the potential need for cost efficiency measures, (vii) our ability to achieve profitability and improve margins annually, by our expected timelines or at all, (viii) the estimated addressable market opportunity for our Data Streaming Platform, including our Flink offering and stream processing, and our ability to capture our share of that market opportunity, (ix) our ability to compete effectively in an increasingly competitive market, (x) our ability to attract, ramp, and retain highly qualified personnel, and the impacts of attrition and related challenges, (xi) breaches in our security measures, intentional or accidental cybersecurity incidents or unauthorized access to our platform, our data, or our customers’ or other users’ personal data, (xii) our reliance on third-party cloud-based infrastructure to host Confluent Cloud, (xiii) public sector budgetary cycles and funding reductions or delays, (xiv) our ability to accurately forecast our future performance, business and growth, and (xv) general market, political, economic, and business conditions. These risks are not exhaustive. Further information on these and other risks that could affect Confluent’s results is included in our filings with the Securities and Exchange Commission (“SEC”), including our Quarterly Report on Form 10-Q for the quarter ended September 30, 2024, and our future reports that we may file from time to time with the SEC. Additional information will be made available in our Annual Report on Form 10-K for the year ended December 31, 2024 that will be filed with the SEC, which should be read in conjunction with this press release and the financial results included herein. Confluent assumes no obligation to, and does not currently intend to, update or revise any forward-looking statements, whether as a result of new information, future events or otherwise, except as required by law.
Non-GAAP Financial Measures
This press release includes the following non-GAAP financial measures: non-GAAP gross profit, non-GAAP gross margin, non-GAAP operating expenses (research and development, sales and marketing, and general and administrative), non-GAAP operating income (loss), non-GAAP operating margin, non-GAAP net income, non-GAAP net income per share, free cash flow, and free cash flow margin. We use these non-GAAP financial measures and other key metrics internally to facilitate analysis of our financial and business trends and for internal planning and forecasting purposes. We believe these non-GAAP financial measures, when taken collectively, may be helpful to investors because they provide consistency and comparability with past financial performance by excluding certain items that may not be indicative of our business, results of operations, or outlook. However, non-GAAP financial measures have limitations as an analytical tool and are presented for supplemental informational purposes only. They should not be considered in isolation from, or as a substitute for, financial information prepared in accordance with GAAP. In particular, other companies, including companies in our industry, may report non-GAAP gross profit, non-GAAP gross margin, non-GAAP operating expenses (research and development, sales and marketing, general and administrative), non-GAAP operating income (loss), non-GAAP operating margin, non-GAAP net income, non-GAAP net income per share, free cash flow, free cash flow margin, or similarly titled measures but calculate them differently, which reduces their usefulness as comparative measures. Further, free cash flow is not a substitute for cash used in operating activities. The utility of free cash flow is limited as such measure does not reflect our future contractual commitments and does not represent the total increase or decrease in our cash balance for any given period. Investors are encouraged to review the reconciliation of these non-GAAP measures to their most directly comparable GAAP financial measures, as presented below. We define non-GAAP gross profit, non-GAAP gross margin, non-GAAP operating expenses (research and development, sales and marketing, and general and administrative), non-GAAP operating income (loss), non-GAAP operating margin, non-GAAP net income, and non-GAAP net income per share as the respective GAAP measures, adjusted for, as applicable, stock-based compensation-related charges which include stock-based compensation expense, employer taxes on employee stock transactions and amortization of stock-based compensation capitalized in internal-use software; amortization of acquired intangibles; acquisition-related expenses; restructuring and other related charges; amortization of debt issuance costs; and income tax effects associated with these adjustments as well as the non-recurring income tax expense or benefit associated with acquisitions. Non-GAAP gross margin and non-GAAP operating margin are defined as non-GAAP gross profit and non-GAAP operating income (loss) as a percentage of revenue, respectively. We define free cash flow as net cash used in operating activities less capitalized internal-use software costs and capital expenditures and free cash flow margin as free cash flow as a percentage of revenue. We believe that free cash flow and free cash flow margin are useful indicators of liquidity that provide information to management and investors about the performance of core operations and future ability to generate cash that can be used for strategic opportunities or investing in our business.
Definition
Customers with
About Confluent
Confluent is the data streaming platform that is pioneering a fundamentally new category of data infrastructure that sets data in motion. Confluent’s cloud-native offering is the foundational platform for data in motion – designed to be the intelligent connective tissue enabling real-time data, from multiple sources, to constantly stream across the organization. With Confluent, organizations can meet the new business imperative of delivering rich, digital front-end customer experiences and transitioning to sophisticated, real-time, software-driven backend operations.
Confluent, Inc. Condensed Consolidated Balance Sheets (in thousands) (unaudited) |
|||||||
| December 31, | December 31, | ||||||
|
2024 |
|
|
2023 |
|
||
| ASSETS | |||||||
| Current assets: | |||||||
| Cash and cash equivalents | $ |
385,980 |
|
$ |
349,761 |
|
|
| Marketable securities |
|
1,524,583 |
|
|
1,551,009 |
|
|
| Accounts receivable, net |
|
314,306 |
|
|
229,962 |
|
|
| Deferred contract acquisition costs |
|
47,271 |
|
|
43,937 |
|
|
| Prepaid expenses and other current assets |
|
79,179 |
|
|
76,986 |
|
|
| Total current assets |
|
2,351,319 |
|
|
2,251,655 |
|
|
| Property and equipment, net |
|
78,680 |
|
|
54,012 |
|
|
| Operating lease right-of-use assets |
|
8,818 |
|
|
10,061 |
|
|
| Goodwill |
|
164,406 |
|
|
51,998 |
|
|
| Intangible assets, net |
|
7,924 |
|
|
3,492 |
|
|
| Deferred contract acquisition costs, non-current |
|
71,468 |
|
|
75,815 |
|
|
| Other assets, non-current |
|
12,296 |
|
|
13,776 |
|
|
| Total assets | $ |
2,694,911 |
|
$ |
2,460,809 |
|
|
| LIABILITIES AND STOCKHOLDERS’ EQUITY | |||||||
| Current liabilities: | |||||||
| Accounts payable | $ |
7,531 |
|
$ |
6,714 |
|
|
| Accrued expenses and other liabilities |
|
194,250 |
|
|
141,847 |
|
|
| Operating lease liabilities |
|
8,694 |
|
|
7,890 |
|
|
| Deferred revenue |
|
364,604 |
|
|
330,570 |
|
|
| Total current liabilities |
|
575,079 |
|
|
487,021 |
|
|
| Operating lease liabilities, non-current |
|
9,138 |
|
|
17,391 |
|
|
| Deferred revenue, non-current |
|
44,597 |
|
|
22,436 |
|
|
| Convertible senior notes, net |
|
1,092,149 |
|
|
1,088,313 |
|
|
| Other liabilities, non-current |
|
12,722 |
|
|
35,233 |
|
|
| Total liabilities |
|
1,733,685 |
|
|
1,650,394 |
|
|
| Stockholders’ equity: | |||||||
| Preferred stock |
|
- |
|
|
- |
|
|
| Class A common stock |
|
2 |
|
|
2 |
|
|
| Class B common stock |
|
1 |
|
|
1 |
|
|
| Additional paid-in capital |
|
2,953,080 |
|
|
2,453,293 |
|
|
| Accumulated other comprehensive (loss) income |
|
(2,641 |
) |
|
1,270 |
|
|
| Accumulated deficit |
|
(1,989,216 |
) |
|
(1,644,151 |
) |
|
| Total stockholders’ equity |
|
961,226 |
|
|
810,415 |
|
|
| Total liabilities and stockholders’ equity | $ |
2,694,911 |
|
$ |
2,460,809 |
|
|
Confluent, Inc. Condensed Consolidated Statements of Operations (in thousands, except share and per share data) (unaudited) |
|||||||||||||||
| Three Months Ended December 31, | Year Ended December 31, | ||||||||||||||
|
2024 |
|
|
2023 |
|
|
2024 |
|
|
2023 |
|
||||
| Revenue: | |||||||||||||||
| Subscription | $ |
250,636 |
|
$ |
202,787 |
|
$ |
922,091 |
|
$ |
729,112 |
|
|||
| Services |
|
10,584 |
|
|
10,397 |
|
|
41,551 |
|
|
47,840 |
|
|||
| Total revenue |
|
261,220 |
|
|
213,184 |
|
|
963,642 |
|
|
776,952 |
|
|||
| Cost of revenue: | |||||||||||||||
| Subscription(1) |
|
55,220 |
|
|
44,807 |
|
|
208,600 |
|
|
176,004 |
|
|||
| Services(1) |
|
12,345 |
|
|
12,250 |
|
|
48,870 |
|
|
53,666 |
|
|||
| Total cost of revenue |
|
67,565 |
|
|
57,057 |
|
|
257,470 |
|
|
229,670 |
|
|||
| Gross profit |
|
193,655 |
|
|
156,127 |
|
|
706,172 |
|
|
547,282 |
|
|||
| Operating expenses: | |||||||||||||||
| Research and development(1) |
|
114,886 |
|
|
86,948 |
|
|
421,237 |
|
|
348,752 |
|
|||
| Sales and marketing(1) |
|
145,194 |
|
|
119,911 |
|
|
547,379 |
|
|
504,929 |
|
|||
| General and administrative(1) |
|
39,359 |
|
|
33,948 |
|
|
156,703 |
|
|
137,520 |
|
|||
| Restructuring and other related charges |
|
- |
|
|
- |
|
|
- |
|
|
34,854 |
|
|||
| Total operating expenses |
|
299,439 |
|
|
240,807 |
|
|
1,125,319 |
|
|
1,026,055 |
|
|||
| Operating loss |
|
(105,784 |
) |
|
(84,680 |
) |
|
(419,147 |
) |
|
(478,773 |
) |
|||
| Other income, net |
|
19,288 |
|
|
21,775 |
|
|
84,486 |
|
|
72,099 |
|
|||
| Loss before income taxes |
|
(86,496 |
) |
|
(62,905 |
) |
|
(334,661 |
) |
|
(406,674 |
) |
|||
| Provision for income taxes |
|
1,558 |
|
|
31,191 |
|
|
10,404 |
|
|
36,072 |
|
|||
| Net loss | $ |
(88,054 |
) |
$ |
(94,096 |
) |
$ |
(345,065 |
) |
$ |
(442,746 |
) |
|||
| Net loss per share, basic and diluted | $ |
(0.27 |
) |
$ |
(0.30 |
) |
$ |
(1.07 |
) |
$ |
(1.47 |
) |
|||
| Weighted-average shares used to compute net loss per share, basic and diluted |
|
329,406,849 |
|
|
309,101,119 |
|
|
321,863,416 |
|
|
300,727,487 |
|
|||
(1) |
|
Includes stock-based compensation-related charges* as follows: |
Three Months Ended December 31, |
Year Ended December 31, |
||||||||||||||
|
2024 |
|
|
2023 |
|
|
2024 |
|
|
2023 |
|
||||
| Cost of revenue - subscription | $ |
9,242 |
$ |
6,309 |
$ |
35,438 |
$ |
26,487 |
|||||||
| Cost of revenue - services |
|
2,384 |
|
|
2,623 |
|
|
9,781 |
|
|
11,488 |
|
|||
| Research and development |
|
45,938 |
|
|
36,972 |
|
|
171,487 |
|
|
143,846 |
|
|||
| Sales and marketing |
|
35,178 |
|
|
31,406 |
|
|
139,929 |
|
|
128,448 |
|
|||
| General and administrative |
|
14,837 |
|
|
12,857 |
|
|
60,466 |
|
|
50,595 |
|
|||
| Total stock-based compensation-related charges | $ |
107,579 |
|
$ |
90,167 |
|
$ |
417,101 |
|
$ |
360,864 |
|
|||
* |
|
Represents stock-based compensation expense, employer taxes on employee stock transactions, and amortization of stock-based compensation capitalized in internal-use software. We began excluding amortization of stock-based compensation capitalized in internal-use software from our non-GAAP measures starting with the quarter ended March 31, 2024. The amounts of amortization of stock-based compensation capitalized in internal-use software were immaterial in both current and prior periods. |
Confluent, Inc. Condensed Consolidated Statements of Cash Flows (in thousands) (unaudited) |
|||||||||||||||
| Three Months Ended December 31, | Year Ended December 31, | ||||||||||||||
|
2024 |
|
|
2023 |
|
|
2024 |
|
|
2023 |
|
||||
| CASH FLOWS FROM OPERATING ACTIVITIES | |||||||||||||||
| Net loss | $ |
(88,054 |
) |
$ |
(94,096 |
) |
$ |
(345,065 |
) |
$ |
(442,746 |
) |
|||
| Adjustments to reconcile net loss to cash provided by (used in) operating activities: | |||||||||||||||
| Depreciation and amortization |
|
6,234 |
|
|
3,923 |
|
|
22,089 |
|
|
13,910 |
|
|||
| Net accretion of discounts on marketable securities |
|
(8,205 |
) |
|
(11,484 |
) |
|
(37,766 |
) |
|
(42,505 |
) |
|||
| Amortization of debt issuance costs |
|
966 |
|
|
963 |
|
|
3,836 |
|
|
3,813 |
|
|||
| Amortization of deferred contract acquisition costs |
|
14,213 |
|
|
12,428 |
|
|
54,258 |
|
|
45,888 |
|
|||
| Non-cash operating lease costs |
|
1,172 |
|
|
874 |
|
|
3,966 |
|
|
3,992 |
|
|||
| Lease abandonment charges |
|
- |
|
|
- |
|
|
- |
|
|
15,667 |
|
|||
| Stock-based compensation, net of amounts capitalized |
|
102,924 |
|
|
88,871 |
|
|
395,660 |
|
|
349,833 |
|
|||
| Deferred income taxes |
|
46 |
|
|
1,864 |
|
|
277 |
|
|
1,889 |
|
|||
| Other |
|
1,675 |
|
|
(756 |
) |
|
3,370 |
|
|
2,358 |
|
|||
| Changes in operating assets and liabilities, net of effects of business combinations: | |||||||||||||||
| Accounts receivable |
|
(36,327 |
) |
|
(47,453 |
) |
|
(86,562 |
) |
|
(53,593 |
) |
|||
| Deferred contract acquisition costs |
|
(15,974 |
) |
|
(21,781 |
) |
|
(53,246 |
) |
|
(61,354 |
) |
|||
| Prepaid expenses and other assets |
|
1,205 |
|
|
3,438 |
|
|
844 |
|
|
(10,387 |
) |
|||
| Accounts payable |
|
(8,159 |
) |
|
4,756 |
|
|
127 |
|
|
(14,452 |
) |
|||
| Accrued expenses and other liabilities |
|
32,861 |
|
|
43,368 |
|
|
25,639 |
|
|
61,333 |
|
|||
| Operating lease liabilities |
|
(4,191 |
) |
|
(1,917 |
) |
|
(10,140 |
) |
|
(7,479 |
) |
|||
| Deferred revenue |
|
34,825 |
|
|
29,237 |
|
|
56,173 |
|
|
30,176 |
|
|||
| Net cash provided by (used in) operating activities |
|
35,211 |
|
|
12,235 |
|
|
33,460 |
|
|
(103,657 |
) |
|||
| CASH FLOWS FROM INVESTING ACTIVITIES | |||||||||||||||
| Capitalization of internal-use software costs |
|
(5,420 |
) |
|
(4,299 |
) |
|
(21,404 |
) |
|
(17,845 |
) |
|||
| Purchases of marketable securities |
|
(367,357 |
) |
|
(351,105 |
) |
|
(1,539,716 |
) |
|
(1,586,693 |
) |
|||
| Sales of marketable securities |
|
2,567 |
|
|
- |
|
|
15,311 |
|
|
- |
|
|||
| Maturities of marketable securities |
|
381,127 |
|
|
374,612 |
|
|
1,591,164 |
|
|
1,578,323 |
|
|||
| Purchases of investments in privately-held companies |
|
- |
|
|
- |
|
|
(2,250 |
) |
|
- |
|
|||
| Purchases of property and equipment |
|
(669 |
) |
|
(1,116 |
) |
|
(2,567 |
) |
|
(2,834 |
) |
|||
| Cash paid for business combinations, net of cash acquired |
|
- |
|
|
(10,000 |
) |
|
(115,516 |
) |
|
(55,802 |
) |
|||
| Net cash provided by (used in) investing activities |
|
10,248 |
|
|
8,092 |
|
|
(74,978 |
) |
|
(84,851 |
) |
|||
| CASH FLOWS FROM FINANCING ACTIVITIES | |||||||||||||||
| Proceeds from issuance of common stock upon exercise of vested options |
|
19,504 |
|
|
10,974 |
|
|
55,836 |
|
|
73,919 |
|
|||
| Repurchases of unvested common stock |
|
- |
|
|
- |
|
|
- |
|
|
(255 |
) |
|||
| Proceeds from issuance of common stock under employee stock purchase plan |
|
- |
|
|
- |
|
|
23,970 |
|
|
28,708 |
|
|||
| Net cash provided by financing activities |
|
19,504 |
|
|
10,974 |
|
|
79,806 |
|
|
102,372 |
|
|||
| Effect of exchange rate changes on cash and cash equivalents |
|
(1,589 |
) |
|
1,417 |
|
|
(2,069 |
) |
|
116 |
|
|||
| Net increase (decrease) in cash and cash equivalents |
|
63,374 |
|
|
32,718 |
|
|
36,219 |
|
|
(86,020 |
) |
|||
| Cash and cash equivalents at beginning of period |
|
322,606 |
|
|
317,043 |
|
|
349,761 |
|
|
435,781 |
|
|||
| Cash and cash equivalents at end of period | $ |
385,980 |
|
$ |
349,761 |
|
$ |
385,980 |
|
$ |
349,761 |
|
|||
Confluent, Inc. Reconciliation of GAAP Measures to Non-GAAP Measures (in thousands, except percentages, share and per share data) (unaudited) |
|||||||||||||||
| Three Months Ended December 31, | Year Ended December 31, | ||||||||||||||
|
2024 |
|
|
2023 |
|
|
2024 |
|
|
2023 |
|
||||
| Reconciliation of GAAP total gross profit to non-GAAP total gross profit: | |||||||||||||||
| Total gross profit on a GAAP basis | $ |
193,655 |
|
$ |
156,127 |
|
$ |
706,172 |
|
$ |
547,282 |
|
|||
| Total gross margin on a GAAP basis |
|
74.1 |
% |
|
73.2 |
% |
|
73.3 |
% |
|
70.4 |
% |
|||
| Add: Stock-based compensation-related charges |
|
11,626 |
|
|
8,932 |
|
|
45,219 |
|
|
37,975 |
|
|||
| Add: Amortization of acquired intangibles |
|
780 |
|
|
195 |
|
|
2,368 |
|
|
564 |
|
|||
| Non-GAAP total gross profit | $ |
206,061 |
|
$ |
165,254 |
|
$ |
753,759 |
|
$ |
585,821 |
|
|||
| Non-GAAP total gross margin |
|
78.9 |
% |
|
77.5 |
% |
|
78.2 |
% |
|
75.4 |
% |
|||
| Reconciliation of GAAP operating expenses to non-GAAP operating expenses: | |||||||||||||||
| Research and development operating expense on a GAAP basis | $ |
114,886 |
|
$ |
86,948 |
|
$ |
421,237 |
|
$ |
348,752 |
|
|||
| Research and development operating expense as a percentage of total revenue on a GAAP basis |
|
44.0 |
% |
|
40.8 |
% |
|
43.7 |
% |
|
44.9 |
% |
|||
| Less: Stock-based compensation-related charges |
|
45,938 |
|
|
36,972 |
|
|
171,487 |
|
|
143,846 |
|
|||
| Less: Acquisition-related expenses |
|
10,046 |
|
|
3,841 |
|
|
24,750 |
|
|
19,203 |
|
|||
| Non-GAAP research and development operating expense | $ |
58,902 |
|
$ |
46,135 |
|
$ |
225,000 |
|
$ |
185,703 |
|
|||
| Non-GAAP research and development operating expense as a percentage of total revenue |
|
22.5 |
% |
|
21.6 |
% |
|
23.3 |
% |
|
23.9 |
% |
|||
| Sales and marketing operating expense on a GAAP basis | $ |
145,194 |
|
$ |
119,911 |
|
$ |
547,379 |
|
$ |
504,929 |
|
|||
| Sales and marketing operating expense as a percentage of total revenue on a GAAP basis |
|
55.6 |
% |
|
56.2 |
% |
|
56.8 |
% |
|
65.0 |
% |
|||
| Less: Stock-based compensation-related charges |
|
35,178 |
|
|
31,406 |
|
|
139,929 |
|
|
128,448 |
|
|||
| Less: Acquisition-related expenses |
|
717 |
|
|
1,076 |
|
|
717 |
|
|
4,304 |
|
|||
| Non-GAAP sales and marketing operating expense | $ |
109,299 |
|
$ |
87,429 |
|
$ |
406,733 |
|
$ |
372,177 |
|
|||
| Non-GAAP sales and marketing operating expense as a percentage of total revenue |
|
41.8 |
% |
|
41.0 |
% |
|
42.2 |
% |
|
47.9 |
% |
|||
| General and administrative operating expense on a GAAP basis | $ |
39,359 |
|
$ |
33,948 |
|
$ |
156,703 |
|
$ |
137,520 |
|
|||
| General and administrative operating expense as a percentage of total revenue on a GAAP basis |
|
15.1 |
% |
|
15.9 |
% |
|
16.3 |
% |
|
17.7 |
% |
|||
| Less: Stock-based compensation-related charges |
|
14,837 |
|
|
12,857 |
|
|
60,466 |
|
|
50,595 |
|
|||
| Less: Acquisition-related expenses |
|
302 |
|
|
650 |
|
|
1,702 |
|
|
1,640 |
|
|||
| Non-GAAP general and administrative operating expense | $ |
24,220 |
|
$ |
20,441 |
|
$ |
94,535 |
|
$ |
85,285 |
|
|||
| Non-GAAP general and administrative operating expense as a percentage of total revenue |
|
9.3 |
% |
|
9.6 |
% |
|
9.8 |
% |
|
11.0 |
% |
|||
| Three Months Ended December 31, | Year Ended December 31, | ||||||||||||||
|
2024 |
|
|
2023 |
|
|
2024 |
|
|
2023 |
|
||||
| Reconciliation of GAAP operating loss to non-GAAP operating income (loss): | |||||||||||||||
| Operating loss on a GAAP basis | $ |
(105,784 |
) |
$ |
(84,680 |
) |
$ |
(419,147 |
) |
$ |
(478,773 |
) |
|||
| GAAP operating margin |
|
(40.5 |
%) |
|
(39.7 |
%) |
|
(43.5 |
%) |
|
(61.6 |
%) |
|||
| Add: Stock-based compensation-related charges |
|
107,579 |
|
|
90,167 |
|
|
417,101 |
|
|
360,864 |
|
|||
| Add: Amortization of acquired intangibles |
|
780 |
|
|
195 |
|
|
2,368 |
|
|
564 |
|
|||
| Add: Acquisition-related expenses |
|
11,065 |
|
|
5,567 |
|
|
27,169 |
|
|
25,147 |
|
|||
| Add: Restructuring and other related charges |
|
- |
|
|
- |
|
|
- |
|
|
34,854 |
|
|||
| Non-GAAP operating income (loss) | $ |
13,640 |
|
$ |
11,249 |
|
$ |
27,491 |
|
($ |
57,344 |
) |
|||
| Non-GAAP operating margin |
|
5.2 |
% |
|
5.3 |
% |
|
2.9 |
% |
|
(7.4 |
%) |
|||
| Reconciliation of GAAP net loss to non-GAAP net income: | |||||||||||||||
| Net loss on a GAAP basis | $ |
(88,054 |
) |
$ |
(94,096 |
) |
$ |
(345,065 |
) |
$ |
(442,746 |
) |
|||
| Add: Stock-based compensation-related charges |
|
107,579 |
|
|
90,167 |
|
|
417,101 |
|
|
360,864 |
|
|||
| Add: Amortization of acquired intangibles |
|
780 |
|
|
195 |
|
|
2,368 |
|
|
564 |
|
|||
| Add: Acquisition-related expenses |
|
11,065 |
|
|
5,567 |
|
|
27,169 |
|
|
25,147 |
|
|||
| Add: Restructuring and other related charges |
|
- |
|
|
- |
|
|
- |
|
|
34,854 |
|
|||
| Add: Amortization of debt issuance costs |
|
966 |
|
|
963 |
|
|
3,836 |
|
|
3,813 |
|
|||
| Add: Income tax effects and adjustments(1) |
|
(1,272 |
) |
|
29,373 |
|
|
(3,236 |
) |
|
30,570 |
|
|||
| Non-GAAP net income | $ |
31,064 |
|
$ |
32,169 |
|
$ |
102,173 |
|
$ |
13,066 |
|
|||
| Non-GAAP net income per share, basic | $ |
0.09 |
|
$ |
0.10 |
|
$ |
0.32 |
|
$ |
0.04 |
|
|||
| Non-GAAP net income per share, diluted | $ |
0.09 |
|
$ |
0.09 |
|
$ |
0.29 |
|
$ |
0.04 |
|
|||
| Weighted-average shares used to compute non-GAAP net income per share, basic |
|
329,406,849 |
|
|
309,101,119 |
|
|
321,863,416 |
|
|
300,727,487 |
|
|||
| Weighted-average shares used to compute non-GAAP net income per share, diluted |
|
362,149,550 |
|
|
342,370,878 |
|
|
355,067,359 |
|
|
339,567,823 |
|
|||
(1) |
|
Income tax effects and adjustments for the three months ended and year ended December 31, 2023 primarily consist of income tax expense related to an intra-group transfer of acquired intellectual property. |
The following table presents a reconciliation of free cash flow to net cash provided by (used in) operating activities, the most directly comparable GAAP measure, for each of the periods indicated (unaudited, in thousands, except percentages):
| Three Months Ended December 31, | Year Ended December 31, | ||||||||||||||
|
2024 |
|
|
2023 |
|
|
2024 |
|
|
2023 |
|
||||
| Net cash provided by (used in) operating activities | $ |
35,211 |
|
$ |
12,235 |
|
$ |
33,460 |
|
$ |
(103,657 |
) |
|||
| Capitalized internal-use software costs |
|
(5,420 |
) |
|
(4,299 |
) |
|
(21,404 |
) |
|
(17,845 |
) |
|||
| Capital expenditures |
|
(669 |
) |
|
(1,116 |
) |
|
(2,567 |
) |
|
(2,834 |
) |
|||
| Free cash flow | $ |
29,122 |
|
$ |
6,820 |
|
$ |
9,489 |
|
$ |
(124,336 |
) |
|||
| Free cash flow margin |
|
11.1 |
% |
|
3.2 |
% |
|
1.0 |
% |
|
(16.0 |
%) |
|||
| Net cash provided by (used in) investing activities | $ |
10,248 |
|
$ |
8,092 |
|
$ |
(74,978 |
) |
$ |
(84,851 |
) |
|||
| Net cash provided by financing activities | $ |
19,504 |
|
$ |
10,974 |
|
$ |
79,806 |
|
$ |
102,372 |
|
|||
View source version on businesswire.com: https://www.businesswire.com/news/home/20250210693574/en/
Investor Contact
Shane Xie
investors@confluent.io
Media Contact
Kerry Tuttle
pr@confluent.io
Source: Confluent, Inc.