Adobe Digital Price Index: Online Prices Fall 0.2% in September
In September 2022, Adobe reported online prices decreased 0.2% year-over-year (YoY) but increased 0.8% month-over-month (MoM). Electronics saw significant price drops, with an 11.3% YoY decline, and computer prices fell 14.1% YoY. Conversely, grocery prices hit a record high, rising 14.3% YoY. 11 out of 18 tracked categories experienced YoY price increases, with groceries leading. The Adobe Digital Price Index (DPI) provides insights into online pricing trends across various categories, impacting consumer behavior and e-commerce strategies.
- Groceries prices rose 14.3% YoY, indicating strong demand.
- The Adobe Digital Price Index continues to provide valuable insights into consumer spending patterns.
- Electronics prices fell 11.3% YoY, indicating a potential decline in consumer spending or inventory issues.
- Computer prices decreased 14.1% YoY, marking the largest drop since March 2020.
-
Online prices fell
0.2% on an annual basis in September, while rising0.8% month-over-month - Electronics and computer prices fell sharply, along with modest price decreases in toys and sporting goods
- Grocery prices hit another record high, while pet products and tools/home improvement prices remained elevated

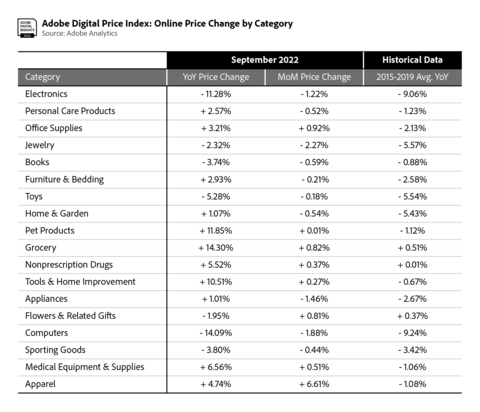
Price Table (Graphic: Business Wire)
Prices for electronics, the largest category in e-commerce with
Prices for food have remained high, with grocery prices rising
The DPI provides the most comprehensive view into how much consumers pay for goods online, as e-commerce expands to new categories and as brands focus on making the digital economy personal. Powered by Adobe Analytics, it analyzes one trillion visits to retail sites and over 100 million SKUs across 18 product categories: electronics, apparel, appliances, books, toys, computers, groceries, furniture/bedding, tools/home improvement, home/garden, pet products, jewelry, medical equipment/supplies, sporting goods, personal care products, flowers/related gifts, non-prescription drugs and office supplies.
In September, 11 of the 18 categories tracked by the DPI saw YoY price increases, with groceries rising the most. Price drops were observed in seven categories: electronics, jewelry, books, toys, flowers/related gifts, computers and sporting goods.
Eight of the 18 categories in the DPI saw price increases MoM. Price drops were observed across ten categories including electronics, personal care products, jewelry, books, furniture/bedding, toys, home/garden, appliances, computers and sporting goods.
Notable Categories in the Adobe Digital Price Index for September:
-
Electronics: Prices were down
11.3% YoY (down1.2% MoM), falling faster than pre-pandemic levels when electronic prices fell9.1% YoY on average between 2015 and 2019. Prices have fallen consistently sinceDec. 2021 (down2.6% YoY) and accelerated in recent months (down10% YoY in August, down9.3% YoY in July). -
Computers: Prices were down
14.1% YoY (down1.9% MoM), the biggest drop since the beginning of the COVID-19 pandemic inMarch 2020 . Computer prices have fallen online for 21 consecutive months, and now outpace pre-pandemic levels when prices fell9.2% on average between 2015 and 2019. -
Groceries: Prices continued to surge and rose
14.3% YoY (up0.8% MoM), more than any other category. It is a new record on an annual basis, following a series of record highs:14.1% YoY increase in August,13.4% YoY increase in July,12.4% YoY increase in June. Grocery prices have risen for 32 consecutive months, and it remains the only category to move in lockstep with the Consumer Price Index on a long-term basis. -
Pet Products: Prices were up
11.8% YoY (up0.01% MoM), slightly below the record YoY high in the month prior (up12.7% YoY in August). Online inflation for pet products has now been observed for 29 consecutive months, as pet ownership surged during the COVID-19 pandemic and demand for related goods remains high.
Methodology
The DPI is modeled after the Consumer Price Index (CPI), published by the
Powered by Adobe Analytics, Adobe uses a combination of Adobe Sensei, Adobe’s AI and machine learning framework, and manual effort to segment the products into the categories defined by the CPI manual. The methodology was first developed alongside renowned economists
Adobe Analytics is part of Adobe Experience Cloud, which over
About Adobe
Adobe is changing the world through digital experiences. For more information, visit www.adobe.com.
*Per the Digital Commerce 360 Top 500 report (2021)
© 2022 Adobe. All rights reserved. Adobe and the Adobe logo are either registered trademarks or trademarks of Adobe in
View source version on businesswire.com: https://www.businesswire.com/news/home/20221012005460/en/
Public relations contacts
Adobe
kfu@adobe.com
Adobe
belkadi@adobe.com
Source: Adobe
FAQ
What was the change in online prices reported by Adobe for September 2022?
How much did grocery prices increase according to Adobe's report?
What significant price changes occurred in electronics and computers in September 2022?
How does the Adobe Digital Price Index impact e-commerce?


