UBS reports 4Q24 net profit of USD 0.8bn and FY24 net profit of USD 5.1bn; proposes USD 0.90 dividend per share and continuation of share repurchases; continuing to invest for long-term growth
UBS reported a net profit of USD 0.8bn for Q4 2024 and USD 5.1bn for full-year 2024. The bank demonstrated strong client momentum with USD 18bn of net new assets in Global Wealth Management for Q4 and USD 97bn for FY24. Asset Management saw net new money of USD 33bn in Q4 and USD 45bn in FY24.
The company achieved all key integration milestones in 2024 following the Credit Suisse acquisition, delivering USD 3.4bn in gross cost savings for FY24. UBS maintained a strong capital position with a 14.3% CET1 capital ratio and proposed a dividend increase of 29% YoY to USD 0.90 per share.
Looking ahead, UBS plans to repurchase USD 1bn of shares in H1 2025 and aims for up to USD 2bn more in H2. The bank targets an underlying RoCET1 of ~15% and underlying cost/income ratio of <70% by end-2026.
UBS ha riportato un utile netto di 0,8 miliardi di USD per il quarto trimestre del 2024 e di 5,1 miliardi di USD per l'intero anno 2024. La banca ha dimostrato una forte spinta da parte dei clienti, con 18 miliardi di USD di nuovi attivi netti nella Gestione Patrimoniale Globale per il Q4 e 97 miliardi di USD per l'anno fiscale 2024. La Gestione degli Attivi ha visto nuovi flussi netti di denaro pari a 33 miliardi di USD nel Q4 e 45 miliardi di USD nell'anno fiscale 2024.
L'azienda ha raggiunto tutti i principali traguardi di integrazione nel 2024 a seguito dell'acquisizione di Credit Suisse, realizzando 3,4 miliardi di USD di risparmi lordi sui costi per l'anno fiscale 2024. UBS ha mantenuto una solida posizione di capitale con un rapporto CET1 del 14,3% e ha proposto un aumento del dividendo del 29% su base annua a 0,90 USD per azione.
Guardando al futuro, UBS prevede di riacquistare 1 miliardo di USD di azioni nel primo semestre del 2025 e mira a ulteriori 2 miliardi di USD nel secondo semestre. La banca punta a un RoCET1 sottostante di circa il 15% e a un rapporto costi/entrate sottostante inferiore al 70% entro la fine del 2026.
UBS reportó un beneficio neto de 0,8 mil millones de USD para el cuarto trimestre de 2024 y de 5,1 mil millones de USD para el año completo de 2024. El banco demostró un fuerte impulso de clientes con 18 mil millones de USD de nuevos activos netos en Gestión de Patrimonio Global para el Q4 y 97 mil millones de USD para el FY24. La Gestión de Activos vio nuevos flujos de dinero netos de 33 mil millones de USD en el Q4 y 45 mil millones de USD en el FY24.
La compañía logró todos los hitos clave de integración en 2024 tras la adquisición de Credit Suisse, generando 3,4 mil millones de USD en ahorros brutos de costos para el FY24. UBS mantuvo una sólida posición de capital con un ratio CET1 del 14,3% y propuso un incremento del dividendo del 29% interanual a 0,90 USD por acción.
De cara al futuro, UBS planea recomprar 1 mil millones de USD de acciones en el primer semestre de 2025 y apuntan a hasta 2 mil millones de USD más en el segundo semestre. El banco tiene como objetivo un RoCET1 subyacente de aproximadamente el 15% y un ratio de costos/ingresos subyacente de <70% para finales de 2026.
UBS는 2024년 4분기에 8억 달러의 순이익을, 2024년 전체 연도에 51억 달러를 보고했습니다. 이 은행은 글로벌 자산 관리에서 4분기에 180억 달러의 순 신규 자산을, 2024년 전반에 970억 달러를 기록하며 고객의 강력한 모멘텀을 보여주었습니다. 자산 관리 부문에서 4분기에 330억 달러의 순 신규 자금이, 2024년에는 450억 달러가 유입되었습니다.
회사는 2024년 Credit Suisse 인수 후 모든 주요 통합 이정표를 달성했으며, 2024년 전체 연도에 34억 달러의 총 비용 절감을 달성했습니다. UBS는 14.3%의 CET1 자본비율로 강력한 자본 위치를 유지했고, 배당 증가를 연간 29% 인상하여 주당 0.90달러에 제안했습니다.
향후 UBS는 2025년 상반기에 10억 달러의 자사주 매입을 계획하고 있으며, 하반기에 최대 20억 달러를 추가로 매입할 예정입니다. 이 은행은 2026년 말까지 약 15%의 RoCET1과 70% 미만의 비용/수익 비율을 목표로 하고 있습니다.
UBS a rapporté un bénéfice net de 0,8 milliard USD pour le quatrième trimestre 2024 et de 5,1 milliards USD pour l'ensemble de l'année 2024. La banque a démontré un fort élan client avec 18 milliards USD d'actifs nets nouveaux dans la Gestion de Patrimoine Globale pour le T4 et 97 milliards USD pour l'exercice FY24. La Gestion d'Actifs a connu de nouveaux flux nets de 33 milliards USD au T4 et de 45 milliards USD pour l'exercice FY24.
L'entreprise a atteint tous les principales étapes d'intégration en 2024 suite à l'acquisition de Credit Suisse, générant 3,4 milliards USD d'économies brutes de coûts pour l'exercice FY24. UBS a maintenu une solide position en capital avec un ratio CET1 de 14,3 % et a proposé une augmentation du dividende de 29 % par rapport à l'année précédente à 0,90 USD par action.
En regardant vers l'avenir, UBS prévoit de racheter pour 1 milliard USD d'actions au premier semestre 2025 et vise jusqu'à 2 milliards USD supplémentaires au second semestre. La banque vise un RoCET1 sous-jacent d'environ 15 % et un ratio coût/revenu sous-jacent de <70 % d'ici fin 2026.
UBS meldete für das vierte Quartal 2024 einen Nettogewinn von 0,8 Milliarden USD und für das gesamte Jahr 2024 von 5,1 Milliarden USD. Die Bank zeigte eine starke Kundenbewegung mit 18 Milliarden USD an neuen Nettomitteln im Global Wealth Management für das 4. Quartal und 97 Milliarden USD im Gesamtjahr 2024. Das Asset Management verzeichnete im 4. Quartal neue Nettomittel in Höhe von 33 Milliarden USD und 45 Milliarden USD für das Gesamtjahr 2024.
Das Unternehmen erreichte im Jahr 2024 alle wichtigen Integrationsmeilensteine nach der Übernahme von Credit Suisse und erzielte 3,4 Milliarden USD an Bruttokosteneinsparungen für das Gesamtjahr 2024. UBS behielt eine starke Kapitalbasis mit einer CET1-Kapitalquote von 14,3 % bei und schlug eine Dividendensteigerung von 29 % im Vergleich zum Vorjahr auf 0,90 USD pro Aktie vor.
Im Hinblick auf die Zukunft plant UBS, im ersten Halbjahr 2025 Aktien im Wert von 1 Milliarde USD zurückzukaufen und strebt im zweiten Halbjahr bis zu 2 Milliarden USD mehr an. Die Bank zielt auf eine fundamentale RoCET1 von etwa 15 % und ein Verhältnis von Kosten zu Erlösen von <70 % bis Ende 2026.
- Net profit of USD 5.1bn for FY24
- Strong net new assets: USD 97bn in Global Wealth Management for FY24
- 29% YoY dividend increase to USD 0.90 per share
- USD 3.4bn in gross cost savings achieved in FY24
- Robust capital position with 14.3% CET1 ratio
- USD 3bn share buyback plan for 2025
- Q4 2024 RoCET1 of 4.2% below underlying target of 7.2%
- High cost/income ratio of 89.0% in Q4
- Integration expenses expected to reach USD ~14bn by end-2026
(Ad hoc announcement pursuant to Article 53 of the SIX Exchange Regulation Listing Rules)
Key highlights (Graphic: UBS Group AG)
UBS (NYSE:UBS) (SWX:UBSN):
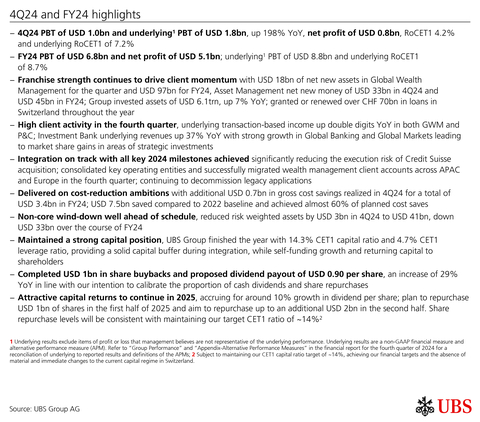
4Q24 and FY24 highlights
-
4Q24 PBT of
USD 1.0bn and underlying1 PBT ofUSD 1.8bn , up198% YoY, net profit ofUSD 0.8bn , RoCET14.2% and underlying RoCET1 of7.2% -
FY24 PBT of
USD 6.8bn and net profit ofUSD 5.1bn ; underlying1 PBT ofUSD 8.8bn and underlying RoCET1 of8.7% -
Franchise strength continues to drive client momentum with
USD 18bn of net new assets in Global Wealth Management for the quarter andUSD 97bn for FY24, Asset Management net new money ofUSD 33bn in 4Q24 andUSD 45bn in FY24; Group invested assets ofUSD 6.1trn , up7% YoY; granted or renewed overCHF 70bn in loans inSwitzerland throughout the year -
High client activity in the fourth quarter, underlying transaction-based income up double digits YoY in both GWM and P&C; Investment Bank underlying revenues up
37% YoY with strong growth in Global Banking and Global Markets leading to market share gains in areas of strategic investments -
Integration on track with all key 2024 milestones achieved significantly reducing the execution risk of Credit Suisse acquisition; consolidated key operating entities and successfully migrated wealth management client accounts across APAC and
Europe in the fourth quarter; continuing to decommission legacy applications -
Delivered on cost-reduction ambitions with additional
USD 0.7bn in gross cost savings realized in 4Q24 for a total ofUSD 3.4bn in FY24;USD 7.5bn saved compared to 2022 baseline and achieved almost60% of planned cost saves -
Non-core wind-down well ahead of schedule, reduced risk weighted assets by
USD 3bn in 4Q24 toUSD 41bn , downUSD 33bn over the course of FY24 -
Maintained a strong capital position, UBS Group finished the year with
14.3% CET1 capital ratio and4.7% CET1 leverage ratio, providing a solid capital buffer during integration, while self-funding growth and returning capital to shareholders -
Completed
USD 1bn in share buybacks and proposed dividend payout ofUSD 0.90 per share, an increase of29% YoY in line with our intention to calibrate the proportion of cash dividends and share repurchases -
Attractive capital returns to continue in 2025, accruing for around
10% growth in dividend per share; plan to repurchaseUSD 1bn of shares in the first half of 2025 and aim to repurchase up to an additionalUSD 2bn in the second half. Share repurchase levels will be consistent with maintaining our target CET1 ratio of ~14% 2
Investor update highlights
-
Confirming financial targets and ambitions for 2026 exit rate and 20283, targeting underlying RoCET1 of ~
15% and underlying cost/income ratio of <70% as of 2026 exit rate; well positioned to deliver long-term growth and higher returns with ~18% reported RoCET1 in 2028 -
Increasingly confident in substantially completing integration by end-2026, majority of client-account transfers in
Switzerland and all the portfolio migrations in Asset Management are set to be completed in 2025; expect to materially complete NCL wind-down, as well as app and IT infrastructure decommissioning by end-2026, unlocking substantial cost reductions - On track to deliver USD ~13bn gross cost reductions by end-2026 with cumulative integration expenses of USD ~14bn; USD ~2.5bn of gross cost saves expected in 2025
-
Building on our attractive global business model and diversified footprint, including investments in GWM Americas, a key component of our business model, where we already started to make changes to help improve operating leverage, increase profitability and drive sustainable growth towards ~
15% PBT margin in 2027 - Continuing to invest in technology to drive business outcomes, expanding cloud infrastructure and GenAI usage to transform how we operate in terms of client service, efficiency and security; on track with roll out of 50,000 Copilot licenses to UBS employees
-
Ongoing financial resource discipline to create room for profitable growth with reductions in NCL footprint to create USD ~15bn capacity for profitable growth in core franchises, mainly GWM; Day 1 impact from Basel III finalization at
USD 1bn
“Our strong full-year performance reflects our unwavering commitment to serving our clients, the strength of our diversified global franchise and the progress we have made on the integration. Throughout 2024, we maintained robust momentum as we captured growth in Global Wealth and Asset Management and gained market share in the Investment Bank in the areas where we have made strategic investments. With over
We achieved all key integration milestones in 2024 and significantly reduced execution risk, while our capital position remained robust. In 2025, we will continue to execute on the next phase of the integration with discipline and deliver on our priorities. We are confident in our ability to substantially complete the integration by the end of 2026, achieve our financial targets, and fulfill our growth initiatives as we position UBS for a successful future.” Sergio P. Ermotti, Group CEO
Selected financials for 4Q24
Profit before tax |
Cost/income ratio |
RoCET1 capital |
Net profit |
CET1 capital ratio |
1.0 |
89.0 |
4.2 |
0.8 |
14.3 |
USD bn |
% |
% |
USD bn |
% |
Underlying1 |
Underlying1 |
Underlying1 |
Diluted |
CET1 |
profit before tax |
cost/income ratio |
RoCET1 capital |
EPS |
leverage ratio |
1.8 |
81.9 |
7.2 |
0.23 |
4.7 |
USD bn |
% |
% |
USD |
% |
Selected financials for FY24
Profit before tax |
Cost/income ratio |
RoCET1 capital |
Net profit |
CET1 capital ratio |
6.8 |
84.8 |
6.7 |
5.1 |
14.3 |
USD bn |
% |
% |
USD bn |
% |
Underlying1 |
Underlying1 |
Underlying1 |
Diluted |
CET1 |
profit before tax |
cost/income ratio |
RoCET1 capital |
EPS |
leverage ratio |
8.8 |
79.5 |
8.7 |
1.52 |
4.7 |
USD bn |
% |
% |
USD |
% |
Information in this news release is presented for UBS Group AG on a consolidated basis unless otherwise specified.
1 Underlying results exclude items of profit or loss that management believes are not representative of the underlying performance. Underlying results are a non-GAAP financial measure and alternative performance measure (APM). Refer to “Group Performance” and “Appendix-Alternative Performance Measures” in the financial report for the fourth quarter of 2024 for a reconciliation of underlying to reported results and definitions of the APMs; 2 Subject to maintaining our CET1 capital ratio target of ~ |
||||
4Q24 and FY24 Group performance
Strong financial performance
In 4Q24, we reported PBT of
Reported revenues were
For the full-year, the reported net profit reached
Maintained robust client momentum
During the fourth quarter, we remained close to our clients, providing them with expert advice and solutions across franchises to best leverage supportive market conditions. As demonstrated by
As a leading provider of credit to Swiss households and corporates, we continue to deliver on our commitments to our home market, having granted or renewed over
Transactional activity was strong during the quarter across both private and institutional clients. In GWM, underlying transaction-based income increased by
For the FY24 GWM underlying transaction-based income increased by
Achieved all key integration milestones in 2024 and delivered on cost reduction ambitions
We continued to execute on our integration plans, achieving over 4,000 milestones in 2024 and significantly reducing the execution risk of the Credit Suisse acquisition. With the successful migration of wealth management client accounts across booking centers in
Seamless transfers were achieved thanks to our teams executing at pace on an intensive integration and preparation program throughout the year, which culminated with mergers of the parent and Swiss banks, as well as the establishment of a single IHC in the US.
In the fourth quarter we drove further progress on cost-reduction work in Non-core and Legacy, having decommissioned over
In the fourth quarter across the Group we delivered an additional
Strong capital position and commitment to capital returns ambitions
A strong capital position and sustainable capital generation remain the key pillars of our strategy. We ended the year with
The year-end CET1 capital ratio was
For the 2024 financial year, the Board of Directors plans to propose a dividend to UBS Group AG shareholders of
We remain committed to progressive dividends and are accruing for an increase of around
In the fourth quarter of 2024, we completed our planned
Investor update summary
Reiterating medium and long-term targets
We remain well positioned to build towards our 2026-exit rate targets of an underlying
As we progress towards our goals, we expect to generate an underlying RoCET1 of ~
Beyond 2026, we maintain our goal of delivering a reported return on CET1 capital of ~
Our targets and ambitions are based on our Group target of ~
Building on our attractive global business model and diversified footprint
Throughout 2025 we expect our core businesses to be the main drivers of our returns, leveraging their strong market position and constructive economic backdrop while continuing to deliver on our integration priorities.
Leveraging our unrivaled global scale and footprint and enduring competitive advantages, GWM aims to increase returns and achieve USD ~100bn in net new assets in 2025, and afterwards building to USD ~200bn annually by 2028, when invested assets are expected to surpass
An integral part of our growth plans is to improve profitability across our
We expect our efforts to support our profitability and progress towards achieving a sustainable profit margin of ~
In our P&C franchise in
In AM, we are focused on capturing opportunities where we have a differentiated and scalable offering, including the recently launched Unified Global Alternatives (UGA) unit which brings together our GWM and AM capabilities. With nearly
Our focus in the IB remains deploying our products and services across our institutional client base and leveraging connectivity with GWM and P&C while maintaining capital discipline. The IB aims to achieve a ~
Continuing to invest in technology to drive business outcomes
We continue to build out our best-in-class cloud infrastructure, already having reached ~
After the successful rollout of Red, our proprietary new AI assistant, to around 20,000 of our client advisors, they now have intelligent access to insights, UBS products, research and CIO reports. Meanwhile, our advanced analytics platform in the US has generated 13m insights for our financial advisors.
The rollout of 50,000 Copilot licenses to our employees is on track as well, and we are already seeing increased usage of GenAI tools with 1.75m prompts across all of our tools in 2024, with an expected 10-fold increase in usage in 2025.
On track to substantially complete integration by end-2026 and deliver
We are continuing our disciplined execution of the Credit Suisse integration and remain on track to substantially complete it by end-2026.
Following our success in 2024, further client account transitions are taking place across our European booking centers, and we intend to commence the next phase of transfers in
After reaching
Ongoing financial resource discipline to create room for profitable growth
Over the next two years we expect our balance sheet optimization efforts and ongoing reduction of the Non-core and Legacy footprint to create capacity for sustainable and profitable growth in our core businesses. We expect business growth in our franchises to add around
The adoption of the final Basel III standards in January 2025 led to a
Outlook
Investor sentiment remained positive in the fourth quarter of 2024, driving strong institutional and private client activity supported by a constructive market backdrop that reflected an increase in investors’ risk appetite following the results of the US presidential election.
Constructive market conditions have continued into the first quarter of 2025 sustained by the greater optimism regarding growth prospects in the US. However, investor behavior may be affected by the clouded macroeconomic outlook outside the US, increased uncertainties around global trade, inflation and central bank policies, as well as geopolitics, including the upcoming elections in
In the first quarter, we expect a low-to-mid single digit percentage sequential decline in net interest income (NII) in Global Wealth Management and around a
We remain focused on supporting clients with advice and solutions and continue to execute on our priorities, investing in people, products, and capabilities to drive sustainable long-term value for our stakeholders while maintaining a balance sheet for all seasons.
Fourth quarter 2024 performance overview – Group
Group PBT
PBT of
Global Wealth Management (GWM) PBT
Total revenues increased by
Personal & Corporate Banking (P&C) PBT
Total revenues increased by
Asset Management (AM) PBT
Total revenues decreased by
Investment Bank (IB) PBT
Total revenues increased by
Non-core and Legacy (NCL) PBT
Total revenues were negative
Group Items PBT
UBS’s sustainability and impact highlights
We are guided by our ambition to be a global leader in sustainability.
We will communicate further details on our approach in our 2024 Sustainability Report, which will be published on 17 March 2025.
Celebrating 25 years of the UBS Optimus Foundation
UBS Optimus Foundation celebrated its 25th anniversary in December 2024. To mark this very special milestone, UBS donated
In the past 10 years alone, Optimus – together with our clients and employees – has raised over
UBS’s real assets investment strategies top-ranked for sustainability
UBS’s Global Real Assets strategies continue to be recognized for their sustainability efforts with sustained strong performance in the 2024 GRESB Real Estate and Infrastructure Assessments. GRESB is a third-party organization that provides financial markets with sustainability data. Five disclosed UBS real estate strategies came first in their respective peer group. Of the 16 disclosed UBS real estate strategies, 11 achieved the highest rating of five stars and five received four stars.
UBS completes first carbon dioxide removal (CDR) trade
Our firm’s first carbon dioxide removal (CDR) trade was completed in the
Los Angeles Wildfire Relief efforts
Communities impacted by the LA wildfires face a range of urgent needs as they navigate the immediate aftermath of these powerful firestorms and transition into long-term rebuilding and recovery. UBS Optimus Foundation is supporting our partners Americares, World Central Kitchen, Team Rubicon and GiveDirectly who are providing ongoing assistance to victims. In addition, UBS committed
Selected financial information of the business divisions and Group Items |
|||||||
|
For the quarter ended 31.12.24 |
||||||
USD m |
Global Wealth Management |
Personal & Corporate Banking |
Asset Management |
Investment Bank |
Non-core and Legacy |
Group Items |
Total |
Total revenues as reported |
6,121 |
2,245 |
766 |
2,749 |
(58) |
(188) |
11,635 |
of which: PPA effects and other integration items1 |
200 |
258 |
|
202 |
|
(4) |
656 |
of which: loss related to an investment in an associate |
(21) |
(59) |
|
|
|
|
(80) |
Total revenues (underlying) |
5,942 |
2,047 |
766 |
2,547 |
(58) |
(184) |
11,059 |
Credit loss expense / (release) |
(14) |
175 |
0 |
63 |
6 |
0 |
229 |
Operating expenses as reported |
5,268 |
1,476 |
639 |
2,207 |
858 |
(88) |
10,359 |
of which: integration-related expenses and PPA effects2 |
460 |
209 |
96 |
174 |
317 |
(1) |
1,255 |
of which: items related to the Swisscard transactions3 |
|
41 |
|
|
|
|
41 |
Operating expenses (underlying) |
4,808 |
1,226 |
543 |
2,032 |
541 |
(88) |
9,062 |
Operating profit / (loss) before tax as reported |
867 |
595 |
128 |
479 |
(923) |
(100) |
1,047 |
Operating profit / (loss) before tax (underlying) |
1,147 |
646 |
224 |
452 |
(606) |
(96) |
1,768 |
|
|||||||
|
For the quarter ended 30.9.24 |
||||||
USD m |
Global Wealth Management |
Personal & Corporate Banking |
Asset Management |
Investment Bank |
Non-core and Legacy |
Group Items |
Total |
Total revenues as reported |
6,199 |
2,394 |
873 |
2,645 |
262 |
(39) |
12,334 |
of which: PPA effects and other integration items1 |
224 |
278 |
|
185 |
|
(25) |
662 |
Total revenues (underlying) |
5,975 |
2,116 |
873 |
2,461 |
262 |
(14) |
11,672 |
Credit loss expense / (release) |
2 |
83 |
0 |
9 |
28 |
0 |
121 |
Operating expenses as reported |
5,112 |
1,465 |
722 |
2,231 |
837 |
(84) |
10,283 |
of which: integration-related expenses and PPA effects2 |
419 |
198 |
86 |
156 |
270 |
(11) |
1,119 |
Operating expenses (underlying) |
4,693 |
1,267 |
636 |
2,076 |
567 |
(74) |
9,165 |
Operating profit / (loss) before tax as reported |
1,085 |
846 |
151 |
405 |
(603) |
45 |
1,929 |
Operating profit / (loss) before tax (underlying) |
1,280 |
766 |
237 |
377 |
(333) |
60 |
2,386 |
|
|||||||
|
For the quarter ended 31.12.234 |
||||||
USD m |
Global Wealth Management |
Personal & Corporate Banking |
Asset Management |
Investment Bank |
Non-core and Legacy |
Group Items |
Total |
Total revenues as reported |
5,554 |
2,083 |
825 |
2,141 |
145 |
107 |
10,855 |
of which: PPA effects and other integration items1 |
349 |
306 |
|
277 |
|
12 |
944 |
of which: loss related to an investment in an associate |
(190) |
(317) |
|
|
|
|
(508) |
Total revenues (underlying) |
5,395 |
2,094 |
825 |
1,864 |
145 |
95 |
10,419 |
Credit loss expense / (release) |
(8) |
85 |
(1) |
48 |
15 |
(2) |
136 |
Operating expenses as reported |
5,282 |
1,398 |
704 |
2,283 |
1,787 |
16 |
11,470 |
of which: integration-related expenses and PPA effects2 |
502 |
187 |
64 |
167 |
750 |
109 |
1,780 |
of which: acquisition-related costs |
|
|
|
|
|
(1) |
(1) |
Operating expenses (underlying) |
4,780 |
1,210 |
639 |
2,116 |
1,037 |
(92) |
9,690 |
Operating profit / (loss) before tax as reported |
280 |
601 |
122 |
(190) |
(1,657) |
93 |
(751) |
Operating profit / (loss) before tax (underlying) |
624 |
800 |
186 |
(300) |
(907) |
189 |
592 |
1 Includes accretion of PPA adjustments on financial instruments and other PPA effects, as well as temporary and incremental items directly related to the integration. 2 Includes temporary, incremental operating expenses directly related to the integration, as well as amortization of newly recognized intangibles resulting from the acquisition of the Credit Suisse Group. 3 Represents the termination fee to American Express related to the expected sale in 2025 of our |
|||||||
Selected financial information of the business divisions and Group Items (continued) |
||||||||
|
For the year ended 31.12.24 |
|||||||
USD m |
Global Wealth Management |
Personal & Corporate Banking |
Asset Management |
Investment Bank |
Non-core and Legacy |
Group Items |
|
Total |
Total revenues as reported |
24,516 |
9,334 |
3,182 |
10,948 |
1,605 |
(975) |
|
48,611 |
of which: PPA effects and other integration items1 |
891 |
1,038 |
|
989 |
|
(41) |
|
2,877 |
of which: loss related to an investment in an associate |
(21) |
(59) |
|
|
|
|
|
(80) |
Total revenues (underlying) |
23,646 |
8,355 |
3,182 |
9,958 |
1,605 |
(933) |
|
45,814 |
Credit loss expense / (release) |
(16) |
404 |
(1) |
97 |
69 |
(2) |
|
551 |
Operating expenses as reported |
20,608 |
5,741 |
2,663 |
8,934 |
3,512 |
(220) |
|
41,239 |
of which: integration-related expenses and PPA effects2 |
1,807 |
749 |
351 |
717 |
1,154 |
(12) |
|
4,766 |
of which: items related to the Swisscard transactions3 |
|
41 |
|
|
|
|
|
41 |
Operating expenses (underlying) |
18,802 |
4,951 |
2,312 |
8,217 |
2,359 |
(208) |
|
36,432 |
Operating profit / (loss) before tax as reported |
3,924 |
3,189 |
520 |
1,917 |
(1,976) |
(752) |
|
6,821 |
Operating profit / (loss) before tax (underlying) |
4,860 |
3,000 |
871 |
1,644 |
(822) |
(723) |
|
8,831 |
|
||||||||
|
For the year ended 31.12.234,5 |
|||||||
USD m |
Global Wealth Management |
Personal & Corporate Banking |
Asset Management |
Investment Bank |
Non-core and Legacy |
Group Items |
Negative goodwill |
Total |
Total revenues as reported |
21,556 |
7,687 |
2,686 |
8,703 |
697 |
(495) |
|
40,834 |
of which: PPA effects and other integration items1 |
923 |
783 |
|
583 |
|
(9) |
|
2,280 |
of which: loss related to an investment in an associate |
(190) |
(317) |
|
|
|
|
|
(508) |
Total revenues (underlying) |
20,823 |
7,222 |
2,686 |
8,120 |
697 |
(486) |
|
39,062 |
Negative goodwill |
|
|
|
|
|
|
27,264 |
27,264 |
Credit loss expense / (release) |
166 |
482 |
0 |
190 |
193 |
6 |
|
1,037 |
Operating expenses as reported |
17,945 |
4,394 |
2,353 |
8,585 |
5,091 |
438 |
|
38,806 |
of which: integration-related expenses and PPA effects2 |
1,018 |
398 |
205 |
697 |
1,775 |
451 |
|
4,543 |
of which: acquisition-related costs |
|
|
|
|
|
202 |
|
202 |
Operating expenses (underlying) |
16,927 |
3,996 |
2,149 |
7,889 |
3,316 |
(215) |
|
34,061 |
Operating profit / (loss) before tax as reported |
3,445 |
2,811 |
332 |
(72) |
(4,587) |
(938) |
27,264 |
28,255 |
Operating profit / (loss) before tax (underlying) |
3,730 |
2,744 |
537 |
42 |
(2,812) |
(277) |
|
3,963 |
1 Includes accretion of PPA adjustments on financial instruments and other PPA effects, as well as temporary and incremental items directly related to the integration. 2 Includes temporary, incremental operating expenses directly related to the integration, as well as amortization of newly recognized intangibles resulting from the acquisition of the Credit Suisse Group. 3 Represents the termination fee to American Express related to the expected sale in 2025 of our |
||||||||
Our key figures |
|
|
|
|
|
|
|
|
|
As of or for the quarter ended |
|
As of or for the year ended |
|||
USD m, except where indicated |
|
31.12.24 |
30.9.24 |
31.12.231 |
|
31.12.24 |
31.12.231 |
Group results |
|
|
|
|
|
|
|
Total revenues |
|
11,635 |
12,334 |
10,855 |
|
48,611 |
40,834 |
Negative goodwill |
|
|
|
|
|
|
27,264 |
Credit loss expense / (release) |
|
229 |
121 |
136 |
|
551 |
1,037 |
Operating expenses |
|
10,359 |
10,283 |
11,470 |
|
41,239 |
38,806 |
Operating profit / (loss) before tax |
|
1,047 |
1,929 |
(751) |
|
6,821 |
28,255 |
Net profit / (loss) attributable to shareholders |
|
770 |
1,425 |
(279) |
|
5,085 |
27,366 |
Diluted earnings per share (USD)2 |
|
0.23 |
0.43 |
(0.09) |
|
1.52 |
8.30 |
Profitability and growth3,4 |
|
|
|
|
|
|
|
Return on equity (%) |
|
3.6 |
6.7 |
(1.3) |
|
6.0 |
36.9 |
Return on tangible equity (%) |
|
3.9 |
7.3 |
(1.4) |
|
6.5 |
40.8 |
Underlying return on tangible equity (%)5 |
|
6.6 |
9.0 |
4.8 |
|
8.5 |
4.1 |
Return on common equity tier 1 capital (%) |
|
4.2 |
7.6 |
(1.4) |
|
6.7 |
41.8 |
Underlying return on common equity tier 1 capital (%)5 |
|
7.2 |
9.4 |
4.8 |
|
8.7 |
4.2 |
Return on leverage ratio denominator, gross (%) |
|
3.0 |
3.1 |
2.6 |
|
3.0 |
2.9 |
Cost / income ratio (%)6 |
|
89.0 |
83.4 |
105.7 |
|
84.8 |
95.0 |
Underlying cost / income ratio (%)5,6 |
|
81.9 |
78.5 |
93.0 |
|
79.5 |
87.2 |
Effective tax rate (%) |
|
25.6 |
26.0 |
n.m.7 |
|
24.6 |
3.1 |
Net profit growth (%) |
|
n.m. |
n.m. |
n.m. |
|
(81.4) |
258.7 |
Resources3 |
|
|
|
|
|
|
|
Total assets |
|
1,565,028 |
1,623,941 |
1,716,924 |
|
1,565,028 |
1,716,924 |
Equity attributable to shareholders |
|
85,079 |
87,025 |
85,624 |
|
85,079 |
85,624 |
Common equity tier 1 capital8 |
|
71,367 |
74,213 |
78,002 |
|
71,367 |
78,002 |
Risk-weighted assets8 |
|
498,538 |
519,363 |
546,505 |
|
498,538 |
546,505 |
Common equity tier 1 capital ratio (%)8 |
|
14.3 |
14.3 |
14.3 |
|
14.3 |
14.3 |
Going concern capital ratio (%)8 |
|
17.6 |
17.5 |
16.8 |
|
17.6 |
16.8 |
Total loss-absorbing capacity ratio (%)8 |
|
37.2 |
37.5 |
36.4 |
|
37.2 |
36.4 |
Leverage ratio denominator8 |
|
1,519,477 |
1,608,341 |
1,695,403 |
|
1,519,477 |
1,695,403 |
Common equity tier 1 leverage ratio (%)8 |
|
4.7 |
4.6 |
4.6 |
|
4.7 |
4.6 |
Liquidity coverage ratio (%)9 |
|
188.4 |
199.2 |
215.7 |
|
188.4 |
215.7 |
Net stable funding ratio (%) |
|
125.5 |
126.9 |
124.7 |
|
125.5 |
124.7 |
Other |
|
|
|
|
|
|
|
Invested assets (USD bn)4,10 |
|
6,087 |
6,199 |
5,714 |
|
6,087 |
5,714 |
Personnel (full-time equivalents) |
|
108,648 |
109,396 |
112,842 |
|
108,648 |
112,842 |
Market capitalization2,11 |
|
105,719 |
106,528 |
107,355 |
|
105,719 |
107,355 |
Total book value per share (USD)2 |
|
26.80 |
27.32 |
26.68 |
|
26.80 |
26.68 |
Tangible book value per share (USD)2 |
|
24.63 |
25.10 |
24.34 |
|
24.63 |
24.34 |
Credit-impaired lending assets as a percentage of total lending assets, gross (%)4 |
|
1.0 |
0.9 |
0.8 |
|
1.0 |
0.8 |
Cost of credit risk (bps)4 |
|
15 |
8 |
8 |
|
9 |
19 |
1 Comparative-period information has been revised. Refer to “Note 2 Accounting for the acquisition of the Credit Suisse Group” in the “Consolidated financial statements” section of the UBS Group third quarter 2024 report, available under “Quarterly reporting” at ubs.com/investors, for more information. 2 Refer to the “Share information and earnings per share” section of the UBS Group fourth quarter 2024 report, available under “Quarterly reporting” at ubs.com/investors, for more information. 3 Refer to the “Recent developments” section of the UBS Group fourth quarter 2024 report, available under “Quarterly reporting” at ubs.com/investors, for more information about targets and ambitions. 4 Refer to “Alternative performance measures” in the appendix to the UBS Group fourth quarter 2024 report, available under “Quarterly reporting” at ubs.com/investors, for the definition and calculation method. 5 Refer to the “Group performance” section of the UBS Group fourth quarter 2024 report, available under “Quarterly reporting” at ubs.com/investors, for more information about underlying results. 6 Negative goodwill is not used in the calculation as it is presented in a separate reporting line and is not part of total revenues. 7 The effective tax rate for the fourth quarter of 2023 is not a meaningful measure, due to the distortive effect of current unbenefited tax losses at the former Credit Suisse entities. 8 Based on the Swiss systemically relevant bank framework as of 1 January 2020. Refer to the “Capital management” section of the UBS Group fourth quarter 2024 report, available under “Quarterly reporting” at ubs.com/investors, for more information. 9 The disclosed ratios represent quarterly averages for the quarters presented and are calculated based on an average of 64 data points in the fourth quarter of 2024, 65 data points in the third quarter of 2024 and 63 data points in the fourth quarter of 2023. Refer to the “Liquidity and funding management” section of the UBS Group fourth quarter 2024 report, available under “Quarterly reporting” at ubs.com/investors, for more information. 10 Consists of invested assets for Global Wealth Management, Asset Management (including invested assets from associates) and Personal & Corporate Banking. Refer to “Note 32 Invested assets and net new money” in the “Consolidated financial statements” section of the UBS Group Annual Report 2023, available under “Annual reporting” at ubs.com/investors, for more information. 11 The calculation of market capitalization reflects total shares issued multiplied by the share price at the end of the period. |
|||||||
Income statement |
|
|
|
|
|
|
|
|
|
|
|
|
For the quarter ended |
|
% change from |
|
For the year ended |
||||
USD m |
|
31.12.24 |
30.9.24 |
31.12.23 |
|
3Q24 |
4Q23 |
|
31.12.24 |
31.12.231 |
Net interest income |
|
1,838 |
1,794 |
2,095 |
|
2 |
(12) |
|
7,108 |
7,297 |
Other net income from financial instruments measured at fair value through profit or loss |
|
3,144 |
3,681 |
3,158 |
|
(15) |
0 |
|
14,690 |
11,583 |
Net fee and commission income |
|
6,598 |
6,517 |
5,780 |
|
1 |
14 |
|
26,138 |
21,570 |
Other income |
|
56 |
341 |
(179) |
|
(84) |
|
|
675 |
384 |
Total revenues |
|
11,635 |
12,334 |
10,855 |
|
(6) |
7 |
|
48,611 |
40,834 |
Negative goodwill |
|
|
|
|
|
|
|
|
|
27,264 |
Credit loss expense / (release) |
|
229 |
121 |
136 |
|
89 |
68 |
|
551 |
1,037 |
|
|
|
|
|
|
|
|
|
|
|
Personnel expenses |
|
6,361 |
6,889 |
7,061 |
|
(8) |
(10) |
|
27,318 |
24,899 |
General and administrative expenses |
|
3,004 |
2,389 |
2,999 |
|
26 |
0 |
|
10,124 |
10,156 |
Depreciation, amortization and impairment of non-financial assets |
|
994 |
1,006 |
1,409 |
|
(1) |
(29) |
|
3,798 |
3,750 |
Operating expenses |
|
10,359 |
10,283 |
11,470 |
|
1 |
(10) |
|
41,239 |
38,806 |
Operating profit / (loss) before tax |
|
1,047 |
1,929 |
(751) |
|
(46) |
|
|
6,821 |
28,255 |
Tax expense / (benefit) |
|
268 |
502 |
(473) |
|
(47) |
|
|
1,675 |
873 |
Net profit / (loss) |
|
779 |
1,428 |
(278) |
|
(45) |
|
|
5,146 |
27,382 |
Net profit / (loss) attributable to non-controlling interests |
|
9 |
3 |
1 |
|
185 |
|
|
60 |
16 |
Net profit / (loss) attributable to shareholders |
|
770 |
1,425 |
(279) |
|
(46) |
|
|
5,085 |
27,366 |
|
|
|
|
|
|
|
|
|
|
|
Comprehensive income |
|
|
|
|
|
|
|
|
|
|
Total comprehensive income |
|
(1,878) |
3,910 |
2,695 |
|
|
|
|
3,401 |
28,374 |
Total comprehensive income attributable to non-controlling interests |
|
(27) |
27 |
18 |
|
|
|
|
13 |
22 |
Total comprehensive income attributable to shareholders |
|
(1,851) |
3,883 |
2,677 |
|
|
|
|
3,388 |
28,352 |
1 Comparative-period information as previously reported in the 2023 Annual Report has been revised to reflect measurement period adjustments impacting negative goodwill. Refer to “Note 2 Accounting for the acquisition of the Credit Suisse Group” in the “Consolidated financial statements” section of the UBS Group third quarter 2024 report, available under “Quarterly reporting” at ubs.com/investors, for more information about the relevant adjustments. |
||||||||||
Information about results materials and the earnings call
UBS’s fourth quarter 2024 report, news release and slide presentation are available from 06:45 CET on Tuesday, 4 February 2025, at ubs.com/quarterlyreporting.
UBS will hold a presentation of its fourth quarter 2024 results on Tuesday, 4 February 2025. The results will be presented by Sergio P. Ermotti (Group Chief Executive Officer), Todd Tuckner (Group Chief Financial Officer) and Sarah Mackey (Head of Investor Relations).
Time
09:00 CET
08:00 GMT
03:00 US EST
Audio webcast
The presentation for analysts can be followed live on ubs.com/quarterlyreporting with a simultaneous slide show.
Webcast playback
An audio playback of the results presentation will be made available at ubs.com/investors later in the day.
Cautionary statement regarding forward-looking statements
This news release contains statements that constitute “forward-looking statements”, including but not limited to management’s outlook for UBS’s financial performance, statements relating to the anticipated effect of transactions and strategic initiatives on UBS’s business and future development and goals or intentions to achieve climate, sustainability and other social objectives. While these forward-looking statements represent UBS’s judgments, expectations and objectives concerning the matters described, a number of risks, uncertainties and other important factors could cause actual developments and results to differ materially from UBS’s expectations. In particular, the global economy may be negatively affected by shifting political circumstances, including increased tension between world powers, conflicts in the
Rounding
Numbers presented throughout this news release may not add up precisely to the totals provided in the tables and text. Percentages and percent changes disclosed in text and tables are calculated on the basis of unrounded figures. Absolute changes between reporting periods disclosed in the text, which can be derived from numbers presented in related tables, are calculated on a rounded basis.
Tables
Within tables, blank fields generally indicate non-applicability or that presentation of any content would not be meaningful, or that information is not available as of the relevant date or for the relevant period. Zero values generally indicate that the respective figure is zero on an actual or rounded basis. Values that are zero on a rounded basis can be either negative or positive on an actual basis.
Websites
In this news release, any website addresses are provided solely for information and are not intended to be active links. UBS is not incorporating the contents of any such websites into this news release.
View source version on businesswire.com: https://www.businesswire.com/news/home/20250203802726/en/
UBS Group AG
Investor contact
Media contact
APAC: +852-297-1 82 00
Source: UBS