Ternium Announces Second Quarter and First Half of 2024 Results
Ternium S.A. (NYSE:TX) announced its Q2 and H1 2024 results. Adjusted EBITDA reached $545 million with a 12% margin, reflecting a weak pricing environment. The company recorded a $783 million provision for ongoing litigation related to Usiminas acquisition. Q2 2024 saw a net loss of $743 million, but Adjusted Net Income was $40 million. Ternium paid a $432 million dividend and maintained a net cash position of $1.9 billion. Steel shipments increased in Brazil and the Southern Region but decreased slightly in Mexico. The company expects a sequential decline in Q3 2024 Adjusted EBITDA due to reduced margins, partially offset by increased shipments.
Ternium S.A. (NYSE:TX) ha annunciato i suoi risultati per il secondo trimestre e il primo semestre del 2024. EBITDA aggiustato ha raggiunto 545 milioni di dollari con un margine del 12%, riflettendo un ambiente di prezzi debole. L'azienda ha registrato una provision di 783 milioni di dollari per contenziosi in corso relativi all'acquisizione di Usiminas. Nel secondo trimestre del 2024, si è registrata una perdita netta di 743 milioni di dollari, ma l'utili netti aggiustati sono stati di 40 milioni di dollari. Ternium ha distribuito un dividendo di 432 milioni di dollari e ha mantenuto una posizione di cassa netta di 1,9 miliardi di dollari. Le spedizioni di acciaio sono aumentate in Brasile e nella regione meridionale, ma sono leggermente diminuite in Messico. L'azienda prevede un declino sequenziale dell'EBITDA ajustato nel terzo trimestre del 2024 a causa di margini ridotti, parzialmente compensato da un aumento delle spedizioni.
Ternium S.A. (NYSE:TX) anunció sus resultados del segundo trimestre y del primer semestre de 2024. El EBITDA ajustado alcanzó los 545 millones de dólares con un margen del 12%, reflejando un entorno de precios débil. La compañía registró una provisión de 783 millones de dólares para litigios en curso relacionados con la adquisición de Usiminas. En el segundo trimestre de 2024, se registró una pérdida neta de 743 millones de dólares, pero el ingreso neto ajustado fue de 40 millones de dólares. Ternium pagó un dividendo de 432 millones de dólares y mantuvo una posición de efectivo neta de 1.9 mil millones de dólares. Los envíos de acero aumentaron en Brasil y la región sur, pero disminuyeron levemente en México. La compañía espera un declive secuencial en el EBITDA ajustado del tercer trimestre de 2024 debido a márgenes reducidos, compensado parcialmente por un aumento en los envíos.
Ternium S.A. (NYSE:TX)는 2024년 2분기 및 상반기 결과를 발표했습니다. 조정 EBITDA는 5억 4500만 달러에 달하며, 마진은 12%로 가격 환경이 약하다는 것을 반영합니다. 회사는 Usiminas 인수와 관련된 진행 중인 소송에 대해 7억 8300만 달러의 충당금을 기록했습니다. 2024년 2분기에는 순손실이 7억 4300만 달러로 나타났지만, 조정 순이익은 4천만 달러였습니다. Ternium은 4억 3200만 달러의 배당금을 지급했으며, 19억 달러의 순현금 보유액을 유지했습니다. 브라질과 남부 지역의 강철 선적은 증가했지만, 멕시코에서는 약간 감소했습니다. 회사는 2024년 3분기 조정 EBITDA의 순 감소를 예상하며, 이는 마진 감소로 인한 것이지만, 선적 증가로 부분적으로 상쇄될 것입니다.
Ternium S.A. (NYSE:TX) a annoncé ses résultats pour le deuxième trimestre et le premier semestre de 2024. L'EBITDA ajusté a atteint 545 millions de dollars avec une marge de 12%, ce qui reflète un environnement tarifaire faible. L'entreprise a enregistré une provision de 783 millions de dollars pour des litiges en cours liés à l'acquisition d'Usiminas. Le deuxième trimestre 2024 a enregistré une perte nette de 743 millions de dollars, mais le revenu net ajusté était de 40 millions de dollars. Ternium a versé un dividende de 432 millions de dollars et a maintenu une position de trésorerie nette de 1,9 milliard de dollars. Les expéditions d'acier ont augmenté au Brésil et dans la région sud, mais ont légèrement diminué au Mexique. La société s'attend à un déclin séquentiel de l'EBITDA ajusté au troisième trimestre 2024 en raison de marges réduites, partiellement compensés par une augmentation des expéditions.
Ternium S.A. (NYSE:TX) hat seine Ergebnisse für das 2. Quartal und das 1. Halbjahr 2024 bekannt gegeben. Das bereinigte EBITDA erreichte 545 Millionen Dollar bei einer Marge von 12%, was auf ein schwaches Preisumfeld hinweist. Das Unternehmen verzeichnete eine Rückstellung von 783 Millionen Dollar für laufende Rechtsstreitigkeiten im Zusammenhang mit der Übernahme von Usiminas. Im 2. Quartal 2024 gab es einen netto Verlust von 743 Millionen Dollar, während das bereinigte Nettoeinkommen bei 40 Millionen Dollar lag. Ternium zahlte eine Dividende von 432 Millionen Dollar und hielt eine Netto-Cash-Position von 1,9 Milliarden Dollar. Die Stahlverkäufe stiegen in Brasilien und der Süde Region, verringerten sich jedoch leicht in Mexiko. Das Unternehmen erwartet einen sequentiellen Rückgang des bereinigten EBITDA im 3. Quartal 2024 aufgrund reduzierter Margen, die teilweise durch erhöhte Lieferungen ausgeglichen werden.
- Strong cash provided by operating activities of $656 million
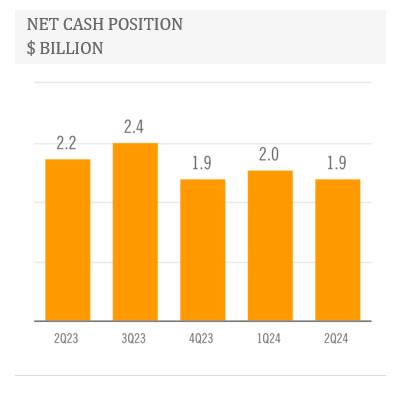
- Maintained solid financial position with net cash of $1.9 billion
- Continued growth in automotive industry demand in Mexico
- Gradual recovery in Argentine market
- Progress in expansion programs in Mexico and new wind farm in Argentina
- $783 million provision for ongoing litigation related to Usiminas acquisition
- Net loss of $743 million in Q2 2024
- Decrease in realized steel prices in main markets
- Slight increase in costs
- Expected sequential decline in Q3 2024 Adjusted EBITDA
Insights
Ternium's Q2 2024 results present a mixed picture. The company's Adjusted EBITDA reached
A significant concern is the
On a positive note, Ternium maintains a strong financial position with a net cash position of
Looking ahead, Ternium expects a sequential decline in Adjusted EBITDA for Q3 2024, primarily due to reduced margins. However, this may be partially offset by increased shipments across key markets. The company's outlook suggests challenges in pricing but potential growth in demand, particularly in Mexico's automotive and construction sectors.
Ternium's Q2 2024 results reflect the challenging conditions in the global steel market. The weak pricing environment in Ternium's main steel markets has significantly impacted the company's performance. This is evident in the sequential decrease in steel segment net sales and the decline in steel revenue per ton.
In Mexico, a key market for Ternium, we see a mixed picture. The automotive industry continues to show strength, but this is offset by softness in home appliances and HVAC sectors. The commercial steel market remains affected by the downward trend in steel prices. This divergence in sector performance highlights the importance of Ternium's diversified customer base.
Brazil presents an interesting scenario. While there's a pick-up in steel demand, particularly in the automotive and industrial sectors, high steel imports remain a concern. The recent establishment of a quota system to regulate steel imports hasn't yet had a significant impact, as imports remained elevated in Q2.
The Southern Region, particularly Argentina, shows signs of gradual recovery. However, the pace of this recovery remains uncertain, underscoring the volatile nature of emerging markets.
Looking forward, Ternium's outlook for Q3 2024 suggests continued challenges, with an expected drop in realized steel prices. However, the potential increase in shipments across key markets could provide some counterbalance. The company's focus on high-value sectors like automotive and its strategic investments in expansion programs could help navigate these challenging market conditions.
Ternium's Q2 2024 results offer valuable insights into broader market trends. The company's performance reflects the complex interplay of global economic factors affecting the steel industry.
In Mexico, we see the impact of nearshoring activities driving growth in the construction sector. This trend, fueled by geopolitical shifts and supply chain reconfiguration, could provide a sustained boost to steel demand in the region. The continued growth in the automotive industry also aligns with global trends of recovery in this sector.
The Brazilian market presents a dichotomy. While domestic demand is improving, particularly in automotive and industrial sectors, the high level of steel imports suggests ongoing global overcapacity issues. This highlights the challenges faced by domestic producers in competitive global markets.
The volatility in iron ore prices, reaching both 12-month peaks and near-lows in the first half of 2024, underscores the unpredictability in raw material markets. This volatility can significantly impact steel producers' margins and requires adept management of input costs.
Ternium's substantial capital expenditures, including investments in new facilities and renewable energy, reflect a long-term strategic focus on efficiency and sustainability. This approach aligns with global trends towards greener steel production and could position the company favorably in an increasingly environmentally conscious market.
The company's cautious outlook for Q3, expecting lower margins but increased shipments, suggests a volume-over-price strategy in response to current market conditions. This approach could help maintain market share but may pressure profitability in the short term.
LUXEMBOURG / ACCESSWIRE / July 30, 2024 / Ternium S.A. (NYSE:TX) today announced its results for the second quarter and first half ended June 30, 2024.
The financial and operational information contained in this press release is based on Ternium S.A.'s operational data and consolidated condensed interim financial statements prepared in accordance with IAS 34 "Interim financial reporting" (IFRS) and presented in US dollars ($) and metric tons. Interim financial figures are unaudited. This press release includes certain non-IFRS alternative performance measures such as Adjusted EBITDA, Cash Operating Income, Net Cash, Free Cash Flow, Adjusted Net Income, Adjusted Equity Holders' Net Income and Adjusted Earnings per ADS. The reconciliation of these figures to the most directly comparable IFRS measures is included in Exhibit I.
Second Quarter of 2024 Highlights
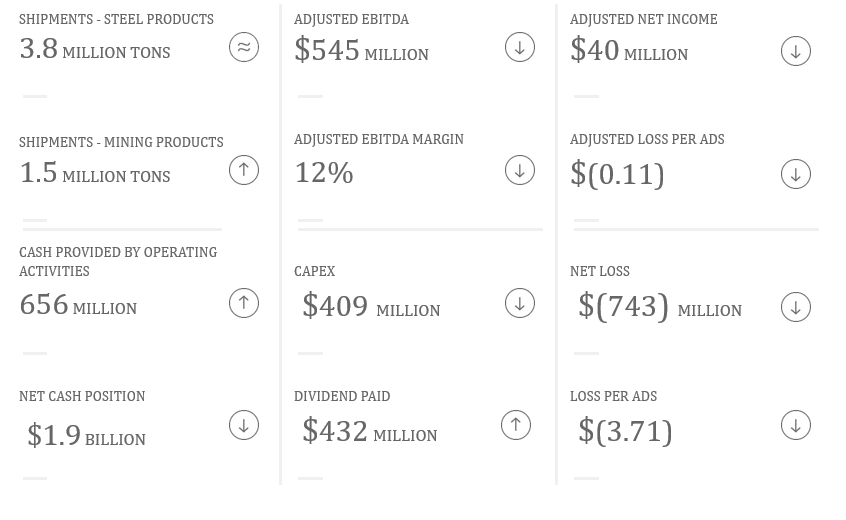
Summary of Second Quarter of 2024 Results
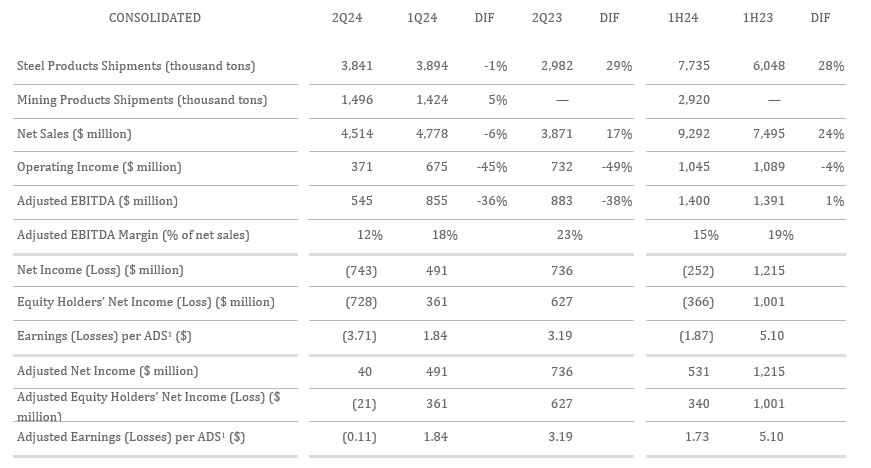
1 American Depositary Share. Each ADS represents 10 shares of Ternium's common stock. Results are based on a weighted average number of shares of common stock outstanding (net of treasury shares) of 1,963,076,776.
Second Quarter of 2024 Highlights
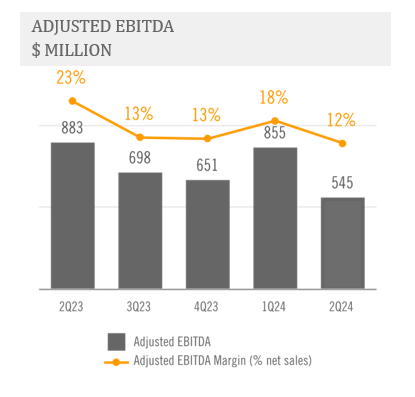
Ternium's Adjusted EBITDA reached
The company recorded in the second quarter of 2024 a
In the second quarter of 2024, Ternium had a net loss of
In May 2024, Ternium paid a dividend of
Steel shipments in the second quarter of 2024 increased in Brazil and the Southern Region. Such increases, however, were offset by a slight decrease in sales volumes in Mexico and lower shipments in Other Markets.
In Mexico, steel demand from automotive manufacturers continued growing during the second quarter, reflecting the positive momentum of this industry. On the other hand, activity in the Mexican commercial steel market was negatively affected by a downward trend in steel prices. Furthermore, customer demand in the home appliances and HVAC sectors softened in the period, reflecting a relatively sluggish construction market in North America in a context of high interest rates.
In Brazil, there was a pick-up in steel demand in the second quarter, particularly in the automotive and industrial sectors. However, imports of steel products remained high, with a significant year-over-year expansion in the first half of 2024.
In the Southern Region, steel demand in the second quarter reflected improving conditions in the Argentine market, as industrial customer demand and the commercial market showed a gradual recovery.
Outlook
Ternium expects a sequential decline in adjusted EBITDA for the third quarter of 2024, primarily attributed to reduced margins partially offset by an increase in shipments across key markets. The company anticipates a drop in realized steel prices, largely as a result of the reset of quarterly and six-months contract prices in Mexico.
The company expects consistent demand in Mexico's industrial and commercial markets, with supply chain stocks at manageable levels. The automotive industry continues to grow and the construction sector is enjoying an upswing in investment from nearshoring activities, leading to the establishment of new factories and a growing need for warehousing and logistics facilities.
In Brazil, Ternium anticipates a modest rise in shipments, supported by the automotive industry's projected growth and better activity in the construction sector. On the other hand, despite the recent establishment of a quota system to regulate steel imports in the country, imports during the second quarter remained elevated.
In Argentina, Ternium expects shipments to increase in the third quarter of 2024 after a destocking process in the second quarter, although the pace of the recovery remains uncertain.
Analysis of Second Quarter of 2024 Results
Consolidated Net Sales
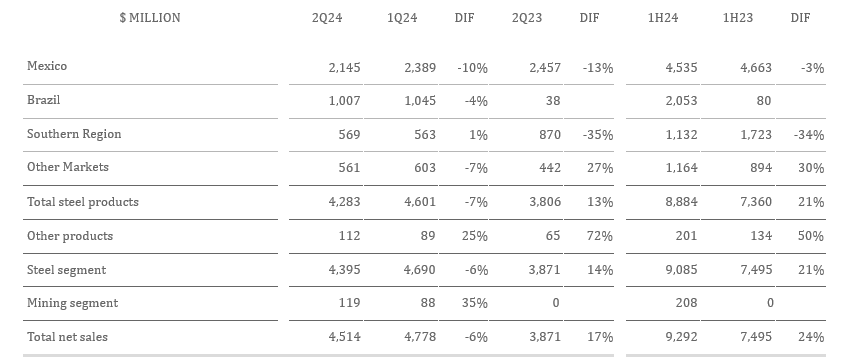
Note: other products include mainly electricity sales in Mexico and Brazil.
Adjusted EBITDA
Adjusted EBITDA in the second quarter of 2024 equals Net Income adjusted to exclude:
Income Tax Results;
Net Financial Results;
Depreciation and Amortization;
Equity in Results of Non-consolidated Companies;
Provision for ongoing litigation related to the acquisition of a participation in Usiminas in 2012; and
Reversal of other Usiminas contingencies recognized as part of the PPA.
And adjusted to include the proportional EBITDA in Unigal (
Adjusted EBITDA Margin equals Adjusted EBITDA divided by net sales. For more information see Exhibit I - Alternative performance measures - "Adjusted EBITDA".
Steel Segment
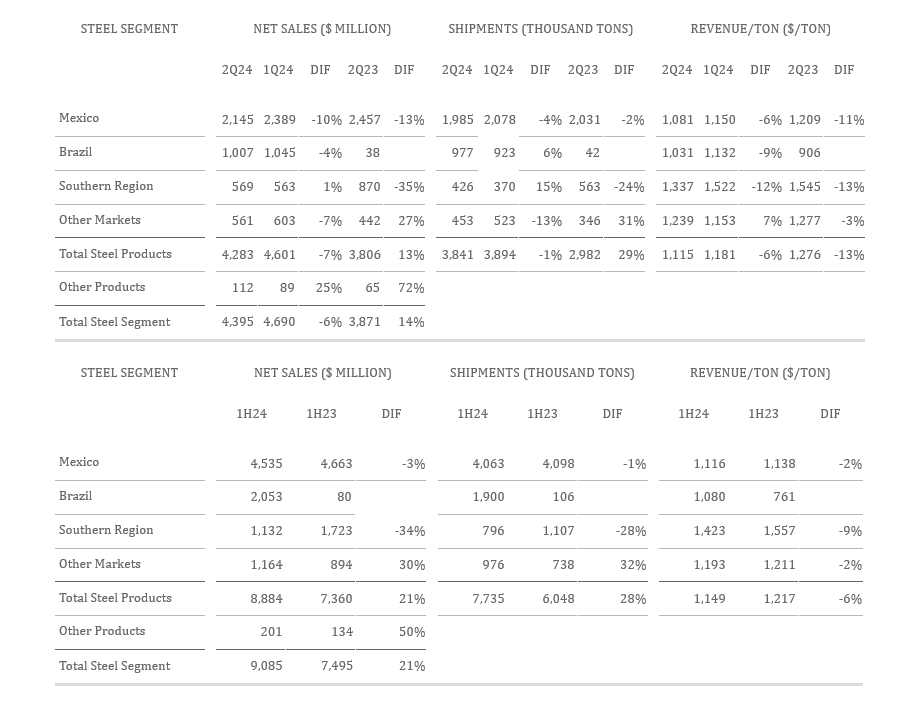
The Steel Segment net sales were down sequentially in the second quarter of 2024, mostly as a result of decreasing realized steel prices in Ternium's main steel markets. On a year-over-year basis, the consolidation of Usiminas added
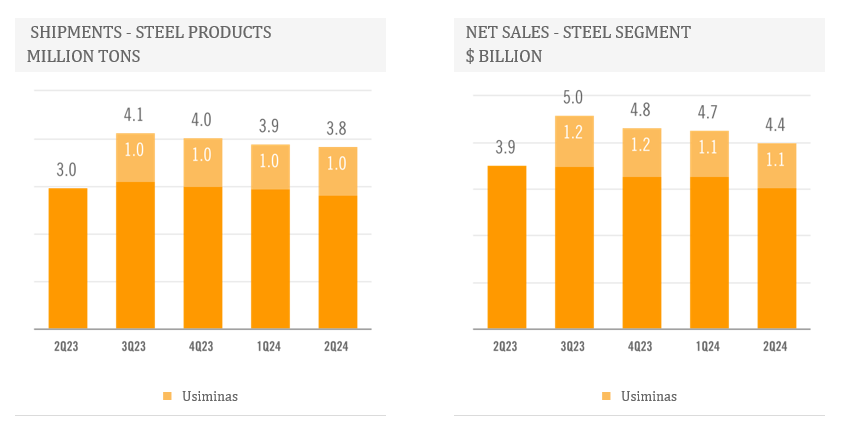
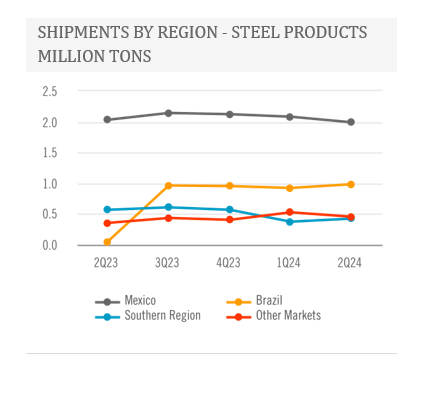
Steel products shipments in Mexico were slightly down sequentially in the second quarter, as the strength of Mexican automotive industry was offset by soft demand in the home appliances and HVAC sectors. In addition, the company's value chain was subject to disruptions caused by a tropical storm in June. Activity in Mexican commercial market remained affected by a downward trend in steel prices.
In Brazil, shipments in the second quarter reflected a widespread pick-up in steel demand. On a year-over-year basis, sales volumes increased 0.9 million tons due to the consolidation of Usiminas.
In the Southern Region, steel shipments in the quarter showed certain sequential recovery mainly as a result of a gradual improvement in the Argentine market.
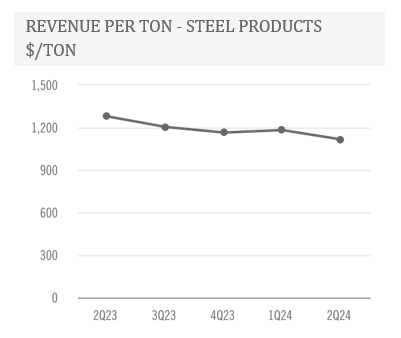
Steel revenue per ton in the second quarter of 2024 decreased sequentially and on a year-over-year basis, reflecting a weak pricing environment in Ternium's main steel markets. Particularly in North America, reference spot prices for hot-rolled flat products decreased to levels close to the lowest recorded in the last 12 months.
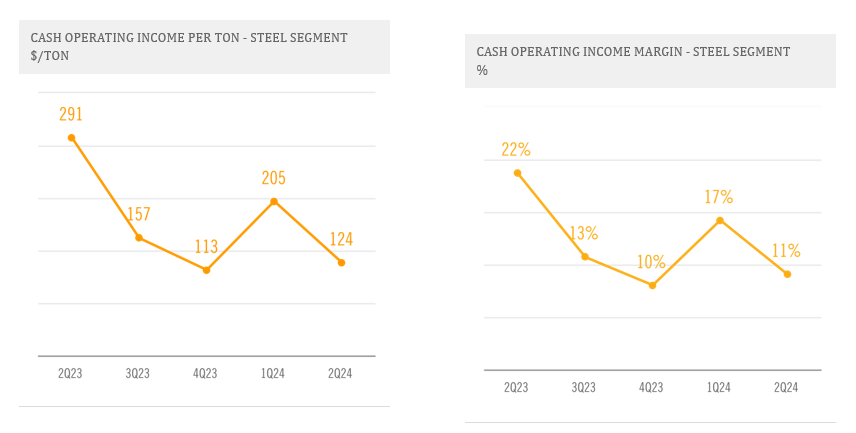
Cash Operating Income equals Operating Income adjusted to exclude depreciation and amortization as well as certain other non-cash and/or non-recurring items. The steel segment's Cash Operating Income per Ton and Margin equal the steel segment's Cash Operating Income divided by Steel Segment's Shipments and Net Sales, respectively. For more information see Exhibit I - Alternative performance measures - "Cash Operating Income - Steel Segment".
Ternium recorded sequentially lower steel segment Cash Operating Income per Ton and Margin in the second quarter of 2024. Reported ratios were negatively impacted by a decrease in realized steel prices in Ternium's main steel markets. In addition, cost per ton in the second quarter increased slightly compared to cost per ton in the prior quarter.
Mining Segment
Ternium reports intercompany and third-party sales of mining products under the Mining segment. The Mining Segment net sales in the second quarter of 2024 remained relatively stable sequentially.
On a year-over-year basis, the consolidation of Usiminas added 2.0 million tons to mining products shipments in the second quarter and
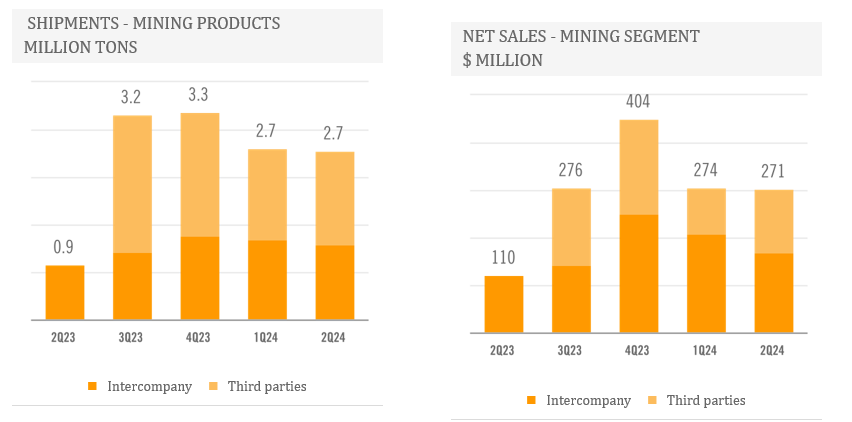
Mining revenue per ton in the second quarter of 2024 remained stable sequentially, as higher realized iron ore prices were offset by a lower participation of higher-priced pellets in the sales mix. Iron ore price volatility remained high in the first half of 2024, with reference prices reaching a 12-month peak early in January and then falling to near the lowest level recorded in the last 12 months.

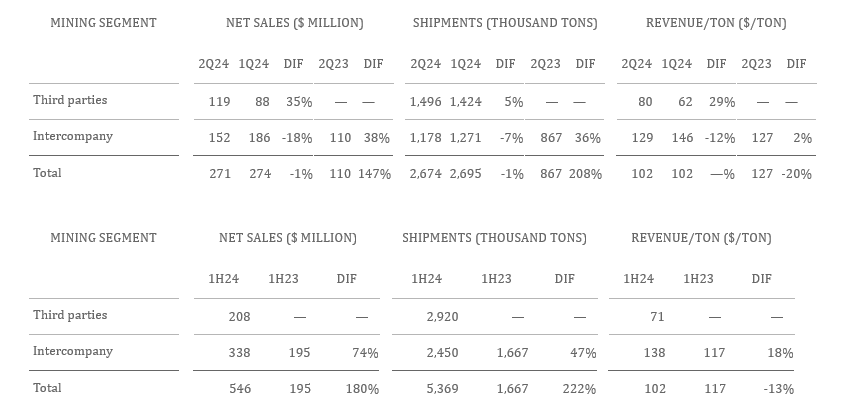
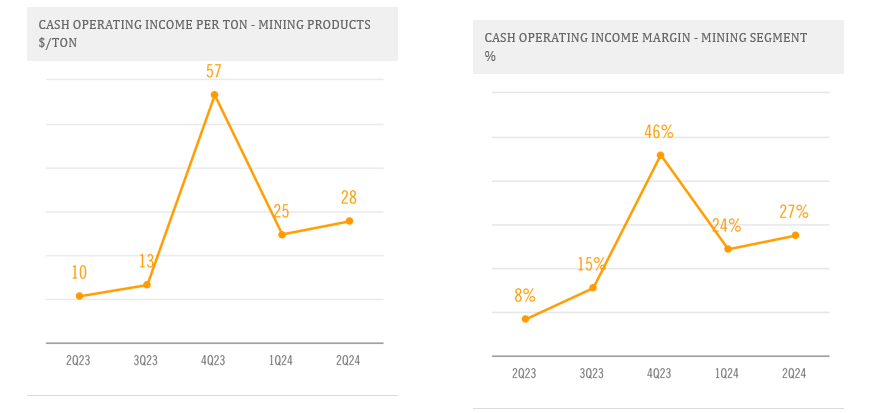
Cash Operating Income equals Operating Income adjusted to exclude depreciation and amortization as well as certain other non-cash and/or non-recurring items. The mining segment Cash Operating Income per Ton and Cash Operating Income Margin equal the mining segment's Cash Operating Income divided by its Shipments and Net Sales, respectively. For more information see Exhibit I - Alternative performance measures - "Cash Operating Income - Mining Segment".
The mining segment's Cash Operating Income per Ton and Margin increased sequentially in the second quarter of 2024, mainly as result of higher iron ore prices partially offset by a lower participation of higher-margin iron ore pellets in the sales mix.
Net Financial Results
In the second quarter of 2024, net foreign exchange results were a loss of
$ MILLION |
|
| 2Q24 |
|
|
| 1Q24 |
|
|
| 2Q23 |
|
|
| 1H24 |
|
|
| 1H23 |
|
|
|
|
|
|
|
|
|
|
|
|
|
|
|
|
|
|
|
|
| |
Net interest results |
|
| 29 |
|
|
| 38 |
|
|
| 24 |
|
|
| 66 |
|
|
| 50 |
|
Net foreign exchange result |
|
| (49 | ) |
|
| (41 | ) |
|
| (25 | ) |
|
| (90 | ) |
|
| (40 | ) |
Change in fair value of financial assets |
|
| (5 | ) |
|
| (137 | ) |
|
| (14 | ) |
|
| (142 | ) |
|
| (10 | ) |
Other financial expense, net |
|
| (13 | ) |
|
| (23 | ) |
|
| (4 | ) |
|
| (36 | ) |
|
| (10 | ) |
Net financial results |
|
| (39 | ) |
|
| (163 | ) |
|
| (18 | ) |
|
| (201 | ) |
|
| (10 | ) |
Income Tax Results
Ternium Mexico, Ternium Argentina and Ternium Brasil use the US dollar as their functional currency and are, therefore, affected by deferred tax results. These results account for the impact of local currency fluctuations against the US dollar, as well as for the effect of local inflation. Effective tax rates in the second quarter and first half of 2024 included, in addition, the effect of a
$ MILLION |
|
| 2Q24 |
|
|
| 1Q24 |
|
|
| 2Q23 |
|
|
| 1H24 |
|
|
| 1H23 |
|
|
|
|
|
|
|
|
|
|
|
|
|
|
|
|
|
|
|
|
| |
Current income tax expense |
|
| (124 | ) |
|
| (126 | ) |
|
| (148 | ) |
|
| (250 | ) |
|
| (286 | ) |
Deferred tax (loss) gain |
|
| (183 | ) |
|
| 86 |
|
|
| 143 |
|
|
| (97 | ) |
|
| 361 |
|
Income tax expense |
|
| (307 | ) |
|
| (40 | ) |
|
| (5 | ) |
|
| (347 | ) |
|
| 74 |
|
Result before income tax |
|
| (436 | ) |
|
| 532 |
|
|
| 741 |
|
|
| 96 |
|
|
| 1,141 |
|
Effective tax rate |
|
| -70 | % |
|
| 8 | % |
|
| 1 | % |
|
| 363 | % |
|
| -7 | % |
|
|
|
|
|
|
|
|
|
|
|
|
|
|
|
|
|
|
|
| |
Excluding | ||||||||||||||||||||
Result before income tax excluding provision |
|
| 347 |
|
|
| 532 |
|
|
| 741 |
|
|
| 879 |
|
|
| 1,141 |
|
Effective tax rate excluding provision |
|
| 88 | % |
|
| 8 | % |
|
| 1 | % |
|
| 40 | % |
|
| -7 | % |
Net Income
In the second quarter of 2024, Adjusted Net Income equaled the period's Net Loss adjusted to exclude a
Net Loss and Adjusted Net Income in the second quarter of 2024 included a deferred tax loss of
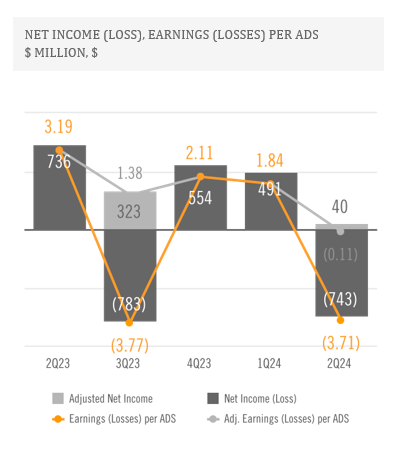
$ MILLION |
|
| 2Q24 |
|
|
| 1Q24 |
|
|
| 2Q23 |
|
|
| 1H24 |
|
|
| 1H23 |
|
|
|
|
|
|
|
|
|
|
|
|
|
|
|
|
|
|
|
|
| |
Owners of the parent |
|
| (728 | ) |
|
| 361 |
|
|
| 627 |
|
|
| (366 | ) |
|
| 1,001 |
|
Non-controlling interest |
|
| (16 | ) |
|
| 130 |
|
|
| 109 |
|
|
| 114 |
|
|
| 214 |
|
Net Income (Loss) |
|
| (743 | ) |
|
| 491 |
|
|
| 736 |
|
|
| (252 | ) |
|
| 1,215 |
|
Excluding provision for ongoing litigation related to acquisiton of Usiminas participation |
|
| (783 | ) |
|
| - |
|
|
| - |
|
|
| (783 | ) |
|
| - |
|
Adjusted Net Income |
|
| 40 |
|
|
| 491 |
|
|
| 736 |
|
|
| 531 |
|
|
| 1,215 |
|
Cash Flow and Liquidity
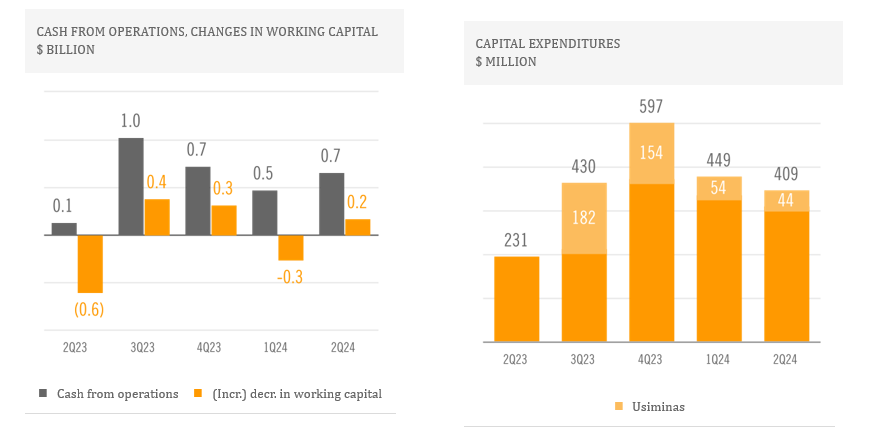
Cash from operations reached
Capital expenditures amounted to
Ternium's net cash position decreased slightly in the second quarter, to
During the period, Ternium paid a dividend to shareholders of
In the second quarter, cash used in Ternium's capital expenditures program and for the dividend payment was largely offset mainly by cash provided by operating activities and a
Conference Call and Webcast
Ternium will host a conference call on July 31, 2024, at 8:30 a.m. ET in which management will discuss second quarter of 2024 results. A webcast link will be available in the Investor Center section of the company's website at www.ternium.com.
Forward Looking Statements
Some of the statements contained in this press release are "forward-looking statements". Forward-looking statements are based on management's current views and assumptions and involve known and unknown risks that could cause actual results, performance or events to differ materially from those expressed or implied by those statements. These risks include but are not limited to risks arising from uncertainties as to gross domestic product, related market demand, global production capacity, tariffs, cyclicality in the industries that purchase steel products, and other factors beyond Ternium's control.
About Ternium
Ternium is a leading steel producer in the Americas, providing advanced steel products to a wide range of manufacturing industries and the construction sector. We invest in low carbon emissions steelmaking technologies to support the energy transition and the mobility of the future. We also support the development of our communities, especially through educational programs in Latin America. More information about Ternium is available at www.ternium.com.
Income Statement
$ MILLION |
|
| 2Q24 |
|
| 1Q24 |
|
| 2Q23 |
|
| 1H24 |
|
| 1H23 |
|
|
|
|
|
|
|
|
|
|
|
|
|
|
|
|
| |
|
|
|
|
|
|
|
|
|
|
|
|
|
|
|
| |
Net sales |
|
| 4,514 |
|
| 4,778 |
|
| 3,871 |
|
| 9,292 |
|
| 7,495 |
|
Cost of sales |
|
| (3,758 |
|
| (3,675 |
|
| (2,839 |
|
| (7,432 | ) |
| (5,820 |
|
Gross profit |
|
| 757 |
|
| 1,104 |
|
| 1,032 |
|
| 1,860 |
|
| 1,674 |
|
Selling, general and administrative expenses |
|
| (435 | ) |
| (431 | ) |
| (304 | ) |
| (866 | ) |
| (597 | ) |
Other operating income |
|
| 49 |
|
| 2 |
|
| 4 |
|
| 51 |
|
| 12 |
|
Operating income |
|
| 371 |
|
| 675 |
|
| 732 |
|
| 1,045 |
|
| 1,089 |
|
|
|
|
|
|
|
|
|
|
|
|
|
|
|
|
| |
Financial expense |
|
| (45 | ) |
| (45 | ) |
| (18 | ) |
| (90 | ) |
| (34 | ) |
Financial income |
|
| 73 |
|
| 83 |
|
| 42 |
|
| 156 |
|
| 83 |
|
Other financial (expense) income, net |
|
| (67 | ) |
| (200 | ) |
| (42 | ) |
| (267 |
|
| (60 | ) |
Equity in earnings of non-consolidated companies |
|
| 15 |
|
| 20 |
|
| 27 |
|
| 34 |
|
| 62 |
|
Provision for ongoing litigation related to the acquisition of a participation in Usiminas |
|
| (783 | ) |
| - |
|
| - |
|
| (783 | ) |
| - |
|
Profit (Loss) before income tax results |
|
| (436 |
|
| 532 |
|
| 741 |
|
| 96 |
|
| 1,141 |
|
Income tax (expense) credit |
|
| (307 | ) |
| (40 | ) |
| (5 | ) |
| (347 | ) |
| 74 |
|
Profit (Loss) for the period |
|
| (743 | ) |
| 491 |
|
| 736 |
|
| (252 | ) |
| 1,215 |
|
|
|
|
|
|
|
|
|
|
|
|
|
|
|
|
| |
Attributable to: |
|
|
|
|
|
|
|
|
|
|
|
|
|
|
|
|
Owners of the parent |
|
| (728 |
|
| 361 |
|
| 627 |
|
| (366 | ) |
| 1,001 |
|
Non-controlling interest |
|
| (16 | ) |
| 130 |
|
| 109 |
|
| 114 |
|
| 214 |
|
Net (Loss) Profit for the period |
|
| (743 |
|
| 491 |
|
| 736 |
|
| (252 | ) |
| 1,215 |
|
Statement of Financial Position
$ MILLION |
| JUNE 30, |
|
| DECEMBER 31, |
| ||
|
|
|
|
|
| |||
Property, plant and equipment, net |
|
| 7,911 |
|
|
| 7,638 |
|
Intangible assets, net |
|
| 1,050 |
|
|
| 996 |
|
Investments in non-consolidated companies |
|
| 497 |
|
|
| 517 |
|
Other investments |
|
| 31 |
|
|
| 211 |
|
Deferred tax assets |
|
| 1,389 |
|
|
| 1,713 |
|
Receivables, net |
|
| 943 |
|
|
| 1,073 |
|
Total non-current assets |
|
| 11,822 |
|
|
| 12,149 |
|
|
|
|
|
|
|
|
| |
Receivables, net |
|
| 969 |
|
|
| 1,173 |
|
Derivative financial instruments |
|
| 7 |
|
|
| 15 |
|
Inventories, net |
|
| 5,048 |
|
|
| 4,948 |
|
Trade receivables, net |
|
| 1,973 |
|
|
| 2,065 |
|
Other investments |
|
| 2,117 |
|
|
| 1,976 |
|
Cash and cash equivalents |
|
| 1,719 |
|
|
| 1,846 |
|
Total current assets |
|
| 11,833 |
|
|
| 12,024 |
|
|
|
|
|
|
|
|
| |
Non-current assets classified as held for sale |
|
| 8 |
|
|
| 7 |
|
|
|
|
|
|
|
|
| |
Total assets |
|
| 23,663 |
|
|
| 24,179 |
|
Statement of Financial Position (cont.)
$ MILLION |
| JUNE 30, |
|
| DECEMBER 31, 2023 |
| ||
|
|
|
|
|
| |||
Capital and reserves attributable to the owners of the parent |
|
| 11,881 |
|
|
| 12,419 |
|
Non-controlling interest |
|
| 4,274 |
|
|
| 4,393 |
|
Total equity |
|
| 16,155 |
|
|
| 16,812 |
|
|
|
|
|
|
|
|
| |
Provisions |
|
| 637 |
|
|
| 840 |
|
Deferred tax liabilities |
|
| 30 |
|
|
| 171 |
|
Other liabilities |
|
| 1,102 |
|
|
| 1,149 |
|
Trade payables |
|
| 6 |
|
|
| 12 |
|
Lease liabilities |
|
| 177 |
|
|
| 189 |
|
Borrowings |
|
| 1,232 |
|
|
| 1,206 |
|
Total non-current liabilities |
|
| 3,183 |
|
|
| 3,567 |
|
|
|
|
|
|
|
|
| |
Provision for ongoing litigation related to the acquisition of a participation in Usiminas |
|
| 783 |
|
|
| - |
|
Current income tax liabilities |
|
| 38 |
|
|
| 137 |
|
Other liabilities |
|
| 444 |
|
|
| 430 |
|
Trade payables |
|
| 2,250 |
|
|
| 2,233 |
|
Derivative financial instruments |
|
| 7 |
|
|
| 8 |
|
Lease liabilities |
|
| 50 |
|
|
| 52 |
|
Borrowings |
|
| 752 |
|
|
| 940 |
|
Total current liabilities |
|
| 4,324 |
|
|
| 3,801 |
|
|
|
|
|
|
|
|
| |
Total liabilities |
|
| 7,508 |
|
|
| 7,367 |
|
|
|
|
|
|
|
|
| |
Total equity and liabilities |
|
| 23,663 |
|
|
| 24,179 |
|
Statement of Cash Flows
$ MILLION |
| 2Q24 |
|
| 1Q24 |
|
| 2Q23 |
|
| 1H24 |
|
| 1H23 |
|
|
|
|
|
|
|
|
|
|
|
|
|
|
|
| |
Result for the period |
| (743 | ) |
| 491 |
|
| 736 |
|
| (252 | ) |
| 1,215 |
|
|
|
|
|
|
|
|
|
|
|
|
|
|
|
| |
Adjustments for: |
|
|
|
|
|
|
|
|
|
|
|
|
|
|
|
Depreciation and amortization |
| 199 |
|
| 171 |
|
| 151 |
|
| 370 |
|
| 301 |
|
Income tax accruals less payments |
| 283 |
|
| (13 | ) |
| (117 | ) |
| 271 |
|
| (273 | ) |
Equity in earnings of non-consolidated companies |
| (15 | ) |
| (20 | ) |
| (27 | ) |
| (34 | ) |
| (62 | ) |
Provision for ongoing litigation related to the acquisition of a participation in Usiminas |
| 783 |
|
| - |
|
| - |
|
| 783 |
|
| - |
|
Interest accruals less payments/receipts, net |
| (11 | ) |
| (2 | ) |
| 6 |
|
| (12 | ) |
| (12 | ) |
Changes in provisions |
| (62 | ) |
| (7 | ) |
| 1 |
|
| (69 | ) |
| - |
|
Changes in working capital |
| 169 |
|
| (266 |
|
| (605 | ) |
| (97 | ) |
| (387 | ) |
Net foreign exchange results and others |
| 52 |
|
| 120 |
|
| (18 | ) |
| 172 |
|
| (19 | ) |
Net cash provided by operating activities |
| 656 |
|
| 475 |
|
| 127 |
|
| 1,132 |
|
| 763 |
|
|
|
|
|
|
|
|
|
|
|
|
|
|
|
| |
Capital expenditures and advances to suppliers for PP&E |
| (409 |
|
| (449 | ) |
| (231 | ) |
| (858 |
|
| (434 | ) |
Decrease (increase) in other investments |
| 329 |
|
| - |
|
| 173 |
|
| 329 |
|
| (513 | ) |
Proceeds from the sale of property, plant & equipment |
| 1 |
|
| 1 |
|
| - |
|
| 1 |
|
| 1 |
|
Dividends received from non-consolidated companies |
| 1 |
|
| 1 |
|
| 15 |
|
| 2 |
|
| 15 |
|
Net cash used in investing activities |
| (79 | ) |
| (447 | ) |
| (42 | ) |
| (526 | ) |
| (931 | ) |
|
|
|
|
|
|
|
|
|
|
|
|
|
|
| |
Dividends paid in cash to company's shareholders |
| (432 | ) |
| - |
|
| (353 | ) |
| (432 | ) |
| (353 | ) |
Dividends paid in cash to non-controlling interest |
| (46 | ) |
| - |
|
| - |
|
| (46 | ) |
| - |
|
Finance lease payments |
| (15 | ) |
| (18 | ) |
| (13 | ) |
| (33 | ) |
| (27 | ) |
Proceeds from borrowings |
| 303 |
|
| 131 |
|
| 27 |
|
| 434 |
|
| 73 |
|
Repayments of borrowings |
| (365 | ) |
| (166 | ) |
| (31 | ) |
| (531 | ) |
| (227 | ) |
Net cash used in financing activities |
| (556 | ) |
| (53 | ) |
| (371 | ) |
| (608 | ) |
| (535 | ) |
|
|
|
|
|
|
|
|
|
|
|
|
|
|
| |
Increase (Decrease) in cash and cash equivalents |
| 22 |
|
| (24 | ) |
| (286 | ) |
| (2 | ) |
| (703 | ) |
Exhibit I - Alternative performance measures
These non-IFRS measures should not be considered in isolation of, or as a substitute for, measures of performance prepared in accordance with IFRS. These non-IFRS measures do not have a standardized meaning under IFRS and, therefore, may not correspond to similar non-IFRS financial measures reported by other companies.
Adjusted EBITDA
$ MILLION |
| 2Q24 |
|
| 1Q24 |
|
| 2Q23 |
|
| 1H24 |
|
| 1H23 |
|
|
|
|
|
|
|
|
|
|
|
|
|
|
|
| |
Net result |
| (743 | ) |
| 491 |
|
| 736 |
|
| (252 | ) |
| 1,215 |
|
Adjusted to exclude: |
|
|
|
|
|
|
|
|
|
|
|
|
|
|
|
Depreciation and amortization |
| 199 |
|
| 171 |
|
| 151 |
|
| 370 |
|
| 301 |
|
Income tax results |
| 307 |
|
| 40 |
|
| 5 |
|
| 347 |
|
| (74 | ) |
Net financial result |
| 39 |
|
| 163 |
|
| 18 |
|
| 201 |
|
| 10 |
|
Equity in earnings of non-consolidated companies |
| (15 | ) |
| (20 | ) |
| (27 | ) |
| (34 | ) |
| (62 | ) |
Provision for ongoing litigation related to the acquisition of a participation in Usiminas |
| 783 |
|
| - |
|
| - |
|
| 783 |
|
| - |
|
Reversal of other Usiminas contingencies recognized as part of the PPA |
| (34 | ) |
| - |
|
| - |
|
| (34 | ) |
| - |
|
Adjusted to include: |
|
|
|
|
|
|
|
|
|
|
|
|
|
|
|
Proportional EBITDA in Unigal ( |
| 9 |
|
| 9 |
|
| - |
|
| 18 |
|
| - |
|
Adjusted EBITDA |
| 545 |
|
| 855 |
|
| 883 |
|
| 1,400 |
|
| 1,391 |
|
Divided by: net sales |
| 4,514 |
|
| 4,778 |
|
| 3,871 |
|
| 9,292 |
|
| 7,495 |
|
Adjusted EBITDA Margin (%) |
| 12 | % |
| 18 | % |
| 23 | % |
| 15 | % |
| 19 | % |
Exhibit I - Alternative performance measures (cont.)
Cash Operating Income - Steel Segment
$ MILLION |
|
| 2Q24 |
|
| 1Q24 |
|
| 2Q23 |
|
| 1H24 |
|
| 1H23 |
|
|
|
|
|
|
|
|
|
|
|
|
|
|
|
|
| |
Operating Income - Management View (Note "Segment Information" to Ternium's Financial Statements as of the corresponding dates) |
|
| 278 |
|
| 593 |
|
| 597 |
|
| 871 |
|
| 1,117 |
|
Plus/Minus differences in cost of sales (IFRS) |
|
| 88 |
|
| 59 |
|
| 144 |
|
| 147 |
|
| 5 |
|
Excluding depreciation and amortization |
|
| 134 |
|
| 137 |
|
| 126 |
|
| 271 |
|
| 253 |
|
Excluding reversal of other Usiminas contingencies |
|
| (34 | ) |
| - |
|
| - |
|
| (34 | ) |
| - |
|
Including proportional EBITDA in Unigal ( |
|
| 9 |
|
| 9 |
|
| - |
|
| 18 |
|
| - |
|
Cash Operating Income |
|
| 476 |
|
| 798 |
|
| 867 |
|
| 1,274 |
|
| 1,374 |
|
Divided by steel shipments (thousand tons) |
|
| 3,841 |
|
| 3,894 |
|
| 2,982 |
|
| 7,735 |
|
| 6,048 |
|
Cash Operating Income per Ton - Steel |
|
| 124 |
|
| 205 |
|
| 291 |
|
| 165 |
|
| 227 |
|
Divided by steel net sales |
|
| 4,395 |
|
| 4,690 |
|
| 3,871 |
|
| 9,085 |
|
| 7,495 |
|
Cash Operating Income Margin - Steel (%) |
|
| 12 | % |
| 17 | % |
| 22 | % |
| 14 | % |
| 18 | % |
Cash Operating Income - Mining Segment
$ MILLION |
|
| 2Q24 |
|
| 1Q24 |
|
| 2Q23 |
|
| 1H24 |
|
| 1H23 |
|
|
|
|
|
|
|
|
|
|
|
|
|
|
|
|
| |
Operating Income - Management View (Note "Segment Information" to Ternium's Financial Statements as of the corresponding dates) |
|
| (52 | ) |
| (22 | ) |
| (25 | ) |
| (74 | ) |
| (31 | ) |
Plus/minus differences in cost of sales (IFRS) |
|
| 61 |
|
| 54 |
|
| 10 |
|
| 115 |
|
| (6 | ) |
Excluding depreciation and amortization |
|
| 65 |
|
| 34 |
|
| 25 |
|
| 99 |
|
| 49 |
|
Cash Operating Income |
|
| 74 |
|
| 66 |
|
| 9 |
|
| 140 |
|
| 12 |
|
Divided by mining shipments (thousand tons) |
|
| 2,674 |
|
| 2,695 |
|
| 867 |
|
| 5,369 |
|
| 1,667 |
|
Cash Operating Income per Ton - Mining |
|
| 28 |
|
| 25 |
|
| 10 |
|
| 26 |
|
| 7 |
|
Divided by mining net sales |
|
| 271 |
|
| 274 |
|
| 110 |
|
| 546 |
|
| 195 |
|
Cash Operating Income Margin - Mining (%) |
|
| 27 | % |
| 24 | % |
| 8 | % |
| 26 | % |
| 6 | % |
|
|
|
|
|
|
|
|
|
|
|
|
|
|
|
|
Exhibit I - Alternative performance measures (cont.)
Adjusted Net Result
$ MILLION |
|
| 2Q24 |
|
|
| 3Q23 |
|
|
|
|
|
|
|
|
| |
Net loss |
|
| (743 | ) |
|
| (783 | ) |
Excluding non-cash effects related to the increase in the participation in Usiminas |
|
| - |
|
|
| (1,106 | ) |
Excluding provision for ongoing litigation related to the acquisiton of a participation in Usiminas |
|
| (783 | ) |
|
| - |
|
Adjusted Net Result |
|
| 40 |
|
|
| 323 |
|
Adjusted Equity Holders' Net Result and Adjusted Earnings (Losses) per ADS
$ MILLION |
|
| 2Q24 |
|
|
| 3Q23 |
|
|
|
|
|
|
|
|
| |
Equity holders' net loss |
|
| (728 | ) |
|
| (739 | ) |
Excluding non-cash effects related to the increase in the participation in Usiminas |
|
| - |
|
|
| (1,010 | ) |
Excluding provision for ongoing litigation related to the acquisiton of a participation in Usiminas |
|
| (706 | ) |
|
| - |
|
Adjusted Equity Holders' Net Result |
|
| (21 | ) |
|
| 271 |
|
Divided by: outstanding shares of common stock, net of treasury shares (expressed in million of ADS equivalent) |
|
| 196 |
|
|
| 196 |
|
Adjusted Earnings (Losses) per ADS ($) |
|
| (0.11 | ) |
|
| 1.38 |
|
Free Cash Flow
$ MILLION |
|
| 2Q24 |
|
| 1Q24 |
|
| 2Q23 |
|
| 1H24 |
|
| 1H23 |
|
|
|
|
|
|
|
|
|
|
|
|
|
|
|
|
| |
Net cash provided by operating activities |
|
| 656 |
|
| 475 |
|
| 127 |
|
| 1,132 |
|
| 763 |
|
Excluding capital expenditures and advances to suppliers for PP&E |
|
| (409 | ) |
| (449 | ) |
| (231 | ) |
| (858 | ) |
| (434 | ) |
Free cash flow |
|
| 248 |
|
| 26 |
|
| (104 | ) |
| 274 |
|
| 329 |
|
Note: Free Cash Flow in the comparative quarters in 2023 has been modified due to a reclassification, moving the following amounts from interest accruals less payments to other investments:
Exhibit I - Alternative performance measures (cont.)
Net Cash Position
$ BILLION |
| JUN 30, 2024 |
|
| MAR 31, 2024 |
|
| DEC 31, 2023 |
| |||
|
|
|
|
|
|
|
|
| ||||
Cash and cash equivalents2 |
|
| 1.7 |
|
|
| 1.8 |
|
|
| 1.8 |
|
Plus: other investments (current and non-current)2 |
|
| 2.1 |
|
|
| 2.3 |
|
|
| 2.2 |
|
Less: borrowings (current and non-current) |
|
| (2.0 | ) |
|
| (2.1 | ) |
|
| (2.1 | ) |
Net cash position |
|
| 1.9 |
|
|
| 2.0 |
|
|
| 1.9 |
|
2 Ternium Argentina's consolidated position of cash and cash equivalents and other investments amounted to
Sebastián Martí
Ternium - Investor Relations
+1 (866) 890 0443
+54 (11) 4018 8389
www.ternium.com
SOURCE: Ternium S.A.
View the original press release on accesswire.com


