Ternium Announces Third Quarter and First Nine Months of 2024 Results
Ternium (NYSE:TX) reported its Q3 2024 results with Adjusted EBITDA of $368 million, reflecting relatively low margins despite strong shipment levels. The company achieved record-high sales volumes in Mexico, with increased shipments in Brazil and continued recovery in the Southern Region. However, steel revenue per ton decreased due to lower steel prices and reduced industrial contract prices in Mexico.
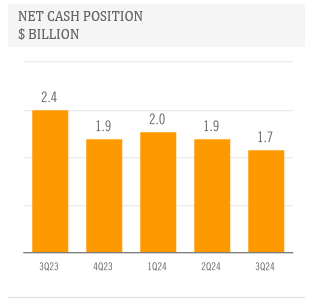
The company's net cash position decreased to $1.7 billion from $1.9 billion in the previous quarter. The board approved an interim dividend of $0.90 per ADS, payable on November 21, 2024. For Q4 2024, Ternium expects a slight sequential increase in adjusted EBITDA due to improved margins, despite anticipated lower shipments due to year-end seasonality.
Ternium (NYSE:TX) ha riportato i risultati del terzo trimestre 2024 con un EBITDA rettificato di 368 milioni di dollari, riflettendo margini relativamente bassi nonostante forti volumi di spedizione. L'azienda ha raggiunto volumi di vendita record in Messico, con aumenti delle spedizioni in Brasile e una continua ripresa nella Regione Meridionale. Tuttavia, i ricavi del settore dell'acciaio per tonnellata sono diminuiti a causa dei prezzi più bassi dell'acciaio e della riduzione dei prezzi dei contratti industriali in Messico.
La posizione di cassa netta dell'azienda è scesa a 1,7 miliardi di dollari rispetto ai 1,9 miliardi del trimestre precedente. Il consiglio di amministrazione ha approvato un dividendo intermedio di 0,90 dollari per ADS, che sarà pagato il 21 novembre 2024. Per il quarto trimestre 2024, Ternium prevede un lieve aumento sequenziale nell'EBITDA rettificato a causa di margini migliorati, nonostante si prevedano spedizioni più basse a causa della stagionalità di fine anno.
Ternium (NYSE:TX) reportó sus resultados del tercer trimestre de 2024 con un EBITDA ajustado de 368 millones de dólares, reflejando márgenes relativamente bajos a pesar de los sólidos niveles de envío. La compañía logró volúmenes de ventas récord en México, con un aumento de los envíos a Brasil y una continua recuperación en la Región Sur. Sin embargo, los ingresos del acero por tonelada disminuyeron debido a los precios más bajos del acero y a la reducción de los precios de contratos industriales en México.
La posición de efectivo neto de la compañía disminuyó a 1.7 mil millones de dólares desde 1.9 mil millones en el trimestre anterior. La junta aprobó un dividendo interino de 0.90 dólares por ADS, que se pagará el 21 de noviembre de 2024. Para el cuarto trimestre de 2024, Ternium espera un ligero aumento secuencial en el EBITDA ajustado debido a márgenes mejorados, a pesar de la previsión de menores envíos debido a la estacionalidad de fin de año.
테르니움 (NYSE:TX)은 2024년 3분기 결과를 보고하며 조정 EBITDA가 3억 6천8백만 달러에 달했으며, 강한 출하량에도 불구하고 상대적으로 낮은 마진을 기록했습니다. 이 회사는 멕시코에서 기록적인 판매량을 달성했으며, 브라질에서 출하량이 증가하고 남부 지역의 지속적인 회복이 있었습니다. 그러나 멕시코에서 낮은 강철 가격과 산업 계약 가격 감소로 인해 톤당 강철 수익이 감소했습니다.
회사의 순 현금 자산은 17억 달러로 감소했습니다, 이전 분기의 19억 달러에서 감소했습니다. 이사회는 ADS당 0.90 달러의 중간 배당금을 승인했으며, 이는 2024년 11월 21일에 지급될 예정입니다. 2024년 4분기에는 연말 시즌성으로 인한 예상 출하량 감소에도 불구하고 개선된 마진에 따라 조정 EBITDA가 소폭 증가할 것으로 기대하고 있습니다.
Ternium (NYSE:TX) a publié ses résultats du 3ème trimestre 2024, avec un EBITDA ajusté de 368 millions de dollars, reflétant des marges relativement faibles malgré des niveaux d'expédition solides. L'entreprise a atteint des volumes de ventes record au Mexique, avec des expéditions en augmentation au Brésil et une reprise continue dans la région Sud. Cependant, le chiffre d'affaires en acier par tonne a baissé en raison de la diminution des prix de l'acier et des prix des contrats industriels au Mexique.
La position de trésorerie nette de l'entreprise a diminué à 1,7 milliard de dollars contre 1,9 milliard de dollars au trimestre précédent. Le conseil d'administration a approuvé un dividende intérimaire de 0,90 dollar par ADS, payable le 21 novembre 2024. Pour le 4ème trimestre 2024, Ternium prévoit une légère augmentation séquentielle de l'EBITDA ajusté en raison de l'amélioration des marges, malgré une baisse anticipée des expéditions en raison de la saisonnalité de fin d'année.
Ternium (NYSE:TX) hat seine Ergebnisse für das 3. Quartal 2024 bekannt gegeben, mit einem bereinigten EBITDA von 368 Millionen Dollar, was relativ niedrige Margen angesichts starker Versandmengen widerspiegelt. Das Unternehmen erzielte Rekordverkaufsvolumen in Mexiko, mit erhöhten Versandmengen in Brasilien und einer anhaltenden Erholung in der Südregion. Allerdings sanken die Stahlumsätze pro Tonne aufgrund niedrigerer Stahlpreise und reduzierter Industrietarifpreise in Mexiko.
Die netto verfügbare Zahlungsmittelposition des Unternehmens sank auf 1,7 Milliarden Dollar im Vergleich zu 1,9 Milliarden Dollar im vorherigen Quartal. Der Vorstand genehmigte eine Zwischendividende von 0,90 Dollar pro ADS, die am 21. November 2024 gezahlt wird. Für das 4. Quartal 2024 erwartet Ternium einen leichten sequenziellen Anstieg des bereinigten EBITDA aufgrund verbesserter Margen, trotz der erwarteten niedrigeren Versandmengen wegen der Saisonalität zum Jahresende.
- Record-high sales volumes achieved in Mexico
- Net cash position remains strong at $1.7 billion
- Interim dividend of $0.90 per ADS approved
- New push-pull pickling line and three finishing lines started operations
- Expected slight increase in Q4 2024 adjusted EBITDA
- Adjusted EBITDA decreased due to lower margins
- Steel revenue per ton declined due to lower prices
- Net cash position decreased by $200 million quarter-over-quarter
- Working capital increased by $155 million
- Expected decline in Q4 2024 shipments due to seasonality
Insights
Ternium's Q3 2024 results show mixed performance with some concerning trends. While shipments reached record levels in Mexico,
Key concerns include declining steel prices in main markets, lower industrial contract prices in Mexico and continued high-cost inventory consumption. The
Notable investments in expansion programs and renewable energy initiatives demonstrate long-term strategic focus, though
Market dynamics show concerning trends across regions. While Mexico achieved record-high shipments, increasing Chinese imports into Brazil pose a competitive threat. Argentina's market shows recovery but remains below historical volumes.
The operational landscape reveals efficiency improvements in blast furnace operations, particularly in fuel consumption. The new push-pull pickling line and three finishing lines starting operations in Pesquería represent significant capacity expansion. The upcoming wind farm in Argentina will enhance cost competitiveness through renewable energy integration.
LUXEMBOURG / ACCESSWIRE / November 5, 2024 / Ternium S.A. (NYSE:TX) today announced its results for the third quarter and first nine months ended September 30, 2024.
The financial and operational information contained in this press release is based on Ternium S.A.'s operational data and consolidated condensed interim financial statements prepared in accordance with IAS 34 "Interim financial reporting" (IFRS) and presented in US dollars ($) and metric tons. Interim financial figures are unaudited. This press release includes certain non-IFRS alternative performance measures such as Adjusted EBITDA, Cash Operating Income, Net Cash, Free Cash Flow, Adjusted Net Income, Adjusted Equity Holders' Net Income and Adjusted Earnings per ADS. The reconciliation of these figures to the most directly comparable IFRS measures is included in Exhibit I.
Third Quarter of 2024 Highlights
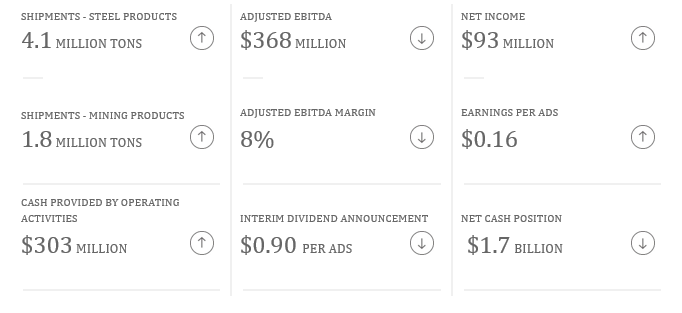
Summary of Third Quarter of 2024 Results
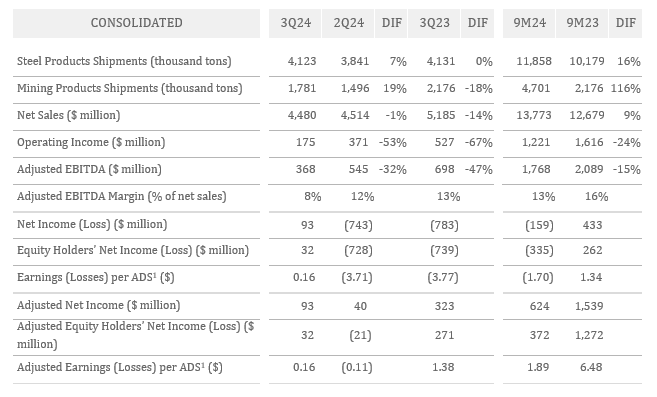
1 American Depositary Share. Each ADS represents 10 shares of Ternium's common stock. Results are based on a weighted average number of shares of common stock outstanding (net of treasury shares) of 1,963,076,776.
Third Quarter of 2024 Highlights
Ternium achieved a strong level of shipments in the third quarter of 2024, on record-high sales volumes in Mexico, higher shipments in Brazil and a continued recovery in the Southern Region.
However, Adjusted EBITDA was
Capital expenditures in the third quarter of 2024 amounted to
Interim Dividend Payment
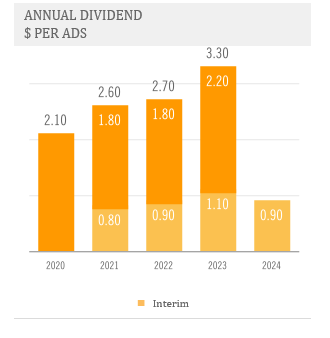
Ternium's board of directors approved the payment of an interim dividend of
The payment date of the interim dividend will be November 21, 2024, with an ex-dividend date on November 15, 2024 and record date on November 18, 2024.
Outlook
Ternium expects a slight sequential increase in adjusted EBITDA for the fourth quarter of 2024 due to improved margins partially offset by a reduction in shipments. Apparent demand in Mexico and Brazil is anticipated to decline due to year-end seasonality in the fourth quarter. Conversely, apparent demand in Argentina is expected to remain relatively stable, albeit at levels below historical volumes.
The company anticipates a continued decrease in cost per ton, as a result of the gradual consumption of lower-priced slabs and raw material inventories. However, realized steel prices are projected to decline in the fourth quarter of 2024 compared to the third quarter of 2024, mainly due to the reset of quarterly price contracts with industrial customers in Mexico at reduced levels.
During the third quarter, the company's new push-pull pickling line in the Pesquería industrial center, as well as three of the five finishing lines in Ternium's downstream expansion project, have started operations and are currently ramping up. In addition, our new wind farm in Argentina is expected to begin operations by year-end, boosting our use of self-generated renewable energy and reducing reliance on external sources. This will represent a significant milestone in our commitment to renewable energy and decarbonization.
Analysis of Third Quarter of 2024 Results
Consolidated Net Sales

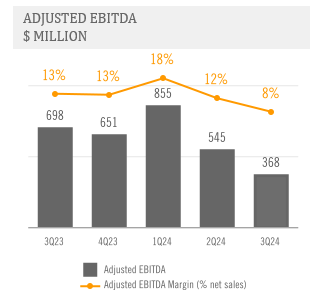
Adjusted EBITDA
Adjusted EBITDA in the third quarter of 2024 equals Net Income adjusted to exclude:
Depreciation and Amortization;
Income Tax Results;
Net Financial Result;
Equity in Results of Non-consolidated Companies; and
Provision for ongoing litigation related to the acquisition of a participation in Usiminas.
And adjusted to include the proportional EBITDA in Unigal (
Adjusted EBITDA Margin equals Adjusted EBITDA divided by net sales. For more information see Exhibit I - Alternative performance measures - "Adjusted EBITDA".
Steel Segment
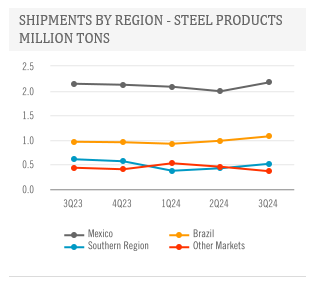
The Steel Segment shipments increased
On a year-over-year basis, the Steel Segment shipments remained stable. Nevertheless, net sales decreased year-over-year as a result of lower steel prices in Ternium's main steel markets.
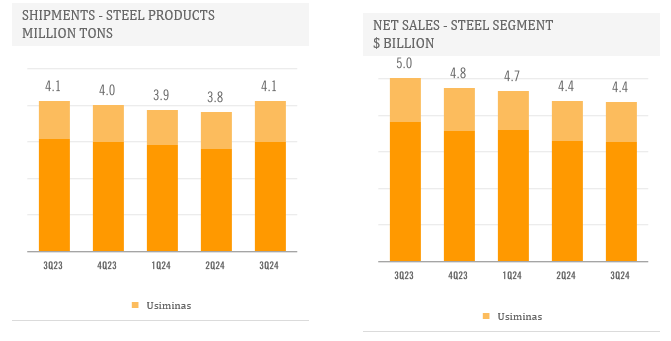
In Mexico, shipments achieved a new record-high in the third quarter of 2024. Sales volumes to the industrial sector increased sequentially, including higher shipments to automotive manufacturers and a recovery in the sales to the HVAC sector. Shipments to the commercial market improved sequentially, albeit from a relatively low base.
In Brazil, shipments to industrial customers and distributors increased sequentially in the third quarter of 2024. On the other hand, sales volumes to automotive manufacturers remained unchanged. Demand for steel products in the country was strong. However, imports of steel products continued increasing in the third quarter, mainly from China.
In the Southern Region, steel shipments continued to recover in the quarter, mainly reflecting better demand in Argentina from the construction sector, the automotive industry, and agribusiness and transportation equipment manufacturers.
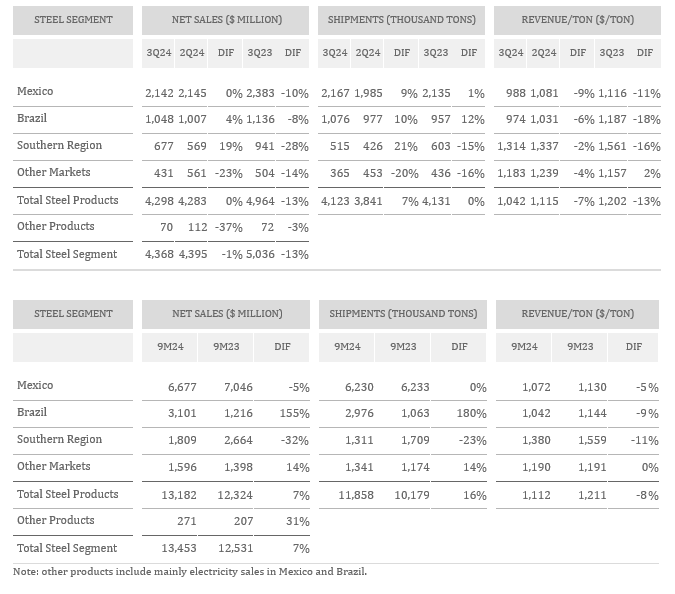
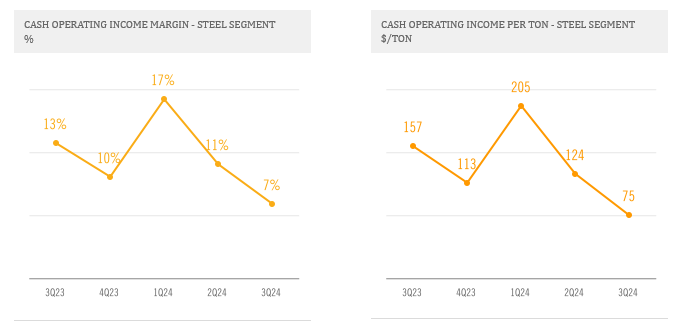
Note: For information on the Steel Segment's Cash Operating Income per Ton and Margin, see Exhibit I - Alternative performance measures - "Cash Operating Income - Steel Segment".
The Steel Segment's Cash Operating Income per Ton and Margin decreased sequentially in the third quarter of 2024 due to lower revenue per ton partially offset by slightly lower cost per ton.
Ternium's and Usiminas' blast furnace operations recorded efficiency gains in the period, particularly in fuel consumption. In addition, labor and maintenance costs decreased sequentially in the third quarter.
On the other hand, the company consumed high-cost inventory in the period. The decrease in raw material and slab market prices during 2024 was not totally reflected on Ternium's cost of sales in the third quarter, as the company consumed inventories produced in prior periods.
Mining Segment
The Mining Segment shipments increased
On a year-over-year basis, iron ore shipments decreased in the third quarter of 2024 reflecting lower production levels in our Mexican and Brazilian operations. Net sales decreased slightly year-over-year in the third quarter, as lower sales volumes were partially offset by higher realized iron ore prices. The increase in revenue per ton was the result of an improved sales mix of iron ore products, partially offset by lower iron ore market prices.
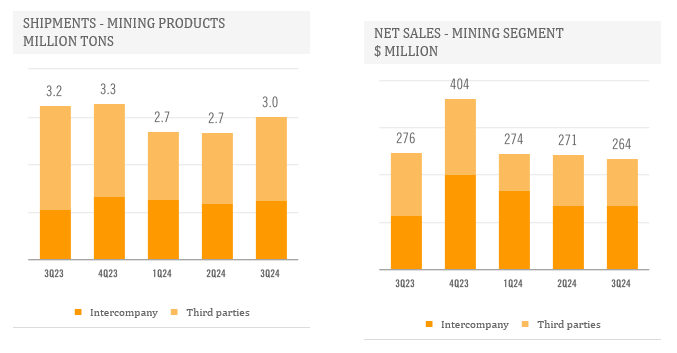
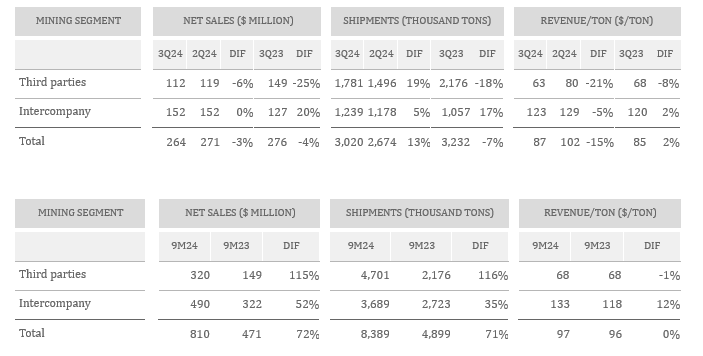
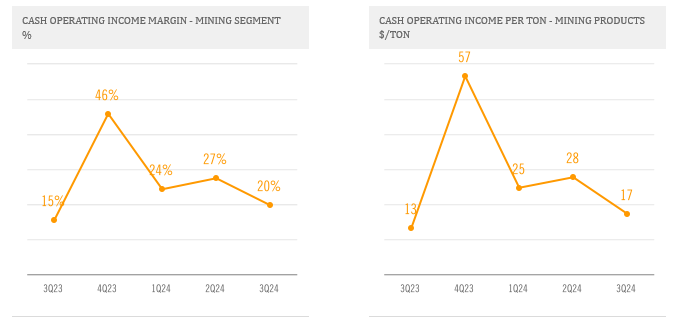
Note: For information on the Mining Segment's Cash Operating Income per Ton and Margin, see Exhibit I - Alternative performance measures - "Cash Operating Income - Mining Segment".
The Mining Segment's Cash Operating Income per Ton and Margin decreased in the third quarter of 2024 due to lower iron ore realized prices, partially offset by a slight decrease in cost per ton. On a year-over-year basis, the Mining Segment's Cash Operating Income per Ton and Margin increased in the third quarter reflecting a slight increase in realized iron ore prices and a slight decrease in cost per ton.
Net Financial Results
Net financial results were a gain of
$ MILLION |
| 3Q24 |
|
| 2Q24 |
|
| 3Q23 |
|
| 9M24 |
|
| 9M23 |
| |||||
|
|
|
|
|
|
|
|
|
|
|
|
|
|
|
|
|
|
|
| |
Net interest results |
|
| 17 |
|
|
| 28 |
|
|
| 30 |
|
|
| 83 |
|
|
| 80 |
|
Net foreign exchange result |
|
| 57 |
|
|
| (49 | ) |
|
| (33 | ) |
|
| (32 | ) |
|
| (73 | ) |
Change in fair value of financial assets |
|
| 11 |
|
|
| (5 | ) |
|
| 36 |
|
|
| (131 | ) |
|
| 26 |
|
Other financial expense, net |
|
| (11 | ) |
|
| (13 | ) |
|
| (4 | ) |
|
| (47 | ) |
|
| (13 | ) |
Net financial results |
|
| 74 |
|
|
| (39 | ) |
|
| 30 |
|
|
| (127 | ) |
|
| 20 |
|
Income Tax Results
Ternium Mexico, Ternium Argentina and Ternium Brasil use the US dollar as their functional currency and are, therefore, affected by deferred tax results. These results account for the impact of local currency fluctuations against the US dollar, as well as for the effect of local inflation. Effective tax rates in the second quarter and first nine months of 2024 included, in addition, the effect of a provision for ongoing litigation related to the acquisition of a participation in Usiminas and, in the third quarter and first nine months of 2023, certain non-cash effects related to the increase in the participation in Usiminas.
$ MILLION |
| 3Q24 |
|
| 2Q24 |
|
| 3Q23 |
|
| 9M24 |
|
| 9M23 |
| |||||
|
|
|
|
|
|
|
|
|
|
|
|
|
|
|
|
|
|
|
| |
Current income tax expense |
|
| (63 | ) |
|
| (124 | ) |
|
| (164 | ) |
|
| (312 | ) |
|
| (450 | ) |
Deferred tax (loss) gain |
|
| (80 | ) |
|
| (183 | ) |
|
| (89 | ) |
|
| (178 | ) |
|
| 271 |
|
Income tax expense |
|
| (143 | ) |
|
| (307 | ) |
|
| (253 | ) |
|
| (490 | ) |
|
| (179 | ) |
Result before income tax |
|
| 236 |
|
|
| (436 | ) |
|
| (530 | ) |
|
| 331 |
|
|
| 611 |
|
Effective tax rate |
|
| 61 | % |
|
| -70 | % |
|
| -48 | % |
|
| 148 | % |
|
| 29 | % |
|
|
|
|
|
|
|
|
|
|
|
|
|
|
|
|
|
|
|
| |
Excluding provision in the 2Q24 for ongoing litigation related to the acquisition of a participation in Usiminas in 2012 |
|
| - |
|
|
| (783 | ) |
|
| - |
|
|
| (783 | ) |
|
| - |
|
Excluding non-cash effects in the 3Q23 related to the increase in the participation in Usiminas |
|
| - |
|
|
| - |
|
|
| (1,106 | ) |
|
| - |
|
|
| (1,106 | ) |
Result before income tax excluding provision and non-cash effects |
|
| 236 |
|
|
| 347 |
|
|
| 576 |
|
|
| 1,114 |
|
|
| 1,717 |
|
Effective tax rate excluding provision and non-cash effects |
|
| 61 | % |
|
| 88 | % |
|
| 44 | % |
|
| 44 | % |
|
| 10 | % |
Net Income
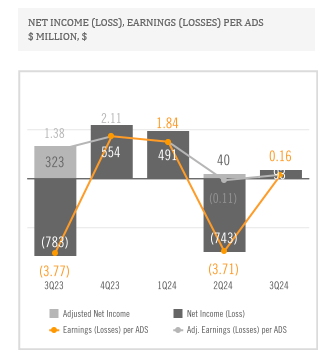
Net Income was
Equity Holder's Net Income was
$ MILLION |
| 3Q24 |
|
| 2Q24 |
|
| 3Q23 |
|
| 9M24 |
|
| 9M23 |
| |||||
|
|
|
|
|
|
|
|
|
|
|
|
|
|
|
|
|
|
|
| |
Owners of the parent |
|
| 32 |
|
|
| (728 | ) |
|
| (739 | ) |
|
| (335 | ) |
|
| 262 |
|
Non-controlling interest |
|
| 61 |
|
|
| (16 | ) |
|
| (44 | ) |
|
| 176 |
|
|
| 170 |
|
Net Income (Loss) |
|
| 93 |
|
|
| (743 | ) |
|
| (783 | ) |
|
| (159 | ) |
|
| 433 |
|
|
|
|
|
|
|
|
|
|
|
|
|
|
|
|
|
|
|
|
| |
Excluding provision in the 2Q24 for ongoing litigation related to the acquisition of a participation in Usiminas in 2012 |
|
| - |
|
|
| (783 | ) |
|
| - |
|
|
| (783 | ) |
|
| - |
|
Excluding non-cash effects in the 3Q23 related to the increase in the participation in Usiminas |
|
| - |
|
|
| - |
|
|
| (1,106 | ) |
|
| - |
|
|
| (1,106 | ) |
Adjusted Net Income |
|
| 93 |
|
|
| 40 |
|
|
| 323 |
|
|
| 624 |
|
|
| 1,539 |
|
Cash Flow and Liquidity
Cash from operations reached
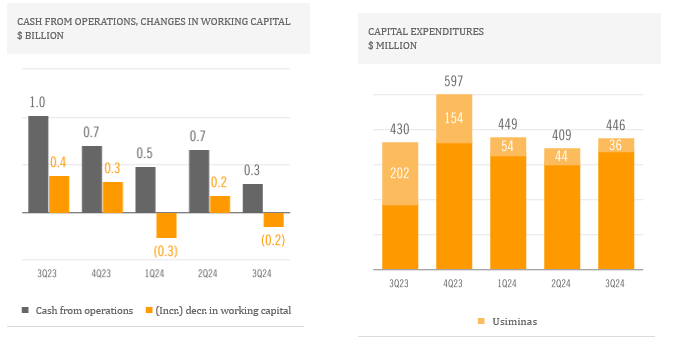
Ternium's net cash position in the third quarter decreased to
On November 21, 2024, the company will pay an interim dividend to shareholders of
Conference Call and Webcast
Ternium will host a conference call on November 6, 2024, at 8:30 a.m. ET in which management will discuss third quarter of 2024 results. A webcast link will be available in the Investor Center section of the company's website at www.ternium.com.
Forward Looking Statements
Some of the statements contained in this press release are "forward-looking statements". Forward-looking statements are based on management's current views and assumptions and involve known and unknown risks that could cause actual results, performance or events to differ materially from those expressed or implied by those statements. These risks include but are not limited to risks arising from uncertainties as to gross domestic product, related market demand, global production capacity, tariffs, cyclicality in the industries that purchase steel products, and other factors beyond Ternium's control.
About Ternium
Ternium is a leading steel producer in the Americas, providing advanced steel products to a wide range of manufacturing industries and the construction sector. We invest in low carbon emissions steelmaking technologies to support the energy transition and the mobility of the future. We also support the development of our communities, especially through educational programs in Latin America. More information about Ternium is available at www.ternium.com.
Income Statement
$ MILLION |
| 3Q24 |
|
| 2Q24 |
|
| 3Q23 |
|
| 9M24 |
|
| 9M23 |
| |||||
|
|
|
|
|
|
|
|
|
|
|
|
|
|
|
|
|
|
|
| |
Net sales |
|
| 4,480 |
|
|
| 4,514 |
|
|
| 5,185 |
|
|
| 13,773 |
|
|
| 12,679 |
|
Cost of sales |
|
| (3,902 | ) |
|
| (3,758 | ) |
|
| (4,192 | ) |
|
| (11,334 | ) |
|
| (10,012 | ) |
Gross profit |
|
| 578 |
|
|
| 757 |
|
|
| 993 |
|
|
| 2,439 |
|
|
| 2,667 |
|
Selling, general and administrative expenses |
|
| (412 | ) |
|
| (435 | ) |
|
| (443 | ) |
|
| (1,278 | ) |
|
| (1,040 | ) |
Other operating income |
|
| 9 |
|
|
| 49 |
|
|
| (22 | ) |
|
| 60 |
|
|
| (11 | ) |
Operating income |
|
| 175 |
|
|
| 371 |
|
|
| 527 |
|
|
| 1,221 |
|
|
| 1,616 |
|
|
|
|
|
|
|
|
|
|
|
|
|
|
|
|
|
|
|
|
| |
Financial expense |
|
| (54 | ) |
|
| (45 | ) |
|
| (47 | ) |
|
| (144 | ) |
|
| (81 | ) |
Financial income |
|
| 71 |
|
|
| 73 |
|
|
| 78 |
|
|
| 227 |
|
|
| 161 |
|
Other financial (expense) income, net |
|
| 57 |
|
|
| (67 | ) |
|
| 0 |
|
|
| (210 | ) |
|
| (60 | ) |
Equity in earnings of non-consolidated companies |
|
| 17 |
|
|
| 15 |
|
|
| 19 |
|
|
| 51 |
|
|
| 81 |
|
Effect related to the increase of the participation in Usiminas |
|
| - |
|
|
| - |
|
|
| (171 | ) |
|
| - |
|
|
| (171 | ) |
Recycling of other comprehensive income related to Usiminas |
|
| - |
|
|
| - |
|
|
| (935 | ) |
|
| - |
|
|
| (935 | ) |
Provision for ongoing litigation related to the acquisition of a participation in Usiminas |
|
| (31 | ) |
|
| (783 | ) |
|
| - |
|
|
| (814 | ) |
|
| - |
|
Profit (Loss) before income tax results |
|
| 236 |
|
|
| (436 | ) |
|
| (530 | ) |
|
| 331 |
|
|
| 611 |
|
Income tax (expense) credit |
|
| (143 | ) |
|
| (307 | ) |
|
| (253 | ) |
|
| (490 | ) |
|
| (179 | ) |
Profit (Loss) for the period |
|
| 93 |
|
|
| (743 | ) |
|
| (783 | ) |
|
| (159 | ) |
|
| 433 |
|
|
|
|
|
|
|
|
|
|
|
|
|
|
|
|
|
|
|
|
| |
Attributable to: |
|
|
|
|
|
|
|
|
|
|
|
|
|
|
|
|
|
|
|
|
Owners of the parent |
|
| 32 |
|
|
| (728 | ) |
|
| (739 | ) |
|
| (335 | ) |
|
| 262 |
|
Non-controlling interest |
|
| 61 |
|
|
| (16 | ) |
|
| (44 | ) |
|
| 176 |
|
|
| 170 |
|
Net Profit (Loss) for the period |
|
| 93 |
|
|
| (743 | ) |
|
| (783 | ) |
|
| (159 | ) |
|
| 433 |
|
Statement of Financial Position
$ MILLION |
| SEPTEMBER 30, 2024 |
|
| DECEMBER 31, 2023 |
| ||
|
|
|
|
|
| |||
Property, plant and equipment, net |
|
| 8,142 |
|
|
| 7,638 |
|
Intangible assets, net |
|
| 1,062 |
|
|
| 996 |
|
Investments in non-consolidated companies |
|
| 517 |
|
|
| 517 |
|
Other investments |
|
| 27 |
|
|
| 211 |
|
Deferred tax assets |
|
| 1,432 |
|
|
| 1,713 |
|
Receivables, net |
|
| 1,013 |
|
|
| 1,073 |
|
Total non-current assets |
|
| 12,194 |
|
|
| 12,149 |
|
|
|
|
|
|
|
|
| |
Receivables, net |
|
| 940 |
|
|
| 1,173 |
|
Derivative financial instruments |
|
| 24 |
|
|
| 15 |
|
Inventories, net |
|
| 5,019 |
|
|
| 4,948 |
|
Trade receivables, net |
|
| 1,896 |
|
|
| 2,065 |
|
Other investments |
|
| 2,243 |
|
|
| 1,976 |
|
Cash and cash equivalents |
|
| 1,614 |
|
|
| 1,846 |
|
Total current assets |
|
| 11,737 |
|
|
| 12,024 |
|
|
|
|
|
|
|
|
| |
Non-current assets classified as held for sale |
|
| 8 |
|
|
| 7 |
|
|
|
|
|
|
|
|
| |
Total assets |
|
| 23,938 |
|
|
| 24,179 |
|
Statement of Financial Position (cont.)
$ MILLION |
| SEPTEMBER 30, 2024 |
|
| DECEMBER 31, 2023 |
| ||
|
|
|
|
|
| |||
Capital and reserves attributable to the owners of the parent |
|
| 11,941 |
|
|
| 12,419 |
|
Non-controlling interest |
|
| 4,385 |
|
|
| 4,393 |
|
Total equity |
|
| 16,326 |
|
|
| 16,812 |
|
|
|
|
|
|
|
|
| |
Provisions |
|
| 627 |
|
|
| 840 |
|
Deferred tax liabilities |
|
| 106 |
|
|
| 171 |
|
Other liabilities |
|
| 1,087 |
|
|
| 1,149 |
|
Trade payables |
|
| 6 |
|
|
| 12 |
|
Lease liabilities |
|
| 167 |
|
|
| 189 |
|
Borrowings |
|
| 1,597 |
|
|
| 1,206 |
|
Total non-current liabilities |
|
| 3,590 |
|
|
| 3,567 |
|
|
|
|
|
|
|
|
| |
Provision for ongoing litigation related to the acquisition of a participation in Usiminas |
|
| 814 |
|
|
| - |
|
Current income tax liabilities |
|
| 124 |
|
|
| 137 |
|
Other liabilities |
|
| 445 |
|
|
| 430 |
|
Trade payables |
|
| 1,992 |
|
|
| 2,233 |
|
Derivative financial instruments |
|
| 7 |
|
|
| 8 |
|
Lease liabilities |
|
| 50 |
|
|
| 52 |
|
Borrowings |
|
| 590 |
|
|
| 940 |
|
Total current liabilities |
|
| 4,022 |
|
|
| 3,801 |
|
|
|
|
|
|
|
|
| |
Total liabilities |
|
| 7,612 |
|
|
| 7,367 |
|
|
|
|
|
|
|
|
| |
Total equity and liabilities |
|
| 23,938 |
|
|
| 24,179 |
|
Statement of Cash Flows
$ MILLION |
| 3Q24 |
|
| 2Q24 |
|
| 3Q23 |
|
| 9M24 |
|
| 9M23 |
| |||||
|
|
|
|
|
|
|
|
|
|
|
|
|
|
|
|
|
|
|
| |
Result for the period |
|
| 93 |
|
|
| (743 | ) |
|
| (783 | ) |
|
| (159 | ) |
|
| 433 |
|
|
|
|
|
|
|
|
|
|
|
|
|
|
|
|
|
|
|
|
| |
Adjustments for: |
|
|
|
|
|
|
|
|
|
|
|
|
|
|
|
|
|
|
|
|
Depreciation and amortization |
|
| 184 |
|
|
| 199 |
|
|
| 165 |
|
|
| 554 |
|
|
| 467 |
|
Income tax accruals less payments |
|
| 204 |
|
|
| 283 |
|
|
| 158 |
|
|
| 474 |
|
|
| (116 | ) |
Equity in earnings of non-consolidated companies |
|
| (17 | ) |
|
| (15 | ) |
|
| (19 | ) |
|
| (51 | ) |
|
| (81 | ) |
Provision for ongoing litigation related to the acquisition of a participation in Usiminas |
|
| 31 |
|
|
| 783 |
|
|
| - |
|
|
| 814 |
|
|
| - |
|
Interest accruals less payments/receipts, net |
|
| 3 |
|
|
| (11 | ) |
|
| 1 |
|
|
| (10 | ) |
|
| (11 | ) |
Changes in provisions |
|
| (1 | ) |
|
| (62 | ) |
|
| (4 | ) |
|
| (70 | ) |
|
| (4 | ) |
Changes in working capital |
|
| (155 | ) |
|
| 169 |
|
|
| 388 |
|
|
| (252 | ) |
|
| 1 |
|
Net foreign exchange results and others |
|
| (38 | ) |
|
| 52 |
|
|
| 8 |
|
|
| 134 |
|
|
| (12 | ) |
Non-cash effects related to the increase of the participation in Usiminas |
|
| - |
|
|
| - |
|
|
| 1,106 |
|
|
| - |
|
|
| 1,106 |
|
Net cash provided by operating activities |
|
| 303 |
|
|
| 656 |
|
|
| 1,020 |
|
|
| 1,435 |
|
|
| 1,783 |
|
|
|
|
|
|
|
|
|
|
|
|
|
|
|
|
|
|
|
|
| |
Capital expenditures and advances to suppliers for PP&E |
|
| (446 | ) |
|
| (409 | ) |
|
| (430 | ) |
|
| (1,304 | ) |
|
| (864 | ) |
(Increase) Decrease in other investments |
|
| (164 | ) |
|
| 329 |
|
|
| (333 | ) |
|
| 166 |
|
|
| (847 | ) |
Proceeds from the sale of property, plant & equipment |
|
| 0 |
|
|
| 1 |
|
|
| 1 |
|
|
| 2 |
|
|
| 2 |
|
Dividends received from non-consolidated companies |
|
| 3 |
|
|
| 1 |
|
|
| - |
|
|
| 5 |
|
|
| 15 |
|
Acquisition of business: |
|
|
|
|
|
|
|
|
|
|
|
|
|
|
|
|
|
|
|
|
Purchase consideration |
|
| - |
|
|
| - |
|
|
| (119 | ) |
|
| - |
|
|
| (119 | ) |
Cash acquired |
|
| - |
|
|
| - |
|
|
| 781 |
|
|
| - |
|
|
| 781 |
|
Net cash used in investing activities |
|
| (606 | ) |
|
| (79 | ) |
|
| (100 | ) |
|
| (1,132 | ) |
|
| (1,031 | ) |
|
|
|
|
|
|
|
|
|
|
|
|
|
|
|
|
|
|
|
| |
Dividends paid in cash to company's shareholders |
|
| - |
|
|
| (432 | ) |
|
| - |
|
|
| (432 | ) |
|
| (353 | ) |
Dividends paid in cash to non-controlling interest |
|
| (3 | ) |
|
| (46 | ) |
|
| - |
|
|
| (49 | ) |
|
| - |
|
Finance lease payments |
|
| (13 | ) |
|
| (15 | ) |
|
| (16 | ) |
|
| (46 | ) |
|
| (43 | ) |
Proceeds from borrowings |
|
| 852 |
|
|
| 303 |
|
|
| 163 |
|
|
| 1,286 |
|
|
| 236 |
|
Repayments of borrowings |
|
| (652 | ) |
|
| (365 | ) |
|
| (145 | ) |
|
| (1,183 | ) |
|
| (372 | ) |
Net cash provided by (used in) financing activities |
|
| 183 |
|
|
| (556 | ) |
|
| 3 |
|
|
| (425 | ) |
|
| (532 | ) |
|
|
|
|
|
|
|
|
|
|
|
|
|
|
|
|
|
|
|
| |
(Decrease) Increase in cash and cash equivalents |
|
| (121 | ) |
|
| 22 |
|
|
| 923 |
|
|
| (123 | ) |
|
| 220 |
|
Exhibit I - Alternative Performance Measures
These non-IFRS measures should not be considered in isolation of, or as a substitute for, measures of performance prepared in accordance with IFRS. These non-IFRS measures do not have a standardized meaning under IFRS and, therefore, may not correspond to similar non-IFRS financial measures reported by other companies.
Adjusted EBITDA
$ MILLION |
| 3Q24 |
|
| 2Q24 |
|
| 3Q23 |
|
| 9M24 |
|
| 9M23 |
| |||||
|
|
|
|
|
|
|
|
|
|
|
|
|
|
|
|
|
|
|
| |
Net result |
|
| 93 |
|
|
| (743 | ) |
|
| (783 | ) |
|
| (159 | ) |
|
| 433 |
|
Adjusted to exclude: |
|
|
|
|
|
|
|
|
|
|
|
|
|
|
|
|
|
|
|
|
Depreciation and amortization |
|
| 184 |
|
|
| 199 |
|
|
| 165 |
|
|
| 554 |
|
|
| 467 |
|
Income tax results |
|
| 143 |
|
|
| 307 |
|
|
| 253 |
|
|
| 490 |
|
|
| 179 |
|
Net financial result |
|
| (74 | ) |
|
| 39 |
|
|
| (30 | ) |
|
| 127 |
|
|
| (20 | ) |
Equity in earnings of non-consolidated companies |
|
| (17 | ) |
|
| (15 | ) |
|
| (19 | ) |
|
| (51 | ) |
|
| (81 | ) |
Non-cash effects related to the increase in the participation in Usiminas |
|
| - |
|
|
| - |
|
|
| 1,106 |
|
|
| - |
|
|
| 1,106 |
|
Provision for ongoing litigation in the 2Q24 related to the acquisition of a participation in Usiminas |
|
| 31 |
|
|
| 783 |
|
|
|
|
|
|
| 814 |
|
|
| - |
|
Reversal of other Usiminas contingencies recognized as part of the PPA |
|
| - |
|
|
| (34 | ) |
|
|
|
|
|
| (34 | ) |
|
| - |
|
Adjusted to include: |
|
|
|
|
|
|
|
|
|
|
|
|
|
|
|
|
|
|
|
|
Proportional EBITDA in Unigal ( |
|
| 8 |
|
|
| 9 |
|
|
| 6 |
|
|
| 27 |
|
|
| 6 |
|
Adjusted EBITDA |
|
| 368 |
|
|
| 545 |
|
|
| 698 |
|
|
| 1,768 |
|
|
| 2,089 |
|
Divided by: net sales |
|
| 4,480 |
|
|
| 4,514 |
|
|
| 5,185 |
|
|
| 13,773 |
|
|
| 12,679 |
|
Adjusted EBITDA Margin (%) |
|
| 8 | % |
|
| 12 | % |
|
| 13 | % |
|
| 13 | % |
|
| 16 | % |
Exhibit I - Alternative Performance Measures (cont.)
Cash Operating Income - Steel Segment
$ MILLION |
| 3Q24 |
|
| 2Q24 |
|
| 3Q23 |
|
| 9M24 |
|
| 9M23 |
| |||||
|
|
|
|
|
|
|
|
|
|
|
|
|
|
|
|
|
|
|
| |
Operating Income - Management View (Note "Segment Information" to Ternium's Financial Statements as of the corresponding dates) |
|
| 381 |
|
|
| 278 |
|
|
| 667 |
|
|
| 1,252 |
|
|
| 1,784 |
|
Plus/Minus differences in cost of sales (IFRS) |
|
| (219 | ) |
|
| 88 |
|
|
| (162 | ) |
|
| (71 | ) |
|
| (157 | ) |
Excluding depreciation and amortization |
|
| 138 |
|
|
| 134 |
|
|
| 136 |
|
|
| 410 |
|
|
| 389 |
|
Excluding reversal of other Usiminas contingencies |
|
| - |
|
|
| (34 | ) |
|
| - |
|
|
| (34 | ) |
|
| - |
|
Including proportional EBITDA in Unigal ( |
|
| 8 |
|
|
| 9 |
|
|
| 6 |
|
|
| 27 |
|
|
| 6 |
|
Cash Operating Income |
|
| 309 |
|
|
| 476 |
|
|
| 647 |
|
|
| 1,583 |
|
|
| 2,021 |
|
Divided by steel shipments (thousand tons) |
|
| 4,123 |
|
|
| 3,841 |
|
|
| 4,131 |
|
|
| 11,858 |
|
|
| 10,179 |
|
Cash Operating Income per Ton - Steel |
|
| 75 |
|
|
| 124 |
|
|
| 157 |
|
|
| 134 |
|
|
| 199 |
|
Divided by steel net sales |
|
| 4,368 |
|
|
| 4,395 |
|
|
| 5,036 |
|
|
| 13,453 |
|
|
| 12,531 |
|
Cash Operating Income Margin - Steel (%) |
|
| 7 | % |
|
| 11 | % |
|
| 13 | % |
|
| 12 | % |
|
| 16 | % |
Cash Operating Income - Mining Segment
$ MILLION |
| 3Q24 |
|
| 2Q24 |
|
| 3Q23 |
|
| 9M24 |
|
| 9M23 |
| |||||
|
|
|
|
|
|
|
|
|
|
|
|
|
|
|
|
|
|
|
| |
Operating Income - Management View (Note "Segment Information" to Ternium's Financial Statements as of the corresponding dates) |
|
| (58 | ) |
|
| (52 | ) |
|
| (4 | ) |
|
| (131 | ) |
|
| (35 | ) |
Plus/minus differences in cost of sales (IFRS) |
|
| 64 |
|
|
| 61 |
|
|
| 17 |
|
|
| 179 |
|
|
| 11 |
|
Excluding depreciation and amortization |
|
| 46 |
|
|
| 65 |
|
|
| 29 |
|
|
| 145 |
|
|
| 78 |
|
Cash Operating Income |
|
| 52 |
|
|
| 74 |
|
|
| 42 |
|
|
| 192 |
|
|
| 54 |
|
Divided by mining shipments (thousand tons) |
|
| 3,020 |
|
|
| 2,674 |
|
|
| 3,232 |
|
|
| 8,389 |
|
|
| 4,899 |
|
Cash Operating Income per Ton - Mining |
|
| 17 |
|
|
| 28 |
|
|
| 13 |
|
|
| 23 |
|
|
| 11 |
|
Divided by mining net sales |
|
| 264 |
|
|
| 271 |
|
|
| 276 |
|
|
| 810 |
|
|
| 471 |
|
Cash Operating Income Margin - Mining (%) |
|
| 20 | % |
|
| 27 | % |
|
| 15 | % |
|
| 24 | % |
|
| 12 | % |
|
|
|
|
|
|
|
|
|
|
|
|
|
|
|
|
|
|
|
| |
Exhibit I - Alternative Performance Measures (cont.)
Adjusted Net Result
$ MILLION |
| 2Q24 |
|
| 3Q23 |
|
| 9M24 |
|
| 9M23 |
| ||||
|
|
|
|
|
|
|
|
|
|
|
|
|
|
|
| |
Net (Loss) income |
|
| (743 | ) |
|
| (783 | ) |
|
| (159 | ) |
|
| 433 |
|
Excluding non-cash effects related to the increase in the participation in Usiminas |
|
| - |
|
|
| (1,106 | ) |
|
| - |
|
|
| (1,106 | ) |
Excluding provision for ongoing litigation related to the acquisition of a participation in Usiminas |
|
| (783 | ) |
|
| - |
|
|
| (783 | ) |
|
| - |
|
Adjusted Net Income |
|
| 40 |
|
|
| 323 |
|
|
| 624 |
|
|
| 1,539 |
|
Adjusted Equity Holders' Net Result and Adjusted Earnings (Losses) per ADS
$ MILLION |
| 2Q24 |
|
| 3Q23 |
|
| 9M24 |
|
| 9M23 |
| ||||
|
|
|
|
|
|
|
|
|
|
|
|
|
|
|
| |
Equity holders' net income |
|
| (728 | ) |
|
| (739 | ) |
|
| (335 | ) |
|
| 262 |
|
Excluding non-cash effects related to the increase in the participation in Usiminas |
|
| - |
|
|
| (1,010 | ) |
|
| - |
|
|
| (1,010 | ) |
Excluding provision for ongoing litigation related to the acquisition of a participation in Usiminas |
|
| (706 | ) |
|
| - |
|
|
| (706 | ) |
|
| - |
|
Adjusted Equity Holders' Net Income |
|
| (21 | ) |
|
| 271 |
|
|
| 372 |
|
|
| 1,272 |
|
Divided by: outstanding shares of common stock, net of treasury shares (expressed in million of ADS equivalent) |
|
| 196 |
|
|
| 196 |
|
|
| 196 |
|
|
| 196 |
|
Adjusted (Losses) Earnings per ADS ($) |
|
| (0.11 | ) |
|
| 1.38 |
|
|
| 1.89 |
|
|
| 6.48 |
|
Free Cash Flow
$ MILLION |
| 3Q24 |
|
| 2Q24 |
|
| 3Q23 |
|
| 9M24 |
|
| 9M23 |
| |||||
|
|
|
|
|
|
|
|
|
|
|
|
|
|
|
|
|
|
|
| |
Net cash provided by operating activities |
|
| 303 |
|
|
| 656 |
|
|
| 1,020 |
|
|
| 1,435 |
|
|
| 1,783 |
|
Excluding capital expenditures and advances to suppliers for PP&E |
|
| (446 | ) |
|
| (409 | ) |
|
| (430 | ) |
|
| (1,304 | ) |
|
| (864 | ) |
Free cash flow |
|
| (143 | ) |
|
| 247 |
|
|
| 590 |
|
|
| 130 |
|
|
| 919 |
|
Exhibit I - Alternative Performance Measures (cont.)
Net Cash Position
$ BILLION |
| SEPTEMBER 30, |
|
| JUNE 30, |
|
| SEPTEMBER 30, |
| |||
|
|
|
|
|
|
|
|
| ||||
Cash and cash equivalents2 |
|
| 1.6 |
|
|
| 1.7 |
|
|
| 1.8 |
|
Plus: other investments (current and non-current)2 |
|
| 2.3 |
|
|
| 2.1 |
|
|
| 2.7 |
|
Less: borrowings (current and non-current) |
|
| (2.2 | ) |
|
| (2.0 | ) |
|
| (2.2 | ) |
Net cash position |
|
| 1.7 |
|
|
| 1.9 |
|
|
| 2.4 |
|
2 Ternium Argentina's consolidated position of cash and cash equivalents and other investments amounted to
Sebastián Martí
Ternium - Investor Relations
+1 (866) 890 0443
+54 (11) 4018 8389
www.ternium.com
SOURCE: Ternium S.A.
View the original press release on accesswire.com


