Trupanion Reports Second Quarter 2024 Results
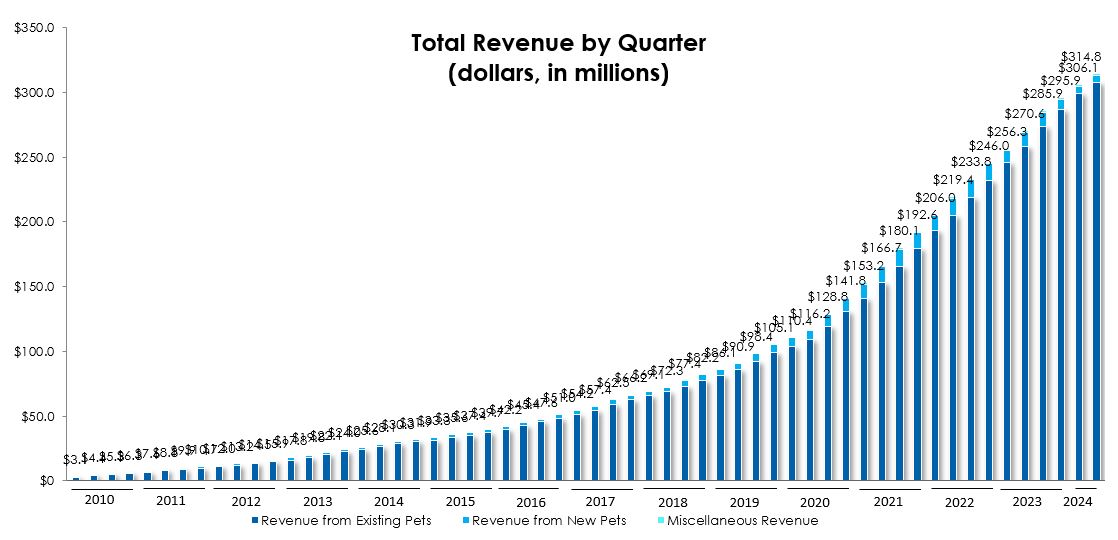
Trupanion (TRUP) reported strong Q2 2024 results, with total revenue increasing 16% to $314.8 million compared to Q2 2023. The company's subscription business revenue grew 20% to $208.6 million. Despite growth, Trupanion posted a net loss of $5.9 million, an improvement from the $13.7 million loss in Q2 2023. Notably, adjusted EBITDA turned positive at $7.4 million, compared to a $3.2 million loss last year. The company also reported positive free cash flow of $4.0 million for the quarter.
Trupanion's total enrolled pets reached 1,699,643, a 1% increase year-over-year, while subscription enrolled pets grew 8% to 1,020,934. The company maintained a strong financial position with $277.2 million in cash and short-term investments and $263.0 million in capital surplus at its insurance subsidiaries.
Trupanion (TRUP) ha riportato risultati solidi per il secondo trimestre del 2024, con un aumento del 16% delle entrate totali, raggiungendo 314,8 milioni di dollari rispetto al secondo trimestre del 2023. Le entrate del business in abbonamento sono cresciute del 20%, raggiungendo 208,6 milioni di dollari. Nonostante la crescita, Trupanion ha registrato una perdita netta di 5,9 milioni di dollari, un miglioramento rispetto alla perdita di 13,7 milioni di dollari nel secondo trimestre del 2023. È importante notare che l'EBITDA rettificato è diventato positivo, con 7,4 milioni di dollari, rispetto a una perdita di 3,2 milioni di dollari dell'anno scorso. L'azienda ha anche riportato un flusso di cassa libero positivo di 4,0 milioni di dollari per il trimestre.
Il numero totale di animali domestici iscritti a Trupanion ha raggiunto 1.699.643, con un aumento dell'1% rispetto all'anno precedente, mentre gli animali iscritti al servizio in abbonamento sono cresciuti dell'8%, raggiungendo 1.020.934. L'azienda ha mantenuto una solida posizione finanziaria con 277,2 milioni di dollari in contante e investimenti a breve termine e 263,0 milioni di dollari in capitale di riserva presso le sue filiali assicurative.
Trupanion (TRUP) informó sobre resultados sólidos para el segundo trimestre de 2024, con un aumento del 16% en los ingresos totales, alcanzando 314.8 millones de dólares en comparación con el segundo trimestre de 2023. Los ingresos del negocio de suscripción crecieron un 20% hasta 208.6 millones de dólares. A pesar del crecimiento, Trupanion reportó una pérdida neta de 5.9 millones de dólares, una mejora respecto a la pérdida de 13.7 millones de dólares en el segundo trimestre de 2023. Notablemente, el EBITDA ajustado se volvió positivo en 7.4 millones de dólares, en comparación con una pérdida de 3.2 millones de dólares el año pasado. La compañía también reportó un flujo de caja libre positivo de 4.0 millones de dólares para el trimestre.
El número total de mascotas registradas en Trupanion alcanzó 1,699,643, un aumento del 1% interanual, mientras que las mascotas suscritas crecieron un 8% hasta 1,020,934. La empresa mantuvo una posición financiera sólida con 277.2 millones de dólares en efectivo e inversiones a corto plazo y 263.0 millones de dólares en capital excedente en sus subsidiarias de seguros.
Trupanion (TRUP)은 2024년 2분기 실적을 강력하게 발표했습니다. 총 수익이 16% 증가하여 3억 1,480만 달러에 달했습니다 (2023년 2분기 대비). 회사의 구독 사업 수익은 20% 성장하여 2억 8,600만 달러에 달했습니다. 성장에도 불구하고 Trupanion은 59만 달러의 순손실을 기록했지만, 이는 2023년 2분기의 1,370만 달러 손실에서 개선된 것입니다. 특히, 조정 후 EBITDA는 740만 달러로 긍정적으로 전환되었습니다, 작년의 320만 달러 손실에 비해. 회사는 또한 분기 동안 400만 달러의 긍정적인 자유 현금 흐름을 보고했습니다.
Trupanion의 총 등록된 반려동물 수는 1,699,643마리로, 전년 대비 1% 증가했으며, 구독 등록된 반려동물 수는 8% 증가하여 1,020,934마리에 달했습니다. 회사는 2억 7,720만 달러의 현금 및 단기 투자와 2억 6,300만 달러의 보험 자회사 자본 잉여금을 보유하고 있으며 재정적으로 강력한 위치를 유지하고 있습니다.
Trupanion (TRUP) a annoncé de bons résultats pour le deuxième trimestre 2024, avec une augmentation de 16 % des revenus totaux, atteignant 314,8 millions de dollars par rapport au deuxième trimestre 2023. Les revenus de l'activité d'abonnement ont augmenté de 20 % pour atteindre 208,6 millions de dollars. Malgré cette croissance, Trupanion a enregistré une perte nette de 5,9 millions de dollars, une amélioration par rapport à la perte de 13,7 millions de dollars du deuxième trimestre 2023. Il est à noter que l'EBITDA ajusté est devenu positif à 7,4 millions de dollars, contre une perte de 3,2 millions de dollars l'année dernière. L'entreprise a également rapporté un flux de trésorerie libre positif de 4,0 millions de dollars pour le trimestre.
Le nombre total d'animaux de compagnie inscrits chez Trupanion a atteint 1 699 643, soit une augmentation de 1 % par rapport à l'année précédente, tandis que le nombre d'animaux sous abonnement a augmenté de 8 % pour atteindre 1 020 934. L'entreprise maintenait une solide position financière avec 277,2 millions de dollars en liquidités et investissements à court terme et 263,0 millions de dollars de surplus de capital dans ses filiales d'assurance.
Trupanion (TRUP) berichtete über starke Ergebnisse für das zweite Quartal 2024, mit einem Anstieg der Gesamtumsätze um 16% auf 314,8 Millionen Dollar im Vergleich zum zweiten Quartal 2023. Die Umsätze des Abonnementgeschäfts wuchsen um 20% auf 208,6 Millionen Dollar. Trotz des Wachstums verzeichnete Trupanion einen Nettoverlust von 5,9 Millionen Dollar, was eine Verbesserung im Vergleich zum Nettoverlust von 13,7 Millionen Dollar im zweiten Quartal 2023 darstellt. Bemerkenswert ist, dass das bereinigte EBITDA mit 7,4 Millionen Dollar positiv wurde, im Vergleich zu einem Verlust von 3,2 Millionen Dollar im letzten Jahr. Das Unternehmen berichtete auch über einen positiven freien Cashflow von 4,0 Millionen Dollar für das Quartal.
Die gesamt registrierte Anzahl von Haustieren bei Trupanion betrug 1.699.643, was einem Anstieg von 1% im Jahresvergleich entspricht, während die registrierten Abonnement-Haustiere um 8% auf 1.020.934 anstiegen. Das Unternehmen behielt eine starke finanzielle Position mit 277,2 Millionen Dollar in bar und kurzfristigen Investitionen und 263,0 Millionen Dollar an Kapitalüberschüssen bei seinen Versicherungstöchtern.
- Total revenue increased 16% to $314.8 million in Q2 2024
- Subscription business revenue grew 20% to $208.6 million
- Adjusted EBITDA improved to $7.4 million from a $3.2 million loss in Q2 2023
- Free cash flow turned positive at $4.0 million for Q2 2024
- Subscription enrolled pets increased 8% to 1,020,934
- Company held $277.2 million in cash and short-term investments
- Net loss of $5.9 million in Q2 2024, although improved from Q2 2023
- Total enrolled pets growth slowed to 1% year-over-year
Insights
Trupanion's Q2 2024 results show positive momentum in key financial metrics. Total revenue increased by
Notably, Trupanion generated positive adjusted EBITDA of
Trupanion's Q2 results reveal steady growth in its core business. The
The
Trupanion's Q2 performance demonstrates robust financial management in the pet insurance sector. The company's ability to maintain
The consistent growth in subscription revenue, coupled with improved cash flow and EBITDA, indicates effective risk management and pricing strategies. However, the company must navigate the challenge of balancing growth with profitability in a competitive market. The focus on deploying capital at high estimated internal rates of return suggests a disciplined approach to expansion, which is important for long-term success in the insurance industry.
SEATTLE, Aug. 08, 2024 (GLOBE NEWSWIRE) -- Trupanion, Inc. (Nasdaq: TRUP), the leading provider of medical insurance for cats and dogs, today announced financial results for the second quarter ended June 30, 2024.
“Q2 was a strong quarter, benefitting from consistent revenue growth and margin expansion,” said Margi Tooth, President and Chief Executive Officer of Trupanion. “We were able to once again deliver consistent subscription revenue growth while generating free cash flow of
Second Quarter 2024 Financial and Business Highlights
- Total revenue was
$314.8 million , an increase of16% compared to the second quarter of 2023. - Total enrolled pets (including pets from our other business segment) was 1,699,643 at June 30, 2024, an increase of
1% over June 30, 2023. - Subscription business revenue was
$208.6 million , an increase of20% compared to the second quarter of 2023. - Subscription enrolled pets was 1,020,934 at June 30, 2024, an increase of
8% over June 30, 2023. - Net loss was
$(5.9) million , or$(0.14) per basic and diluted share, compared to net loss of$(13.7) million , or$(0.33) per basic and diluted share, in the second quarter of 2023. - Adjusted EBITDA was
$7.4 million , compared to adjusted EBITDA of$(3.2) million in the second quarter of 2023. - Operating cash flow was
$6.9 million and free cash flow was$4.0 million in the second quarter of 2024. This compared to operating cash flow of$(3.4) million and free cash flow of$(8.1) million in the second quarter of 2023.
First Half 2024 Financial and Business Highlights
- Total revenue was
$620.9 million , an increase of18% compared to the first half of 2023. - Subscription business revenue was
$409.8 million , an increase of21% compared to the first half of 2023. - Net loss was
$(12.7) million , or$(0.30) per basic and diluted share, compared to net loss of$(38.5) million , or$(0.93) per basic and diluted share, in the first half of 2023. - Adjusted EBITDA was
$12.2 million , compared to adjusted EBITDA of$(8.1) million in the first half of 2023. - Operating cash flow was
$9.3 million and free cash flow was$3.3 million in the first half of 2024. This compared to operating cash flow of$(10.3) million and free cash flow of$(20.2) million in the first half of 2023. - At June 30, 2024, the Company held
$277.2 million in cash and short-term investments, including$33.2 million held outside the insurance entities, with an additional$15 million available under its credit facility. - The Company maintained
$263.0 million of capital surplus at its insurance subsidiaries. This was$130.3 million more than the estimated risk-based capital requirement of$132.7 million .
Conference Call
Trupanion’s management will host a conference call today to review its second quarter 2024 results. The call is scheduled to begin shortly after 1:30 p.m. PT/ 4:30 p.m. ET. A live webcast will be accessible through the Investor Relations section of Trupanion’s website at https://investors.trupanion.com/ and will be archived online for 3 months upon completion of the conference call. Participants can access the conference call by dialing 1-877-300-8521 (United States) or 1-412-317-6026 (International). A telephonic replay of the call will also be available after the completion of the call, by dialing 1-844-512-2921 (United States) or 1-412-317-6671 (International) and entering the replay pin number: 10189970.
About Trupanion
Trupanion is the leading provider of medical insurance for over 1,000,000 cats and dogs throughout the United States, Canada, Europe, Puerto Rico and Australia. For over two decades, Trupanion has given pet owners peace of mind so they can focus on their pet's recovery, not financial stress. With its patented process, Trupanion is the only North American provider with the technology to pay veterinarians directly in seconds at the time of checkout. Trupanion is listed on NASDAQ under the symbol "TRUP". The company was founded in 2000 and is headquartered in Seattle, WA. Trupanion policies are issued, in the United States, by its wholly-owned insurance entity American Pet Insurance Company and, in Canada, by Accelerant Insurance Company of Canada. Trupanion Australia is a partnership between Trupanion and Hollard Insurance Company. For more information, please visit trupanion.com.
Forward-Looking Statements
This press release contains forward-looking statements within the meaning of Section 27A of the Securities Act of 1933 and Section 21E of the Securities Exchange Act of 1934 relating to, among other things, expectations, plans, prospects and financial results for Trupanion, including, but not limited to, its expectations regarding its ability to continue to grow its enrollments and revenue, and otherwise execute its business plan. These forward-looking statements are based upon the current expectations and beliefs of Trupanion’s management as of the date of this press release, and are subject to certain risks and uncertainties that could cause actual results to differ materially from those described in the forward-looking statements. All forward-looking statements made in this press release are based on information available to Trupanion as of the date hereof, and Trupanion has no obligation to update these forward-looking statements.
In particular, the following factors, among others, could cause results to differ materially from those expressed or implied by such forward-looking statements: the ability to achieve or maintain profitability and/or appropriate levels of cash flow in future periods; the ability to keep growing our membership base and revenue; the accuracy of assumptions used in determining appropriate member acquisition expenditures; the severity and frequency of claims; the ability to maintain high retention rates; the accuracy of assumptions used in pricing medical plan subscriptions and the ability to accurately estimate the impact of new products or offerings on claims frequency; actual claims expense exceeding estimates; regulatory and other constraints on the ability to institute, or the decision to otherwise delay, pricing modifications in response to changes in actual or estimated claims expense; the effectiveness and statutory or regulatory compliance of our Territory Partner model and of our Territory Partners, veterinarians and other third parties in recommending medical plan subscriptions to potential members; the ability to retain existing Territory Partners and increase the number of Territory Partners and active hospitals; compliance by us and those referring us members with laws and regulations that apply to our business, including the sale of a pet medical plan; the ability to maintain the security of our data; fluctuations in the Canadian currency exchange rate; the ability to protect our proprietary and member information; the ability to maintain our culture and team; the ability to maintain the requisite amount of risk-based capital; our ability to implement and maintain effective controls, including to remediate material weaknesses in internal controls over financial reporting; the ability to protect and enforce Trupanion’s intellectual property rights; the ability to successfully implement our alliance with Aflac; the ability to continue key contractual relationships with third parties; third-party claims including litigation and regulatory actions; the ability to recognize benefits from investments in new solutions and enhancements to Trupanion’s technology platform and website; our ability to retain key personnel; and deliberations and determinations by the Trupanion board based on the future performance of the company or otherwise.
For a detailed discussion of these and other cautionary statements, please refer to the risk factors discussed in filings with the Securities and Exchange Commission (SEC), including but not limited to, Trupanion’s Annual Report on Form 10-K for the year ended December 31, 2023 and any subsequently filed reports on Forms 10-Q, 10-K and 8-K. All documents are available through the SEC’s Electronic Data Gathering Analysis and Retrieval system at https://www.sec.gov or the Investor Relations section of Trupanion’s website at https://investors.trupanion.com.
Non-GAAP Financial Measures
Trupanion’s stated results may include certain non-GAAP financial measures. These non-GAAP financial measures may not provide information that is directly comparable to that provided by other companies in its industry as other companies in its industry may calculate or use non-GAAP financial measures differently. In addition, there are limitations in using non-GAAP financial measures because the non-GAAP financial measures are not prepared in accordance with GAAP, may be different from non-GAAP financial measures used by other companies and exclude expenses that may have a material impact on Trupanion’s reported financial results. The presentation and utilization of non-GAAP financial measures is not meant to be considered in isolation or as a substitute for the directly comparable financial measures prepared in accordance with GAAP. Trupanion urges its investors to review the reconciliation of its non-GAAP financial measures to the most directly comparable GAAP financial measures in its consolidated financial statements, and not to rely on any single financial or operating measure to evaluate its business. These reconciliations are included below and on Trupanion’s Investor Relations website.
Because of varying available valuation methodologies, subjective assumptions and the variety of equity instruments that can impact a company’s non-cash expenses, Trupanion believes that providing various non-GAAP financial measures that exclude stock-based compensation expense and depreciation and amortization expense allows for more meaningful comparisons between its operating results from period to period. Trupanion offsets new pet acquisition expense with sign-up fee revenue in the calculation of net acquisition cost because it collects sign-up fee revenue from new members at the time of enrollment and considers it to be an offset to a portion of Trupanion’s new pet acquisition expense. Trupanion believes this allows it to calculate and present financial measures in a consistent manner across periods. Trupanion’s management believes that the non-GAAP financial measures and the related financial measures derived from them are important tools for financial and operational decision-making and for evaluating operating results over different periods of time.
| Trupanion, Inc. Condensed Consolidated Statements of Operations (in thousands, except share data) | |||||||||||||||
| Three Months Ended June 30, | Six Months Ended June 30, | ||||||||||||||
| 2024 | 2023 | 2024 | 2023 | ||||||||||||
| (unaudited) | |||||||||||||||
| Revenue: | |||||||||||||||
| Subscription business | $ | 208,618 | $ | 173,253 | $ | 409,752 | $ | 338,463 | |||||||
| Other business | 106,182 | 97,313 | 211,169 | 188,432 | |||||||||||
| Total revenue | 314,800 | 270,566 | 620,921 | 526,895 | |||||||||||
| Cost of revenue: | |||||||||||||||
| Subscription business(1) | 175,740 | 151,520 | 347,871 | 297,611 | |||||||||||
| Other business | 98,791 | 89,673 | 196,554 | 173,565 | |||||||||||
| Total cost of revenue(2) | 274,531 | 241,193 | 544,425 | 471,176 | |||||||||||
| Operating expenses: | |||||||||||||||
| Technology and development(1) | 8,190 | 5,232 | 15,150 | 10,132 | |||||||||||
| General and administrative(1) | 15,253 | 13,136 | 29,926 | 34,153 | |||||||||||
| New pet acquisition expense(1) | 17,874 | 20,769 | 34,717 | 42,411 | |||||||||||
| Depreciation and amortization | 4,376 | 3,253 | 8,161 | 6,455 | |||||||||||
| Total operating expenses | 45,693 | 42,390 | 87,954 | 93,151 | |||||||||||
| Loss from investment in joint venture | (47 | ) | (73 | ) | (150 | ) | (144 | ) | |||||||
| Operating loss | (5,471 | ) | (13,090 | ) | (11,608 | ) | (37,576 | ) | |||||||
| Interest expense | 3,655 | 2,940 | 7,251 | 5,327 | |||||||||||
| Other income, net | (3,220 | ) | (2,078 | ) | (6,063 | ) | (3,980 | ) | |||||||
| Loss before income taxes | (5,906 | ) | (13,952 | ) | (12,796 | ) | (38,923 | ) | |||||||
| Income tax benefit | (44 | ) | (238 | ) | (82 | ) | (429 | ) | |||||||
| Net loss | $ | (5,862 | ) | $ | (13,714 | ) | $ | (12,714 | ) | $ | (38,494 | ) | |||
| Net loss per share: | |||||||||||||||
| Basic and diluted | $ | (0.14 | ) | $ | (0.33 | ) | $ | (0.30 | ) | $ | (0.93 | ) | |||
| Weighted average shares of common stock outstanding: | |||||||||||||||
| Basic and diluted | 42,078,271 | 41,383,411 | 41,997,683 | 41,246,411 | |||||||||||
| (1)Includes stock-based compensation expense as follows: | Three Months Ended June 30, | Six Months Ended June 30, | |||||||||||||
| 2024 | 2023 | 2024 | 2023 | ||||||||||||
| Cost of revenue | $ | 1,395 | $ | 1,307 | $ | 2,785 | $ | 2,625 | |||||||
| Technology and development | 1,261 | 627 | 2,515 | 1,335 | |||||||||||
| General and administrative | 3,861 | 2,948 | 7,310 | 11,167 | |||||||||||
| New pet acquisition expense | 2,129 | 1,755 | 4,188 | 3,841 | |||||||||||
| Total stock-based compensation expense | $ | 8,646 | $ | 6,637 | $ | 16,798 | $ | 18,968 | |||||||
| (2)The breakout of cost of revenue between veterinary invoice expense and other cost of revenue is as follows: | |||||||||||||||
| Three Months Ended June 30, | Six Months Ended June 30, | ||||||||||||||
| 2024 | 2023 | 2024 | 2023 | ||||||||||||
| Veterinary invoice expense | $ | 231,102 | $ | 206,738 | $ | 464,671 | $ | 400,875 | |||||||
| Other cost of revenue | 43,429 | 34,455 | 79,754 | 70,301 | |||||||||||
| Total cost of revenue | $ | 274,531 | $ | 241,193 | $ | 544,425 | $ | 471,176 | |||||||
| Trupanion, Inc. Condensed Consolidated Balance Sheets (in thousands, except share data) | |||||||
| June 30, 2024 | December 31, 2023 | ||||||
| (unaudited) | |||||||
| Assets | |||||||
| Current assets: | |||||||
| Cash and cash equivalents | $ | 124,343 | $ | 147,501 | |||
| Short-term investments | 152,870 | 129,667 | |||||
| Accounts and other receivables, net of allowance for credit loss of | 285,944 | 267,899 | |||||
| Prepaid expenses and other assets | 15,703 | 17,022 | |||||
| Total current assets | 578,860 | 562,089 | |||||
| Restricted cash | 23,250 | 22,963 | |||||
| Long-term investments | 14,119 | 12,866 | |||||
| Property, equipment and internal-use software, net | 104,022 | 103,650 | |||||
| Intangible assets, net | 15,930 | 18,745 | |||||
| Other long-term assets | 16,737 | 18,922 | |||||
| Goodwill | 43,028 | 43,713 | |||||
| Total assets | $ | 795,946 | $ | 782,948 | |||
| Liabilities and stockholders’ equity | |||||||
| Current liabilities: | |||||||
| Accounts payable | $ | 6,630 | $ | 10,505 | |||
| Accrued liabilities and other current liabilities | 34,668 | 34,052 | |||||
| Reserve for veterinary invoices | 60,574 | 63,238 | |||||
| Deferred revenue | 252,583 | 235,329 | |||||
| Long-term debt - current portion | 1,350 | 1,350 | |||||
| Total current liabilities | 355,805 | 344,474 | |||||
| Long-term debt | 127,559 | 127,580 | |||||
| Deferred tax liabilities | 2,239 | 2,685 | |||||
| Other liabilities | 4,495 | 4,487 | |||||
| Total liabilities | 490,098 | 479,226 | |||||
| Stockholders’ equity: | |||||||
| Common stock: | — | — | |||||
| Preferred stock: | — | — | |||||
| Additional paid-in capital | 553,122 | 536,108 | |||||
| Accumulated other comprehensive loss | (1,771 | ) | 403 | ||||
| Accumulated deficit | (228,969 | ) | (216,255 | ) | |||
| Treasury stock, at cost: 1,028,186 shares at June 30, 2024 and December 31, 2023 | (16,534 | ) | (16,534 | ) | |||
| Total stockholders’ equity | 305,848 | 303,722 | |||||
| Total liabilities and stockholders’ equity | $ | 795,946 | $ | 782,948 | |||
| Trupanion, Inc. Condensed Consolidated Statements of Cash Flows (in thousands) | |||||||||||||||
| Three Months Ended June 30, | Six Months Ended June 30, | ||||||||||||||
| 2024 | 2023 | 2024 | 2023 | ||||||||||||
| (unaudited) | |||||||||||||||
| Operating activities | |||||||||||||||
| Net loss | $ | (5,862 | ) | $ | (13,714 | ) | $ | (12,714 | ) | $ | (38,494 | ) | |||
| Adjustments to reconcile net loss to cash provided by (used in) operating activities: | |||||||||||||||
| Depreciation and amortization | 4,376 | 3,253 | 8,161 | 6,455 | |||||||||||
| Stock-based compensation expense | 8,646 | 6,637 | 16,798 | 18,968 | |||||||||||
| Other, net | (116 | ) | (188 | ) | (318 | ) | (585 | ) | |||||||
| Changes in operating assets and liabilities: | |||||||||||||||
| Accounts and other receivables | (7,508 | ) | (17,337 | ) | (18,226 | ) | (33,184 | ) | |||||||
| Prepaid expenses and other assets | 2,010 | 552 | 2,297 | (3,213 | ) | ||||||||||
| Accounts payable, accrued liabilities, and other liabilities | 3,404 | (1,316 | ) | (1,727 | ) | (6,464 | ) | ||||||||
| Reserve for veterinary invoices | (1,650 | ) | 7,833 | (2,535 | ) | 12,439 | |||||||||
| Deferred revenue | 3,555 | 10,875 | 17,554 | 33,811 | |||||||||||
| Net cash provided by (used in) operating activities | 6,855 | (3,405 | ) | 9,290 | (10,267 | ) | |||||||||
| Investing activities | |||||||||||||||
| Purchases of investment securities | (62,056 | ) | (45,136 | ) | (81,249 | ) | (79,931 | ) | |||||||
| Maturities and sales of investment securities | 36,673 | 43,859 | 55,678 | 117,652 | |||||||||||
| Purchases of property, equipment, and internal-use software | (2,880 | ) | (4,735 | ) | (5,945 | ) | (9,919 | ) | |||||||
| Other | 546 | 483 | 1,062 | 583 | |||||||||||
| Net cash provided by (used in) investing activities | (27,717 | ) | (5,529 | ) | (30,454 | ) | 28,385 | ||||||||
| Financing activities | |||||||||||||||
| Proceeds from debt financing, net of financing fees | — | — | — | 35,130 | |||||||||||
| Proceeds from exercise of stock options | 99 | 513 | 471 | 653 | |||||||||||
| Shares withheld to satisfy tax withholding | (343 | ) | (171 | ) | (588 | ) | (1,024 | ) | |||||||
| Repayments of debt financing | (337 | ) | (435 | ) | (675 | ) | (1,042 | ) | |||||||
| Other | (377 | ) | — | (452 | ) | — | |||||||||
| Net cash provided by (used in) financing activities | (958 | ) | (93 | ) | (1,244 | ) | 33,717 | ||||||||
| Effect of foreign exchange rate changes on cash, cash equivalents, and restricted cash, net | (150 | ) | (184 | ) | (463 | ) | 76 | ||||||||
| Net change in cash, cash equivalents, and restricted cash | (21,969 | ) | (9,211 | ) | (22,871 | ) | 51,911 | ||||||||
| Cash, cash equivalents, and restricted cash at beginning of period | 169,562 | 145,759 | 170,464 | 84,637 | |||||||||||
| Cash, cash equivalents, and restricted cash at end of period | $ | 147,593 | $ | 136,548 | $ | 147,593 | $ | 136,548 | |||||||
| The following tables set forth our key operating metrics. | |||||||||||||||||||||||||||||||
| Six Months Ended June 30, | |||||||||||||||||||||||||||||||
| 2024 | 2023 | ||||||||||||||||||||||||||||||
| Total Business: | |||||||||||||||||||||||||||||||
| Total pets enrolled (at period end) | 1,699,643 | 1,679,659 | |||||||||||||||||||||||||||||
| Subscription Business: | |||||||||||||||||||||||||||||||
| Total subscription pets enrolled (at period end) | 1,020,934 | 943,958 | |||||||||||||||||||||||||||||
| Monthly average revenue per pet | $ | 70.76 | $ | 64.00 | |||||||||||||||||||||||||||
| Lifetime value of a pet, including fixed expenses | $ | 450 | $ | 470 | |||||||||||||||||||||||||||
| Average pet acquisition cost (PAC) | $ | 219 | $ | 241 | |||||||||||||||||||||||||||
| Average monthly retention | 98.34 | % | 98.61 | % | |||||||||||||||||||||||||||
| Three Months Ended | |||||||||||||||||||||||||||||||
| Jun. 30, 2024 | Mar. 31, 2024 | Dec. 31, 2023 | Sep. 30, 2023 | Jun. 30, 2023 | Mar. 31, 2023 | Dec. 31, 2022 | Sep. 30, 2022 | ||||||||||||||||||||||||
| Total Business: | |||||||||||||||||||||||||||||||
| Total pets enrolled (at period end) | 1,699,643 | 1,708,017 | 1,714,473 | 1,712,177 | 1,679,659 | 1,616,865 | 1,537,573 | 1,439,605 | |||||||||||||||||||||||
| Subscription Business: | |||||||||||||||||||||||||||||||
| Total subscription pets enrolled (at period end) | 1,020,934 | 1,006,168 | 991,426 | 969,322 | 943,958 | 906,369 | 869,862 | 808,077 | |||||||||||||||||||||||
| Monthly average revenue per pet | $ | 71.72 | $ | 69.79 | $ | 67.07 | $ | 65.82 | $ | 64.41 | $ | 63.58 | $ | 63.11 | $ | 63.80 | |||||||||||||||
| Lifetime value of a pet, including fixed expenses | $ | 450 | $ | 428 | $ | 419 | $ | 428 | $ | 470 | $ | 541 | $ | 641 | $ | 673 | |||||||||||||||
| Average pet acquisition cost (PAC) | $ | 231 | $ | 207 | $ | 217 | $ | 212 | $ | 236 | $ | 247 | $ | 283 | $ | 268 | |||||||||||||||
| Average monthly retention | 98.34 | % | 98.41 | % | 98.49 | % | 98.55 | % | 98.61 | % | 98.65 | % | 98.69 | % | 98.71 | % | |||||||||||||||
| The following table reflects the reconciliation of cash provided by operating activities to free cash flow (in thousands): | |||||||||||||||
| Three Months Ended June 30, | Six Months Ended June 30, | ||||||||||||||
| 2024 | 2023 | 2024 | 2023 | ||||||||||||
| Net cash provided by (used in) operating activities | $ | 6,855 | $ | (3,405 | ) | $ | 9,290 | $ | (10,267 | ) | |||||
| Purchases of property, equipment, and internal-use software | (2,880 | ) | (4,735 | ) | (5,945 | ) | (9,919 | ) | |||||||
| Free cash flow | $ | 3,975 | $ | (8,140 | ) | $ | 3,345 | $ | (20,186 | ) | |||||
| The following tables reflect the reconciliation between GAAP and non-GAAP measures (in thousands except percentages): | ||||||||||||||||
| Three months ended June 30, | Six Months Ended June 30, | |||||||||||||||
| 2024 | 2023 | 2024 | 2023 | |||||||||||||
| Veterinary invoice expense | $ | 231,102 | $ | 206,738 | $ | 464,671 | $ | 400,875 | ||||||||
| Less: | ||||||||||||||||
| Stock-based compensation expense(1) | (843 | ) | (856 | ) | (1,705 | ) | (1,695 | ) | ||||||||
| Other business cost of paying veterinary invoices(4) | (75,622 | ) | (72,443 | ) | (156,836 | ) | (137,592 | ) | ||||||||
| Subscription cost of paying veterinary invoices (non-GAAP) | $ | 154,637 | $ | 133,439 | $ | 306,130 | $ | 261,588 | ||||||||
| % of subscription revenue | 74.1 | % | 77.0 | % | 74.7 | % | 77.3 | % | ||||||||
| Other cost of revenue | $ | 43,429 | $ | 34,455 | $ | 79,754 | $ | 70,301 | ||||||||
| Less: | ||||||||||||||||
| Stock-based compensation expense(1) | (523 | ) | (428 | ) | (943 | ) | (876 | ) | ||||||||
| Other business variable expenses(4) | (23,091 | ) | (17,230 | ) | (39,589 | ) | (35,973 | ) | ||||||||
| Subscription variable expenses (non-GAAP) | $ | 19,815 | $ | 16,797 | $ | 39,222 | $ | 33,452 | ||||||||
| % of subscription revenue | 9.5 | % | 9.7 | % | 9.6 | % | 9.9 | % | ||||||||
| Technology and development expense | $ | 8,190 | $ | 5,232 | $ | 15,150 | $ | 10,132 | ||||||||
| General and administrative expense | 15,253 | 13,136 | 29,926 | 34,153 | ||||||||||||
| Less: | ||||||||||||||||
| Stock-based compensation expense(1) | (4,949 | ) | (3,497 | ) | (9,208 | ) | (12,318 | ) | ||||||||
| Non-recurring transaction or restructuring expenses(2) | — | (65 | ) | — | (4,167 | ) | ||||||||||
| Development expenses(3) | (1,655 | ) | (925 | ) | (2,832 | ) | (1,823 | ) | ||||||||
| Fixed expenses (non-GAAP) | $ | 16,839 | $ | 13,881 | $ | 33,036 | $ | 25,977 | ||||||||
| % of total revenue | 5.3 | % | 5.1 | % | 5.3 | % | 4.9 | % | ||||||||
| New pet acquisition expense | $ | 17,874 | $ | 20,769 | $ | 34,717 | $ | 42,411 | ||||||||
| Less: | ||||||||||||||||
| Stock-based compensation expense(1) | (2,066 | ) | (1,722 | ) | (3,923 | ) | (3,754 | ) | ||||||||
| Other business pet acquisition expense(4) | (10 | ) | (62 | ) | (23 | ) | (113 | ) | ||||||||
| Subscription acquisition cost (non-GAAP) | $ | 15,798 | $ | 18,985 | $ | 30,771 | $ | 38,544 | ||||||||
| % of subscription revenue | 7.6 | % | 11.0 | % | 7.5 | % | 11.4 | % | ||||||||
| (1) Trupanion employees may elect to take restricted stock units in lieu of cash payment for their bonuses. We account for such expense as stock-based compensation according to GAAP, but we do not include it in any non-GAAP adjustments. Stock-based compensation associated with bonuses was approximately (2) Consists of business acquisition transaction expenses, severance and legal costs due to certain executive departures, and a (3) Consists of costs related to product exploration and development that are pre-revenue and historically have been insignificant. (4) Excludes the portion of stock-based compensation expense attributable to the other business segment | ||||||||||||||||
| The following tables reflect the reconciliation of GAAP measures to non-GAAP measures (in thousands, except percentages): | |||||||||||||||
| Three Months Ended June 30, | Six Months Ended June 30, | ||||||||||||||
| 2024 | 2023 | 2024 | 2023 | ||||||||||||
| Subscription revenue | $ | 208,618 | $ | 173,253 | $ | 409,752 | $ | 338,463 | |||||||
| Subscription cost of paying veterinary invoices | 154,637 | 133,439 | 306,130 | 261,588 | |||||||||||
| Subscription variable expenses | 19,815 | 16,797 | 39,222 | 33,452 | |||||||||||
| Subscription fixed expenses* | 11,160 | 8,890 | 21,800 | 16,685 | |||||||||||
| Subscription adjusted operating income (non-GAAP) | $ | 23,006 | $ | 14,127 | $ | 42,600 | $ | 26,738 | |||||||
| Other business revenue | $ | 106,182 | 97,313 | $ | 211,169 | $ | 188,432 | ||||||||
| Other business cost of paying veterinary invoices | 75,622 | 72,443 | 156,836 | 137,592 | |||||||||||
| Other business variable expenses | 23,090 | 17,229 | 39,588 | 35,973 | |||||||||||
| Other business fixed expenses* | 5,679 | 4,991 | 11,236 | 9,292 | |||||||||||
| Other business adjusted operating income (non-GAAP) | $ | 1,791 | $ | 2,650 | $ | 3,509 | $ | 5,575 | |||||||
| Revenue | $ | 314,800 | $ | 270,566 | $ | 620,921 | $ | 526,895 | |||||||
| Cost of paying veterinary invoices | 230,259 | 205,882 | 462,966 | 399,180 | |||||||||||
| Variable expenses | 42,905 | 34,026 | 78,810 | 69,425 | |||||||||||
| Fixed expenses* | 16,839 | 13,881 | 33,036 | 25,977 | |||||||||||
| Total business adjusted operating income (non-GAAP) | $ | 24,797 | $ | 16,777 | $ | 46,109 | $ | 32,313 | |||||||
| As a percentage of revenue: | Three Months Ended June 30, | Six Months Ended June 30, | |||||||||||||
| 2024 | 2023 | 2024 | 2023 | ||||||||||||
| Subscription revenue | 100.0 | % | 100.0 | % | 100.0 | % | 100.0 | % | |||||||
| Subscription cost of paying veterinary invoices | 74.1 | % | 77.0 | % | 74.7 | % | 77.3 | % | |||||||
| Subscription variable expenses | 9.5 | % | 9.7 | % | 9.6 | % | 9.9 | % | |||||||
| Subscription fixed expenses* | 5.3 | % | 5.1 | % | 5.3 | % | 4.9 | % | |||||||
| Subscription adjusted operating income (non-GAAP) | 11.0 | % | 8.2 | % | 10.4 | % | 7.9 | % | |||||||
| Other business revenue | 100.0 | % | 100.0 | % | 100.0 | % | 100.0 | % | |||||||
| Other business cost of paying veterinary invoices | 71.2 | % | 74.4 | % | 74.3 | % | 73.0 | % | |||||||
| Other business variable expenses | 21.7 | % | 17.7 | % | 18.7 | % | 19.1 | % | |||||||
| Other business fixed expenses* | 5.3 | % | 5.1 | % | 5.3 | % | 4.9 | % | |||||||
| Other business adjusted operating income (non-GAAP) | 1.7 | % | 2.7 | % | 1.7 | % | 3.0 | % | |||||||
| Revenue | 100.0 | % | 100.0 | % | 100.0 | % | 100.0 | % | |||||||
| Cost of paying veterinary invoices | 73.1 | % | 76.1 | % | 74.6 | % | 75.8 | % | |||||||
| Variable expenses | 13.6 | % | 12.6 | % | 12.7 | % | 13.2 | % | |||||||
| Fixed expenses* | 5.3 | % | 5.1 | % | 5.3 | % | 4.9 | % | |||||||
| Total business adjusted operating income (non-GAAP) | 7.9 | % | 6.2 | % | 7.4 | % | 6.1 | % | |||||||
| *Fixed expenses represent shared services that support both our subscription and other business segments and, as such, are generally allocated to each segment pro-rata based on revenues. | |||||||||||||||
| The following tables reflect the reconciliation of GAAP measures to non-GAAP measures (in thousands, except percentages): | |||||||||||||||
| Three Months Ended June 30, | Six Months Ended June 30, | ||||||||||||||
| 2024 | 2023 | 2024 | 2023 | ||||||||||||
| Operating Loss | $ | (5,471 | ) | $ | (13,090 | ) | $ | (11,608 | ) | $ | (37,576 | ) | |||
| Non-GAAP expense adjustments | |||||||||||||||
| Acquisition cost | 15,808 | 19,047 | 30,793 | 38,657 | |||||||||||
| Stock-based compensation expense(1) | 8,381 | 6,504 | 15,780 | 18,643 | |||||||||||
| Development expenses(3) | 1,656 | 925 | 2,833 | 1,823 | |||||||||||
| Depreciation and amortization | 4,376 | 3,253 | 8,161 | 6,455 | |||||||||||
| Non-recurring transaction or restructuring expenses(2) | — | 65 | — | 4,167 | |||||||||||
| Gain (loss) from investment in joint venture | (47 | ) | (73 | ) | (150 | ) | (144 | ) | |||||||
| Total adjusted operating income (non-GAAP) | $ | 24,797 | $ | 16,777 | $ | 46,109 | $ | 32,313 | |||||||
| Subscription Business: | |||||||||||||||
| Subscription operating loss | $ | (3,420 | ) | $ | (12,818 | ) | $ | (7,939 | ) | $ | (31,585 | ) | |||
| Non-GAAP expense adjustments | |||||||||||||||
| Acquisition cost | 15,798 | 18,985 | 30,771 | 38,544 | |||||||||||
| Stock-based compensation expense(1) | 6,631 | 5,246 | 12,512 | 14,237 | |||||||||||
| Development expenses(3) | 1,097 | 590 | 1,871 | 1,171 | |||||||||||
| Depreciation and amortization | 2,900 | 2,083 | 5,385 | 4,147 | |||||||||||
| Non-recurring transaction or restructuring expenses(2) | — | 41 | — | 224 | |||||||||||
| Subscription adjusted operating income (non-GAAP) | $ | 23,006 | $ | 14,127 | $ | 42,600 | $ | 26,738 | |||||||
| Other Business: | |||||||||||||||
| Other business operating loss | $ | (2,004 | ) | $ | (199 | ) | $ | (3,519 | ) | $ | (5,847 | ) | |||
| Non-GAAP expense adjustments | |||||||||||||||
| Acquisition cost | 10 | 62 | 22 | 113 | |||||||||||
| Stock-based compensation expense(1) | 1,750 | 1,258 | 3,268 | 4,406 | |||||||||||
| Development expenses(3) | 559 | 335 | 962 | 652 | |||||||||||
| Depreciation and amortization | 1,476 | 1,170 | 2,776 | 2,308 | |||||||||||
| Non-recurring transaction or restructuring expenses(2) | — | 24 | — | 3,943 | |||||||||||
| Other business adjusted operating income (non-GAAP) | $ | 1,790 | $ | 2,647 | $ | 3,510 | $ | 5,575 | |||||||
| (1) Trupanion employees may elect to take restricted stock units in lieu of cash payment for their bonuses. We account for such expense as stock-based compensation in accordance with GAAP, but we do not include it in any non-GAAP adjustments. Stock-based compensation associated with bonuses was approximately | |||||||||||||||
| (2) Consists of business acquisition transaction expenses, severance and legal costs due to certain executive departures, and a | |||||||||||||||
| (3) As we enter the next phase of our growth, we expect to invest in initiatives that are pre-revenue, including adding new products and international expansion. These development expenses are costs related to product exploration and development that are pre-revenue and historically have been insignificant. We view these activities as uses of our adjusted operating income separate from pet acquisition spend. | |||||||||||||||
Adjusted operating income is a non-GAAP financial measure that adjusts operating income (loss) to remove the effect of acquisition cost, development expenses, non-recurring transaction or restructuring expenses, and gain (loss) from investment in joint venture. Non-cash items, such as stock-based compensation expense and depreciation and amortization, are also excluded. Acquisition cost, development expenses, gain (loss) from investment in joint venture, stock-based compensation expense, and depreciation and amortization are expected to remain recurring expenses for the foreseeable future, but are excluded from this metric to measure scale in other areas of the business. Management believes acquisition costs primarily represent the cost to acquire new subscribers and are driven by the amount of growth we choose to pursue based primarily on the amount of our adjusted operating income period over period. Accordingly, this measure is not indicative of our core operating income performance. We also exclude development expenses, gain (loss) from investment in joint venture, stock-based compensation expense, and depreciation and amortization because some investors may not view those items as reflective of our core operating income performance.
Management uses adjusted operating income and the margin on adjusted operating income to understand the effects of scale in its non-acquisition cost and development expenses and to plan future advertising expenditures, which are designed to acquire new pets. Management uses this measure as a principal way of understanding the operating performance of its business exclusive of acquisition cost and new product exploration and development initiatives. Management believes disclosure of this metric provides investors with the same data that the Company employs in assessing its overall operations and that disclosure of this measure may provide useful information regarding the efficiency of our utilization of revenues, return on advertising dollars in the form of new subscribers and future use of available cash to support the continued growth of our business.
| The following tables reflect the reconciliation of adjusted EBITDA to net loss (in thousands): | |||||||||||||||||||||||||||||||
| Six Months Ended June 30, | |||||||||||||||||||||||||||||||
| 2024 | 2023 | ||||||||||||||||||||||||||||||
| Net loss | $ | (12,714 | ) | $ | (38,494 | ) | |||||||||||||||||||||||||
| Excluding: | |||||||||||||||||||||||||||||||
| Stock-based compensation expense | 15,779 | 18,643 | |||||||||||||||||||||||||||||
| Depreciation and amortization expense | 8,161 | 6,455 | |||||||||||||||||||||||||||||
| Interest income | (6,180 | ) | (3,780 | ) | |||||||||||||||||||||||||||
| Interest expense | 7,251 | 5,327 | |||||||||||||||||||||||||||||
| Income tax benefit | (82 | ) | (429 | ) | |||||||||||||||||||||||||||
| Non-recurring transaction or restructuring expenses | — | 4,167 | |||||||||||||||||||||||||||||
| Adjusted EBITDA | $ | 12,215 | $ | (8,111 | ) | ||||||||||||||||||||||||||
| Three Months Ended | |||||||||||||||||||||||||||||||
| Jun. 30, 2024 | Mar. 31, 2024 | Dec. 31, 2023 | Sep. 30, 2023 | Jun. 30, 2023 | Mar. 31, 2023 | Dec. 31, 2022 | Sep. 30, 2022 | ||||||||||||||||||||||||
| Net loss | $ | (5,862 | ) | $ | (6,852 | ) | $ | (2.163 | ) | $ | (4,036 | ) | $ | (13,714 | ) | $ | (24,780 | ) | $ | (9,285 | ) | $ | (12,914 | ) | |||||||
| Excluding: | |||||||||||||||||||||||||||||||
| Stock-based compensation expense | 8,381 | 7,398 | 6.636 | 6,585 | 6,503 | 12,140 | 8,412 | 8,306 | |||||||||||||||||||||||
| Depreciation and amortization expense | 4,376 | 3,785 | 3.029 | 2,990 | 3,253 | 3,202 | 2,897 | 2,600 | |||||||||||||||||||||||
| Interest income | (3,135 | ) | (3,045 | ) | (2.842 | ) | (2,389 | ) | (2,051 | ) | (1,729 | ) | (1,614 | ) | (1,018 | ) | |||||||||||||||
| Interest expense | 3,655 | 3,596 | 3.697 | 3,053 | 2,940 | 2,387 | 1,587 | 1,408 | |||||||||||||||||||||||
| Income tax expense (benefit) | (44 | ) | (38 | ) | 130 | (43 | ) | (238 | ) | (191 | ) | (15 | ) | 496 | |||||||||||||||||
| Non-recurring transaction or restructuring expenses | — | — | — | 8 | 65 | 4,102 | 193 | 179 | |||||||||||||||||||||||
| (Gain) loss from equity method investment | — | — | — | (110 | ) | — | — | — | — | ||||||||||||||||||||||
| Adjusted EBITDA | $ | 7,371 | $ | 4,844 | $ | 8.487 | $ | 6,058 | $ | (3,242 | ) | $ | (4,869 | ) | $ | 2,175 | $ | (943 | ) | ||||||||||||
Contacts:
Investors:
Laura Bainbridge, Senior Vice President, Corporate Communications
Gil Melchior, Director, Investor Relations
Investor.Relations@trupanion.com
A photo accompanying this announcement is available at https://www.globenewswire.com/NewsRoom/AttachmentNg/0c2f42a0-da73-4962-8628-05edda336748
