Trupanion Reports Fourth Quarter & Full Year 2024 Results
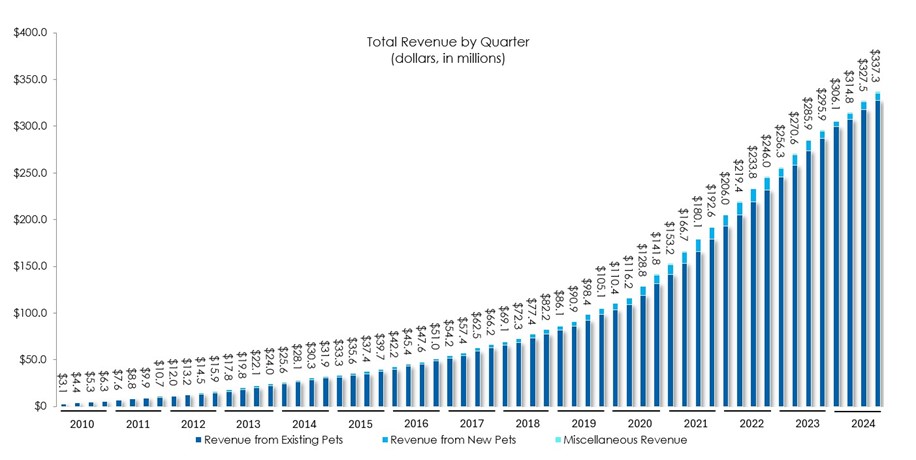
Trupanion (TRUP) reported strong Q4 and full-year 2024 results, marking significant improvements in financial performance. Q4 total revenue reached $337.3 million, up 14% year-over-year, with subscription business revenue increasing 19% to $227.8 million. The company achieved a net income of $1.7 million in Q4, compared to a loss in the same period of 2023.
For the full year 2024, total revenue grew 16% to $1,286 million, with subscription revenue up 20% to $856.5 million. The company significantly improved its financial position, reducing net loss to $(9.6) million from $(44.7) million in 2023. Free cash flow reached a record $38.6 million for the year, compared to $0.4 million in 2023. Total enrolled pets slightly decreased by 2% to 1,677,570, while subscription enrolled pets increased by 5% to 1,041,212.
Trupanion (TRUP) ha riportato risultati solidi per il Q4 e l'intero anno 2024, segnando significativi miglioramenti nelle performance finanziarie. Nel Q4, il fatturato totale ha raggiunto $337,3 milioni, con un aumento del 14% rispetto all'anno precedente, mentre il fatturato del business in abbonamento è aumentato del 19% a $227,8 milioni. L'azienda ha registrato un utile netto di $1,7 milioni nel Q4, rispetto a una perdita nello stesso periodo del 2023.
Per l'intero anno 2024, il fatturato totale è cresciuto del 16% a $1.286 milioni, con un aumento del 20% nel fatturato degli abbonamenti, che ha raggiunto $856,5 milioni. L'azienda ha notevolmente migliorato la sua posizione finanziaria, riducendo la perdita netta a $(9,6) milioni rispetto a $(44,7) milioni nel 2023. Il flusso di cassa libero ha raggiunto un record di $38,6 milioni per l'anno, rispetto a $0,4 milioni nel 2023. Il numero totale di animali iscritti è leggermente diminuito del 2% a 1.677.570, mentre gli animali iscritti in abbonamento sono aumentati del 5% a 1.041.212.
Trupanion (TRUP) reportó resultados sólidos para el Q4 y el año completo 2024, marcando mejoras significativas en el rendimiento financiero. En el Q4, los ingresos totales alcanzaron $337.3 millones, un aumento del 14% en comparación con el año anterior, y los ingresos del negocio de suscripción aumentaron un 19% a $227.8 millones. La compañía logró un ingreso neto de $1.7 millones en el Q4, en comparación con una pérdida en el mismo período de 2023.
Para el año completo 2024, los ingresos totales crecieron un 16% a $1,286 millones, con ingresos por suscripción aumentando un 20% a $856.5 millones. La compañía mejoró significativamente su posición financiera, reduciendo la pérdida neta a $(9.6) millones desde $(44.7) millones en 2023. El flujo de caja libre alcanzó un récord de $38.6 millones para el año, en comparación con $0.4 millones en 2023. El número total de mascotas inscritas disminuyó ligeramente un 2% a 1,677,570, mientras que las mascotas inscritas en suscripción aumentaron un 5% a 1,041,212.
Trupanion (TRUP)은 2024년 4분기 및 전체 연도에 대한 강력한 실적을 보고하며 재무 성과에서 중요한 개선을 나타냈습니다. 4분기 총 매출은 $337.3 백만으로 전년 대비 14% 증가했으며, 구독 사업 수익은 19% 증가하여 $227.8 백만에 달했습니다. 회사는 4분기에 $1.7 백만의 순이익을 달성했으며, 이는 2023년 같은 기간의 손실에 비해 개선된 수치입니다.
2024년 전체 연도 동안 총 매출은 16% 증가하여 $1,286 백만에 달했으며, 구독 수익은 20% 증가하여 $856.5 백만에 이르렀습니다. 회사는 재무 상태를 크게 개선하여 순손실을 $(9.6) 백만으로 줄였으며, 이는 2023년의 $(44.7) 백만에서 감소한 수치입니다. 자유 현금 흐름은 연간 $38.6 백만의 기록을 세웠으며, 2023년의 $0.4 백만과 비교됩니다. 총 등록된 애완동물 수는 2% 감소하여 1,677,570마리로 줄어들었으며, 구독 등록 애완동물 수는 5% 증가하여 1,041,212마리에 달했습니다.
Trupanion (TRUP) a annoncé des résultats solides pour le T4 et l'année complète 2024, marquant des améliorations significatives de la performance financière. Pour le T4, le chiffre d'affaires total a atteint $337,3 millions, en hausse de 14% par rapport à l'année précédente, tandis que les revenus de l'activité d'abonnement ont augmenté de 19% pour atteindre $227,8 millions. L'entreprise a réalisé un bénéfice net de $1,7 million au T4, contre une perte au cours de la même période en 2023.
Pour l'année complète 2024, le chiffre d'affaires total a augmenté de 16% pour atteindre $1,286 millions, avec des revenus d'abonnement en hausse de 20% à $856,5 millions. L'entreprise a considérablement amélioré sa position financière, réduisant la perte nette à $(9,6) millions contre $(44,7) millions en 2023. Le flux de trésorerie libre a atteint un record de $38,6 millions pour l'année, contre $0,4 millions en 2023. Le nombre total d'animaux inscrits a légèrement diminué de 2% pour atteindre 1.677.570, tandis que le nombre d'animaux inscrits par abonnement a augmenté de 5% pour atteindre 1.041.212.
Trupanion (TRUP) berichtete über starke Ergebnisse im Q4 und für das gesamte Jahr 2024, was bedeutende Verbesserungen in der finanziellen Leistung zeigt. Der Gesamtumsatz im Q4 erreichte $337,3 Millionen, was einem Anstieg von 14% im Vergleich zum Vorjahr entspricht, während die Einnahmen aus dem Abonnementgeschäft um 19% auf $227,8 Millionen stiegen. Das Unternehmen erzielte im Q4 einen Nettogewinn von $1,7 Millionen, verglichen mit einem Verlust im gleichen Zeitraum 2023.
Für das gesamte Jahr 2024 wuchs der Gesamtumsatz um 16% auf $1.286 Millionen, während die Abonnementumsätze um 20% auf $856,5 Millionen zunahmen. Das Unternehmen verbesserte seine finanzielle Position erheblich und reduzierte den Nettoverlust auf $(9,6) Millionen von $(44,7) Millionen im Jahr 2023. Der freie Cashflow erreichte einen Rekord von $38,6 Millionen für das Jahr, verglichen mit $0,4 Millionen im Jahr 2023. Die Gesamtzahl der angemeldeten Haustiere sank leicht um 2% auf 1.677.570, während die Anzahl der im Abonnement angemeldeten Haustiere um 5% auf 1.041.212 stieg.
- Q4 net income of $1.7 million vs $(2.2) million loss in Q4 2023
- Subscription revenue growth of 20% year-over-year
- Record free cash flow of $38.6 million in 2024 vs $0.4 million in 2023
- Significant reduction in annual net loss from $(44.7) million to $(9.6) million
- Strong capital position with $307.4 million in cash and investments
- 2% decrease in total enrolled pets year-over-year
- Company still operating at a net loss for full year 2024
Insights
Trupanion's Q4 2024 results mark a pivotal transition toward sustainable profitability, highlighted by their first quarterly profit of
The financial health indicators are particularly strong for an insurance provider:
However, the
The substantial improvement in adjusted EBITDA to
SEATTLE, Feb. 19, 2025 (GLOBE NEWSWIRE) -- Trupanion, Inc. (Nasdaq: TRUP), a leading provider of medical insurance for cats and dogs, today announced financial results for the fourth quarter and full year ended December 31, 2024.
“2024 was a milestone year for Trupanion. Strong execution drove
Fourth Quarter 2024 Financial and Business Highlights
- Total revenue was
$337.3 million , an increase of14% compared to the fourth quarter of 2023. - Total enrolled pets (including pets from our other business segment) was 1,677,570 at December 31, 2024, a decrease of
2% over December 31, 2023. - Subscription business revenue was
$227.8 million , an increase of19% compared to the fourth quarter of 2023. - Subscription enrolled pets was 1,041,212 at December 31, 2024, an increase of
5% over December 31, 2023. - Net income was
$1.7 million , or$0.04 per basic and diluted share, compared to a net loss of$(2.2) million , or$(0.05) per basic and diluted share, in the fourth quarter of 2023. - Adjusted EBITDA was
$19.4 million , compared to adjusted EBITDA of$8.5 million in the fourth quarter of 2023. - Operating cash flow was
$23.7 million and free cash flow was$21.8 million in the fourth quarter of 2024. This compared to operating cash flow of$17.5 million and free cash flow of$13.5 million in the fourth quarter of 2023.
Full Year 2024 Financial and Business Highlights
- Total revenue was
$1,286 million , an increase of16% compared to 2023. - Subscription business revenue was
$856.5 million , an increase of20% compared to 2023. - Net loss was
$(9.6) million , or$(0.23) per basic and diluted share, compared to a net loss of$(44.7) million , or$(1.08) per basic and diluted share, in 2023. - Adjusted EBITDA was
$46.1 million , compared to adjusted EBITDA of$6.4 million in 2023. - Operating cash flow was
$48.3 million and free cash flow was$38.6 million in 2024. This compared to operating cash flow of$18.6 million and free cash flow of$0.4 million in 2023. - At December 31, 2024, the Company held
$307.4 million in cash and short-term investments, including$35.4 million held outside the insurance entities, with an additional$15 million available under its credit facility. - The Company maintained
$288.0 million of capital surplus at its insurance subsidiaries. The largest insurance subsidiary, APIC, maintained$245.5 million of capital surplus, which was$140.2 million more than the company action level risk-based capital requirement.
Conference Call
Trupanion’s management will host a conference call today to review its fourth quarter and full year 2024 results. The call is scheduled to begin shortly after 1:30 p.m. PT/ 4:30 p.m. ET. A live webcast will be accessible through the Investor Relations section of Trupanion’s website at https://investors.trupanion.com/ and will be archived online for 3 months upon completion of the conference call. Participants can access the conference call by dialing 1-877-300-8521 (United States) or 1-412-317-6026 (International). A telephonic replay of the call will also be available after the completion of the call, by dialing 1-844-512-2921 (United States) or 1-412-317-6671 (International) and entering the replay pin number: 10194900.
About Trupanion
Trupanion is a leader in medical insurance for cats and dogs throughout the United States, Canada, certain countries in Continental Europe, and Australia with over 1,000,000 pets currently enrolled. For over two decades, Trupanion has given pet owners peace of mind so they can focus on their pet's recovery, not financial stress. Trupanion is committed to providing pet parents with the highest value in pet medical insurance with unlimited payouts for the life of their pets. With its patented process, Trupanion is the only North American provider with the technology to pay veterinarians directly in seconds at the time of checkout. Trupanion is listed on NASDAQ under the symbol "TRUP". The company was founded in 2000 and is headquartered in Seattle, WA. Trupanion policies are issued, in the United States, by its wholly-owned insurance entity American Pet Insurance Company and, in Canada, by Accelerant Insurance Company of Canada. Trupanion Australia is a partnership between Trupanion and Hollard Insurance Company. Policies are sold and administered in Canada by Canada Pet Health Insurance Services, Inc. dba Trupanion 309-1277 Lynn Valley Road, North Vancouver, BC V7J 0A2 and in the United States by Trupanion Managers USA, Inc. (CA license No. 0G22803, NPN 9588590). Canada Pet Health Insurance Services, Inc. is a registered damage insurance agency and claims adjuster in Quebec #603927. Trupanion Australia is a partnership between Trupanion and Hollard Insurance Company. For more information, please visit trupanion.com.
Forward-Looking Statements
This press release contains forward-looking statements within the meaning of Section 27A of the Securities Act of 1933 and Section 21E of the Securities Exchange Act of 1934 relating to, among other things, expectations, plans, prospects and financial results for Trupanion, including, but not limited to, its expectations regarding its ability to continue to grow its enrollments and revenue, and otherwise execute its business plan. These forward-looking statements are based upon the current expectations and beliefs of Trupanion’s management as of the date of this press release, and are subject to certain risks and uncertainties that could cause actual results to differ materially from those described in the forward-looking statements. All forward-looking statements made in this press release are based on information available to Trupanion as of the date hereof, and Trupanion has no obligation to update these forward-looking statements.
In particular, the following factors, among others, could cause results to differ materially from those expressed or implied by such forward-looking statements: the ability to achieve or maintain profitability and/or appropriate levels of cash flow in future periods; the ability to keep growing our membership base and revenue; the accuracy of assumptions used in determining appropriate member acquisition expenditures; the severity and frequency of claims; the ability to maintain high retention rates; the accuracy of assumptions used in pricing medical plan subscriptions and the ability to accurately estimate the impact of new products or offerings on claims frequency; actual claims expense exceeding estimates; regulatory and other constraints on the ability to institute, or the decision to otherwise delay, pricing modifications in response to changes in actual or estimated claims expense; the effectiveness and statutory or regulatory compliance of our Territory Partner model and of our Territory Partners, veterinarians and other third parties in recommending medical plan subscriptions to potential members; the ability to retain existing Territory Partners and increase the number of Territory Partners and active hospitals; compliance by us and those referring us members with laws and regulations that apply to our business, including the sale of a pet medical plan; the ability to maintain the security of our data; fluctuations in the Canadian currency exchange rate; the ability to protect our proprietary and member information; the ability to maintain our culture and team; the ability to maintain the requisite amount of risk-based capital; our ability to implement and maintain effective controls, including to remediate material weaknesses in internal controls over financial reporting; the ability to protect and enforce Trupanion’s intellectual property rights; the ability to successfully implement our alliance with Aflac; the ability to continue key contractual relationships with third parties; third-party claims including litigation and regulatory actions; the ability to recognize benefits from investments in new solutions and enhancements to Trupanion’s technology platform and website; our ability to retain key personnel; and deliberations and determinations by the Trupanion board based on the future performance of the company or otherwise.
For a detailed discussion of these and other cautionary statements, please refer to the risk factors discussed in filings with the Securities and Exchange Commission (SEC), including but not limited to, Trupanion’s Annual Report on Form 10-K for the year ended December 31, 2024 and any subsequently filed reports on Forms 10-Q, 10-K and 8-K. All documents are available through the SEC’s Electronic Data Gathering Analysis and Retrieval system at https://www.sec.gov or the Investor Relations section of Trupanion’s website at https://investors.trupanion.com.
Non-GAAP Financial Measures
Trupanion’s stated results may include certain non-GAAP financial measures. These non-GAAP financial measures may not provide information that is directly comparable to that provided by other companies in its industry as other companies in its industry may calculate or use non-GAAP financial measures differently. In addition, there are limitations in using non-GAAP financial measures because the non-GAAP financial measures are not prepared in accordance with GAAP, may be different from non-GAAP financial measures used by other companies and exclude expenses that may have a material impact on Trupanion’s reported financial results. The presentation and utilization of non-GAAP financial measures is not meant to be considered in isolation or as a substitute for the directly comparable financial measures prepared in accordance with GAAP. Trupanion urges its investors to review the reconciliation of its non-GAAP financial measures to the most directly comparable GAAP financial measures in its consolidated financial statements, and not to rely on any single financial or operating measure to evaluate its business. These reconciliations are included below and on Trupanion’s Investor Relations website.
Because of varying available valuation methodologies, subjective assumptions and the variety of equity instruments that can impact a company’s non-cash expenses, Trupanion believes that providing various non-GAAP financial measures that exclude stock-based compensation expense and depreciation and amortization expense allows for more meaningful comparisons between its operating results from period to period. Trupanion offsets new pet acquisition expense with sign-up fee revenue in the calculation of net acquisition cost because it collects sign-up fee revenue from new members at the time of enrollment and considers it to be an offset to a portion of Trupanion’s new pet acquisition expense. Trupanion believes this allows it to calculate and present financial measures in a consistent manner across periods. Trupanion’s management believes that the non-GAAP financial measures and the related financial measures derived from them are important tools for financial and operational decision-making and for evaluating operating results over different periods of time.
| Trupanion, Inc. Condensed Consolidated Statements of Operations (in thousands, except share data) | |||||||||||||||
| Three Months Ended December 31, | Year Ended December 31, | ||||||||||||||
| 2024 | 2023 | 2024 | 2023 | ||||||||||||
| (unaudited) | |||||||||||||||
| Revenue: | |||||||||||||||
| Subscription business | $ | 227,783 | $ | 191,537 | $ | 856,521 | $ | 712,906 | |||||||
| Other business | 109,524 | 104,320 | 429,163 | 395,699 | |||||||||||
| Total revenue | 337,307 | 295,857 | 1,285,684 | 1,108,605 | |||||||||||
| Cost of revenue: | |||||||||||||||
| Subscription business | 181,614 | 158,631 | 706,851 | 613,686 | |||||||||||
| Other business | 102,770 | 97,162 | 400,035 | 363,903 | |||||||||||
| Total cost of revenue(1), (2) | 284,384 | 255,793 | 1,106,886 | 977,589 | |||||||||||
| Operating expenses: | |||||||||||||||
| Technology and development(1) | 8,172 | 5,969 | 31,255 | 21,403 | |||||||||||
| General and administrative(1) | 16,828 | 13,390 | 63,731 | 60,207 | |||||||||||
| New pet acquisition expense(1) | 18,354 | 17,189 | 71,379 | 77,372 | |||||||||||
| Goodwill impairment charges | 5,299 | — | 5,299 | — | |||||||||||
| Depreciation and amortization | 3,924 | 3,029 | 16,466 | 12,474 | |||||||||||
| Total operating expenses | 52,577 | 39,577 | 188,130 | 171,456 | |||||||||||
| Gain (loss) from investment in joint venture | 2 | (79 | ) | (182 | ) | (219 | ) | ||||||||
| Operating income (loss) | 348 | 408 | (9,514 | ) | (40,659 | ) | |||||||||
| Interest expense | 3,427 | 3,697 | 14,498 | 12,077 | |||||||||||
| Other expense (income), net | (4,773 | ) | (1,256 | ) | (14,374 | ) | (7,701 | ) | |||||||
| Income (loss) before income taxes | 1,694 | (2,033 | ) | (9,638 | ) | (45,035 | ) | ||||||||
| Income tax expense (benefit) | 38 | 130 | (5 | ) | (342 | ) | |||||||||
| Net income (loss) | $ | 1,656 | $ | (2,163 | ) | $ | (9,633 | ) | $ | (44,693 | ) | ||||
| Net income (loss) per share: | |||||||||||||||
| Basic | $ | 0.04 | $ | (0.05 | ) | $ | (0.23 | ) | $ | (1.08 | ) | ||||
| Diluted | $ | 0.04 | $ | (0.05 | ) | $ | (0.23 | ) | $ | (1.08 | ) | ||||
| Weighted average shares of common stock outstanding: | |||||||||||||||
| Basic | 42,402,323 | 41,716,527 | 42,158,773 | 41,436,882 | |||||||||||
| Diluted | 42,903,536 | 41,716,527 | 42,158,773 | 41,436,882 | |||||||||||
| (1)Includes stock-based compensation expense as follows: | Three Months Ended December 31, | Year Ended December 31, | |||||||||||||
| 2024 | 2023 | 2024 | 2023 | ||||||||||||
| Cost of revenue | $ | 1,337 | $ | 1,478 | $ | 5,523 | $ | 5,279 | |||||||
| Technology and development | 1,160 | 861 | 4,934 | 2,846 | |||||||||||
| General and administrative | 4,261 | 3,269 | 15,696 | 17,717 | |||||||||||
| New pet acquisition expense | 1,536 | 1,693 | 7,279 | 7,319 | |||||||||||
| Total stock-based compensation expense | $ | 8,294 | $ | 7,301 | $ | 33,432 | $ | 33,161 | |||||||
| (2)The breakout of cost of revenue between veterinary invoice expense and other cost of revenue is as follows: | |||||||||||||||
| Three Months Ended December 31, | Year Ended December 31, | ||||||||||||||
| 2024 | 2023 | 2024 | 2023 | ||||||||||||
| Veterinary invoice expense | $ | 245,663 | $ | 217,739 | $ | 949,148 | $ | 831,055 | |||||||
| Other cost of revenue | 38,721 | 38,054 | 157,738 | 146,534 | |||||||||||
| Total cost of revenue | $ | 284,384 | $ | 255,793 | $ | 1,106,886 | $ | 977,589 | |||||||
| Trupanion, Inc. Condensed Consolidated Balance Sheets (in thousands, except share data) | |||||||
| December 31, 2024 | December 31, 2023 | ||||||
| Assets | |||||||
| Current assets: | |||||||
| Cash and cash equivalents | $ | 160,295 | $ | 147,501 | |||
| Short-term investments | 147,089 | 129,667 | |||||
| Accounts and other receivables, net of allowance for credit losses of | 274,031 | 267,899 | |||||
| Prepaid expenses and other assets | 15,912 | 17,022 | |||||
| Total current assets | 597,327 | 562,089 | |||||
| Restricted cash | 39,235 | 22,963 | |||||
| Long-term investments | 373 | 12,866 | |||||
| Property, equipment and internal-use software, net | 102,191 | 103,650 | |||||
| Intangible assets, net | 13,177 | 18,745 | |||||
| Other long-term assets | 17,579 | 18,922 | |||||
| Goodwill | 36,971 | 43,713 | |||||
| Total assets | $ | 806,853 | $ | 782,948 | |||
| Liabilities and stockholders’ equity | |||||||
| Current liabilities: | |||||||
| Accounts payable | $ | 11,532 | $ | 10,505 | |||
| Accrued liabilities and other current liabilities | 33,469 | 34,052 | |||||
| Reserve for veterinary invoices | 51,635 | 63,238 | |||||
| Deferred revenue | 251,640 | 235,329 | |||||
| Long-term debt - current portion | 1,350 | 1,350 | |||||
| Total current liabilities | 349,626 | 344,474 | |||||
| Long-term debt | 127,537 | 127,580 | |||||
| Deferred tax liabilities | 1,946 | 2,685 | |||||
| Other liabilities | 4,476 | 4,487 | |||||
| Total liabilities | 483,585 | 479,226 | |||||
| Stockholders’ equity: | |||||||
| Common stock: | — | — | |||||
| Preferred stock: | — | — | |||||
| Additional paid-in capital | 568,302 | 536,108 | |||||
| Accumulated other comprehensive income (loss) | (2,612 | ) | 403 | ||||
| Accumulated deficit | (225,888 | ) | (216,255 | ) | |||
| Treasury stock, at cost: 1,028,186 shares at December 31, 2024 and December 31, 2023 | (16,534 | ) | (16,534 | ) | |||
| Total stockholders’ equity | 323,268 | 303,722 | |||||
| Total liabilities and stockholders’ equity | $ | 806,853 | $ | 782,948 | |||
| Trupanion, Inc. Condensed Consolidated Statements of Cash Flows (in thousands) | |||||||||||||||
| Three Months Ended December 31, | Year Ended December 31, | ||||||||||||||
| 2024 | 2023 | 2024 | 2023 | ||||||||||||
| (unaudited) | |||||||||||||||
| Operating activities | |||||||||||||||
| Net income (loss) | $ | 1,656 | $ | (2,163 | ) | $ | (9,633 | ) | $ | (44,693 | ) | ||||
| Adjustments to reconcile net loss to cash provided by (used in) operating activities: | |||||||||||||||
| Depreciation and amortization | 3,924 | 3,029 | 16,466 | 12,474 | |||||||||||
| Stock-based compensation expense | 8,294 | 7,301 | 33,432 | 33,161 | |||||||||||
| Goodwill impairment charges | 5,299 | — | 5,299 | — | |||||||||||
| Other, net | (1,294 | ) | 2,481 | (1,748 | ) | 1,347 | |||||||||
| Changes in operating assets and liabilities: | |||||||||||||||
| Accounts and other receivables | 15,303 | 10,153 | (6,717 | ) | (35,440 | ) | |||||||||
| Prepaid expenses and other assets | 817 | 854 | 3,215 | (1,907 | ) | ||||||||||
| Accounts payable, accrued liabilities, and other liabilities | 2,433 | 5,476 | 2,084 | 1,644 | |||||||||||
| Reserve for veterinary invoices | (4,841 | ) | 1,788 | (11,310 | ) | 19,485 | |||||||||
| Deferred revenue | (7,890 | ) | (11,412 | ) | 17,199 | 32,567 | |||||||||
| Net cash provided by (used in) operating activities | 23,701 | 17,507 | 48,287 | 18,638 | |||||||||||
| Investing activities | |||||||||||||||
| Purchases of investment securities | (26,118 | ) | (56,547 | ) | (133,493 | ) | (165,936 | ) | |||||||
| Maturities and sales of investment securities | 45,886 | 42,905 | 127,653 | 190,270 | |||||||||||
| Purchases of property, equipment, and internal-use software | (1,858 | ) | (3,970 | ) | (9,716 | ) | (18,280 | ) | |||||||
| Other | 548 | 165 | 2,099 | 1,585 | |||||||||||
| Net cash provided by (used in) investing activities | 18,458 | (17,447 | ) | (13,457 | ) | 7,639 | |||||||||
| Financing activities | |||||||||||||||
| Proceeds from debt financing, net of financing fees | — | — | — | 60,102 | |||||||||||
| Repayments of debt financing | (338 | ) | (337 | ) | (1,350 | ) | (1,717 | ) | |||||||
| Proceeds from exercise of stock options | 36 | 1,374 | 752 | 2,655 | |||||||||||
| Shares withheld to satisfy tax withholding | (1,142 | ) | (240 | ) | (2,519 | ) | (1,536 | ) | |||||||
| Other | (230 | ) | (228 | ) | (840 | ) | (378 | ) | |||||||
| Net cash provided by (used in) financing activities | (1,674 | ) | 569 | (3,957 | ) | 59,126 | |||||||||
| Effect of foreign exchange rate changes on cash, cash equivalents, and restricted cash, net | (1,826 | ) | 1,254 | (1,807 | ) | 424 | |||||||||
| Net change in cash, cash equivalents, and restricted cash | 38,659 | 1,883 | 29,066 | 85,827 | |||||||||||
| Cash, cash equivalents, and restricted cash at beginning of period | 160,871 | 168,581 | 170,464 | 84,637 | |||||||||||
| Cash, cash equivalents, and restricted cash at end of period | $ | 199,530 | $ | 170,464 | $ | 199,530 | $ | 170,464 | |||||||
| The following tables set forth our key operating metrics. | |||||||||||||||||||||||||||||||
| Year Ended December 31, | |||||||||||||||||||||||||||||||
| 2024 | 2023 | ||||||||||||||||||||||||||||||
| Total Business: | |||||||||||||||||||||||||||||||
| Total pets enrolled (at period end) | 1,677,570 | 1,714,473 | |||||||||||||||||||||||||||||
| Subscription Business: | |||||||||||||||||||||||||||||||
| Total subscription pets enrolled (at period end) | 1,041,212 | 991,426 | |||||||||||||||||||||||||||||
| Monthly average revenue per pet | $ | 72.98 | $ | 65.26 | |||||||||||||||||||||||||||
| Average pet acquisition cost (PAC) | $ | 235 | $ | 228 | |||||||||||||||||||||||||||
| Average monthly retention | 98.25 | % | 98.49 | % | |||||||||||||||||||||||||||
| Three Months Ended | |||||||||||||||||||||||||||||||
| Dec. 31, 2024 | Sep. 30, 2024 | Jun. 30, 2024 | Mar. 31, 2024 | Dec. 31, 2023 | Sep. 30, 2023 | Jun. 30, 2023 | Mar. 31, 2023 | ||||||||||||||||||||||||
| Total Business: | |||||||||||||||||||||||||||||||
| Total pets enrolled (at period end) | 1,677,570 | 1,688,903 | 1,699,643 | 1,708,017 | 1,714,473 | 1,712,177 | 1,679,659 | 1,616,865 | |||||||||||||||||||||||
| Subscription Business: | |||||||||||||||||||||||||||||||
| Total subscription pets enrolled (at period end) | 1,041,212 | 1,032,042 | 1,020,934 | 1,006,168 | 991,426 | 969,322 | 943,958 | 906,369 | |||||||||||||||||||||||
| Monthly average revenue per pet | $ | 76.02 | $ | 74.27 | $ | 71.72 | $ | 69.79 | $ | 67.07 | $ | 65.82 | $ | 64.41 | $ | 63.58 | |||||||||||||||
| Average pet acquisition cost (PAC) | $ | 261 | $ | 243 | $ | 231 | $ | 207 | $ | 217 | $ | 212 | $ | 236 | $ | 247 | |||||||||||||||
| Average monthly retention | 98.25 | % | 98.29 | % | 98.34 | % | 98.41 | % | 98.49 | % | 98.55 | % | 98.61 | % | 98.65 | % | |||||||||||||||
| The following table reflects the reconciliation of cash provided by operating activities to free cash flow (in thousands): | |||||||||||||||
| Three Months Ended December 31, | Year Ended December 31, | ||||||||||||||
| 2024 | 2023 | 2024 | 2023 | ||||||||||||
| Net cash provided by operating activities | $ | 23,701 | $ | 17,507 | $ | 48,287 | $ | 18,638 | |||||||
| Purchases of property, equipment, and internal-use software | (1,858 | ) | (3,970 | ) | (9,716 | ) | (18,280 | ) | |||||||
| Free cash flow | $ | 21,843 | $ | 13,537 | $ | 38,571 | $ | 358 | |||||||
| The following table reflects the reconciliation between GAAP and non-GAAP measures (in thousands except percentages): | ||||||||||||||||
| Three Months Ended December 31, | Year Ended December 31, | |||||||||||||||
| 2024 | 2023 | 2024 | 2023 | |||||||||||||
| Veterinary invoice expense | $ | 245,663 | $ | 217,739 | $ | 949,148 | $ | 831,055 | ||||||||
| Less: | ||||||||||||||||
| Stock-based compensation expense(1) | (800 | ) | (885 | ) | (3,335 | ) | (3,450 | ) | ||||||||
| Other business cost of paying veterinary invoices(4) | (85,378 | ) | (77,572 | ) | (324,720 | ) | (287,858 | ) | ||||||||
| Subscription cost of paying veterinary invoices (non-GAAP) | $ | 159,485 | $ | 139,282 | $ | 621,093 | $ | 539,747 | ||||||||
| % of subscription revenue | 70.0 | % | 72.7 | % | 72.5 | % | 75.7 | % | ||||||||
| Other cost of revenue | $ | 38,721 | $ | 38,054 | $ | 157,738 | $ | 146,534 | ||||||||
| Less: | ||||||||||||||||
| Stock-based compensation expense(1) | (476 | ) | (386 | ) | (1,955 | ) | (1,544 | ) | ||||||||
| Other business variable expenses(4) | (17,336 | ) | (19,301 | ) | (75,050 | ) | (75,756 | ) | ||||||||
| Subscription variable expenses (non-GAAP) | $ | 20,909 | $ | 18,367 | $ | 80,733 | $ | 69,234 | ||||||||
| % of subscription revenue | 9.2 | % | 9.6 | % | 9.4 | % | 9.7 | % | ||||||||
| Technology and development expense | $ | 8,172 | $ | 5,969 | $ | 31,255 | $ | 21,403 | ||||||||
| General and administrative expense | 16,828 | 13,390 | 63,731 | 60,207 | ||||||||||||
| Less: | ||||||||||||||||
| Stock-based compensation expense(1) | (5,277 | ) | (3,797 | ) | (19,742 | ) | (19,869 | ) | ||||||||
| Non-recurring transaction or restructuring expenses(2) | — | — | — | (4,175 | ) | |||||||||||
| Development expenses(3) | (1,322 | ) | (1,683 | ) | (5,624 | ) | (5,100 | ) | ||||||||
| Fixed expenses (non-GAAP) | $ | 18,401 | $ | 13,879 | $ | 69,620 | $ | 52,466 | ||||||||
| % of total revenue | 5.5 | % | 4.7 | % | 5.4 | % | 4.7 | % | ||||||||
| New pet acquisition expense | $ | 18,354 | $ | 17,189 | $ | 71,379 | $ | 77,372 | ||||||||
| Less: | ||||||||||||||||
| Stock-based compensation expense(1) | (1,482 | ) | (1,567 | ) | (6,908 | ) | (7,000 | ) | ||||||||
| Other business pet acquisition expense(4) | (8 | ) | (77 | ) | (39 | ) | (200 | ) | ||||||||
| Subscription acquisition cost (non-GAAP) | $ | 16,864 | $ | 15,545 | $ | 64,432 | $ | 70,172 | ||||||||
| % of subscription revenue | 7.4 | % | 8.1 | % | 7.5 | % | 9.8 | % | ||||||||
| (1) Trupanion employees may elect to take restricted stock units in lieu of cash payment for their bonuses. We account for such expense as stock-based compensation according to GAAP, but we do not include it in any non-GAAP adjustments. Stock-based compensation associated with bonuses was approximately (2) Consists of business acquisition transaction expenses, severance and legal costs due to certain executive departures, and a (3) Consists of costs related to product exploration and development that are pre-revenue and historically have been insignificant. (4) Excludes the portion of stock-based compensation expense attributable to the other business segment. | ||||||||||||||||
| The following table reflects the reconciliation of GAAP measures to non-GAAP measures (in thousands, except percentages): | |||||||||||||||
| Three Months Ended December 31, | Year Ended December 31, | ||||||||||||||
| 2024 | 2023 | 2024 | 2023 | ||||||||||||
| Operating income (loss) | $ | 348 | $ | 408 | $ | (9,514 | ) | $ | (40,659 | ) | |||||
| Non-GAAP expense adjustments | |||||||||||||||
| Acquisition cost | 16,872 | 15,622 | 64,471 | 70,372 | |||||||||||
| Stock-based compensation expense(1) | 8,035 | 6,636 | 31,940 | 31,864 | |||||||||||
| Development expenses(3) | 1,322 | 1,683 | 5,624 | 5,100 | |||||||||||
| Depreciation and amortization | 3,924 | 3,029 | 16,466 | 12,474 | |||||||||||
| Goodwill impairment charges | 5,299 | — | 5,299 | — | |||||||||||
| Non-recurring transaction or restructuring expenses(2) | — | — | — | 4,175 | |||||||||||
| Gain (loss) from investment in joint venture | 2 | (79 | ) | (182 | ) | (219 | ) | ||||||||
| Total adjusted operating income (non-GAAP) | $ | 35,798 | $ | 27,457 | $ | 114,468 | $ | 83,545 | |||||||
| Subscription Business: | |||||||||||||||
| Subscription operating income (loss) | $ | 2,995 | $ | 1,300 | $ | (1,118 | ) | $ | (35,994 | ) | |||||
| Non-GAAP expense adjustments | |||||||||||||||
| Acquisition cost | 16,864 | 15,545 | 64,432 | 70,172 | |||||||||||
| Stock-based compensation expense(1) | 6,263 | 5,006 | 24,985 | 24,488 | |||||||||||
| Development expenses(3) | 893 | 1,090 | 3,745 | 3,281 | |||||||||||
| Depreciation and amortization | 2,650 | 1,961 | 10,970 | 8,021 | |||||||||||
| Goodwill impairment charges | 5,299 | — | 5,299 | — | |||||||||||
| Non-recurring transaction or restructuring expenses(2) | — | — | — | 218 | |||||||||||
| Subscription adjusted operating income (non-GAAP) | $ | 34,964 | $ | 24,902 | $ | 108,313 | $ | 70,186 | |||||||
| Other Business: | |||||||||||||||
| Other business operating income (loss) | $ | (2,649 | ) | $ | (813 | ) | $ | (8,214 | ) | $ | (4,446 | ) | |||
| Non-GAAP expense adjustments | |||||||||||||||
| Acquisition cost | 8 | 77 | 39 | 200 | |||||||||||
| Stock-based compensation expense(1) | 1,772 | 1,630 | 6,955 | 7,376 | |||||||||||
| Development expenses(3) | 429 | 593 | 1,879 | 1,819 | |||||||||||
| Depreciation and amortization | 1,274 | 1,068 | 5,496 | 4,453 | |||||||||||
| Non-recurring transaction or restructuring expenses(2) | — | — | — | 3,957 | |||||||||||
| Other business adjusted operating income (non-GAAP) | $ | 834 | $ | 2,555 | $ | 6,155 | $ | 13,359 | |||||||
| (1) Trupanion employees may elect to take restricted stock units in lieu of cash payment for their bonuses. We account for such expense as stock-based compensation in accordance with GAAP, but we do not include it in any non-GAAP adjustments. Stock-based compensation associated with bonuses was approximately | |||||||||||||||
| (2) Consists of business acquisition transaction expenses, severance and legal costs due to certain executive departures, and a | |||||||||||||||
| (3) Consists of costs related to product exploration and development that are pre-revenue and historically have been insignificant. | |||||||||||||||
| The following table reflects the reconciliation of GAAP measures to non-GAAP measures (in thousands, except percentages): | |||||||||||||||
| Three Months Ended December 31, | Year Ended December 31, | ||||||||||||||
| 2024 | 2023 | 2024 | 2023 | ||||||||||||
| Subscription revenue | $ | 227,783 | $ | 191,537 | $ | 856,521 | $ | 712,906 | |||||||
| Subscription cost of paying veterinary invoices | 159,485 | 139,281 | 621,093 | 539,746 | |||||||||||
| Subscription variable expenses | 20,909 | 18,367 | 80,733 | 69,234 | |||||||||||
| Subscription fixed expenses* | 12,425 | 8,987 | 46,382 | 33,740 | |||||||||||
| Subscription adjusted operating income (non-GAAP) | $ | 34,964 | $ | 24,902 | $ | 108,313 | $ | 70,186 | |||||||
| Other business revenue | 109,524 | 104,320 | 429,163 | 395,699 | |||||||||||
| Other business cost of paying veterinary invoices | 85,378 | 77,572 | 324,720 | 287,858 | |||||||||||
| Other business variable expenses | 17,336 | 19,301 | 75,050 | 75,756 | |||||||||||
| Other business fixed expenses* | 5,976 | 4,892 | 23,238 | 18,726 | |||||||||||
| Other business adjusted operating income (non-GAAP) | $ | 834 | $ | 2,555 | $ | 6,155 | $ | 13,359 | |||||||
| Revenue | 337,307 | 295,857 | 1,285,684 | 1,108,605 | |||||||||||
| Cost of paying veterinary invoices | 244,863 | 216,854 | 945,813 | 827,605 | |||||||||||
| Variable expenses | 38,245 | 37,668 | 155,783 | 144,990 | |||||||||||
| Fixed expenses* | 18,401 | 13,879 | 69,620 | 52,466 | |||||||||||
| Total business adjusted operating income (non-GAAP) | $ | 35,798 | $ | 27,457 | $ | 114,468 | $ | 83,545 | |||||||
| As a percentage of revenue: | Three Months Ended December 31, | Year Ended December 31, | |||||||||||||
| 2024 | 2023 | 2024 | 2023 | ||||||||||||
| Subscription revenue | 100.0 | % | 100.0 | % | 100.0 | % | 100.0 | % | |||||||
| Subscription cost of paying veterinary invoices | 70.0 | % | 72.7 | % | 72.5 | % | 75.7 | % | |||||||
| Subscription variable expenses | 9.2 | % | 9.6 | % | 9.4 | % | 9.7 | % | |||||||
| Subscription fixed expenses* | 5.5 | % | 4.7 | % | 5.4 | % | 4.7 | % | |||||||
| Subscription adjusted operating income (non-GAAP) | 15.3 | % | 13.0 | % | 12.6 | % | 9.8 | % | |||||||
| Other business revenue | 100.0 | % | 100.0 | % | 100.0 | % | 100.0 | % | |||||||
| Other business cost of paying veterinary invoices | 78.0 | % | 74.4 | % | 75.7 | % | 72.7 | % | |||||||
| Other business variable expenses | 15.8 | % | 18.5 | % | 17.5 | % | 19.1 | % | |||||||
| Other business fixed expenses* | 5.5 | % | 4.7 | % | 5.4 | % | 4.7 | % | |||||||
| Other business adjusted operating income (non-GAAP) | 0.8 | % | 2.4 | % | 1.4 | % | 3.4 | % | |||||||
| Revenue | 100.0 | % | 100.0 | % | 100.0 | % | 100.0 | % | |||||||
| Cost of paying veterinary invoices | 72.6 | % | 73.3 | % | 73.6 | % | 74.7 | % | |||||||
| Variable expenses | 11.3 | % | 12.7 | % | 12.1 | % | 13.1 | % | |||||||
| Fixed expenses* | 5.5 | % | 4.7 | % | 5.4 | % | 4.7 | % | |||||||
| Total business adjusted operating income (non-GAAP) | 10.6 | % | 9.3 | % | 8.9 | % | 7.5 | % | |||||||
| *Fixed expenses represent shared services that support both our subscription and other business segments and, as such, are generally allocated to each segment pro-rata based on revenues. | |||||||||||||||
Adjusted operating income is a non-GAAP financial measure that adjusts operating income (loss) to remove the effect of acquisition cost, development expenses, non-recurring transaction or restructuring expenses, and gain (loss) from investment in joint venture. Non-cash items, such as goodwill impairment charges, stock-based compensation expense and depreciation and amortization, are also excluded. Acquisition cost, development expenses, gain (loss) from investment in joint venture, stock-based compensation expense, and depreciation and amortization are expected to remain recurring expenses for the foreseeable future, but are excluded from this metric to measure scale in other areas of the business. Management believes acquisition costs primarily represent the cost to acquire new subscribers and are driven by the amount of growth we choose to pursue based primarily on the amount of our adjusted operating income period over period. Accordingly, this measure is not indicative of our core operating income performance. We also exclude development expenses, gain (loss) from investment in joint venture, stock-based compensation expense, and depreciation and amortization because some investors may not view those items as reflective of our core operating income performance.
Management uses adjusted operating income and the margin on adjusted operating income to understand the effects of scale in its non-acquisition cost and development expenses and to plan future advertising expenditures, which are designed to acquire new pets. Management uses this measure as a principal way of understanding the operating performance of its business exclusive of acquisition cost and new product exploration and development initiatives. Management believes disclosure of this metric provides investors with the same data that the Company employs in assessing its overall operations and that disclosure of this measure may provide useful information regarding the efficiency of our utilization of revenues, return on advertising dollars in the form of new subscribers and future use of available cash to support the continued growth of our business.
| The following tables reflect the reconciliation of adjusted EBITDA to net income (loss) (in thousands): | |||||||||||||||||||||||||||||||
| Year Ended December 31, | |||||||||||||||||||||||||||||||
| 2024 | 2023 | ||||||||||||||||||||||||||||||
| Net loss | $ | (9,633 | ) | $ | (44,693 | ) | |||||||||||||||||||||||||
| Excluding: | |||||||||||||||||||||||||||||||
| Stock-based compensation expense | 31,942 | 31,864 | |||||||||||||||||||||||||||||
| Depreciation and amortization expense | 16,466 | 12,474 | |||||||||||||||||||||||||||||
| Interest income | (12,411 | ) | (9,011 | ) | |||||||||||||||||||||||||||
| Interest expense | 14,498 | 12,077 | |||||||||||||||||||||||||||||
| Income tax benefit | (5 | ) | (342 | ) | |||||||||||||||||||||||||||
| Goodwill impairment charges | 5,299 | — | |||||||||||||||||||||||||||||
| Non-recurring transaction or restructuring expenses | — | 4,175 | |||||||||||||||||||||||||||||
| Gain from equity method investment | (33 | ) | (110 | ) | |||||||||||||||||||||||||||
| Adjusted EBITDA | $ | 46,123 | $ | 6,434 | |||||||||||||||||||||||||||
| Three Months Ended | |||||||||||||||||||||||||||||||
| Dec. 31, 2024 | Sep. 30, 2024 | Jun. 30, 2024 | Mar. 31, 2024 | Dec. 31, 2023 | Sep. 30, 2023 | Jun. 30, 2023 | Mar. 31, 2023 | ||||||||||||||||||||||||
| Net income (loss) | $ | 1,656 | $ | 1,425 | $ | (5,862 | ) | $ | (6,852 | ) | $ | (2,163 | ) | $ | (4,036 | ) | $ | (13,714 | ) | $ | (24,780 | ) | |||||||||
| Excluding: | |||||||||||||||||||||||||||||||
| Stock-based compensation expense | 8,036 | 8,127 | 8,381 | 7,398 | 6,636 | 6,585 | 6,503 | 12,140 | |||||||||||||||||||||||
| Depreciation and amortization expense | 3,924 | 4,381 | 4,376 | 3,785 | 3,029 | 2,990 | 3,253 | 3,202 | |||||||||||||||||||||||
| Interest income | (2,999 | ) | (3,232 | ) | (3,135 | ) | (3,045 | ) | (2,842 | ) | (2,389 | ) | (2,051 | ) | (1,729 | ) | |||||||||||||||
| Interest expense | 3,427 | 3,820 | 3,655 | 3,596 | 3,697 | 3,053 | 2,940 | 2,387 | |||||||||||||||||||||||
| Income tax expense (benefit) | 38 | 39 | (44 | ) | (38 | ) | 130 | (43 | ) | (238 | ) | (191 | ) | ||||||||||||||||||
| Goodwill impairment charges | 5,299 | — | — | — | — | — | — | — | |||||||||||||||||||||||
| Non-recurring transaction or restructuring expenses | — | — | — | — | — | 8 | 65 | 4,102 | |||||||||||||||||||||||
| Gain from equity method investment | — | (33 | ) | — | — | — | (110 | ) | — | — | |||||||||||||||||||||
| Adjusted EBITDA | $ | 19,381 | $ | 14,527 | $ | 7,371 | $ | 4,844 | $ | 8,487 | $ | 6,058 | $ | (3,242 | ) | $ | (4,869 | ) | |||||||||||||
Contacts:
Investors:
Laura Bainbridge, Senior Vice President, Corporate Communications
Gil Melchior, Director, Investor Relations
Investor.Relations@trupanion.com
A photo accompanying this announcement is available at https://www.globenewswire.com/NewsRoom/AttachmentNg/1313fc50-df34-432e-8f6b-7dd236de3476
PDF available: http://ml.globenewswire.com/Resource/Download/361c6270-7516-4b4f-a8b7-51c217d753c3
