DAT: Truckload volumes rose in July as spot van rates hit parity year over year
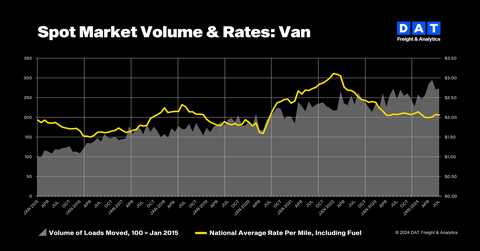
DAT Freight & Analytics reports that spot truckload freight volumes in July were stable for the second consecutive month and up over 10% year-over-year, potentially signaling an end to the two-year decline in truckload service demand. The DAT Truckload Volume Index (TVI) showed increases for van and refrigerated loads, while flatbed loads decreased slightly. Notably, national average dry van and reefer spot linehaul rates were not year-over-year negative for the first time in 27 months.
Key points:
- Van TVI: 273, up 0.7% month-over-month and 10% year-over-year
- Reefer TVI: 205, up 1.5% month-over-month and 13% year-over-year
- Flatbed TVI: 271, down 3.2% month-over-month but up 4% year-over-year
- National average spot van rate: $2.06 per mile, down 1 cent
- National average spot reefer rate: $2.45 per mile, unchanged
- National average spot flatbed rate: $2.60 per mile, down 3 cents
DAT Freight & Analytics riporta che i volumi di carico spot di camion a luglio sono rimasti stabili per il secondo mese consecutivo e sono cresciuti di oltre il 10% anno su anno, segnalando potenzialmente la fine del declino di due anni nella domanda di servizi di carico. L'Indice di Volume dei Carichi DAT (TVI) ha mostrato aumenti per i carichi a furgone e refrigerati, mentre i carichi a pianale sono diminuiti leggermente. È interessante notare che le tariffe nazionali medie di trasporto per furgoni e refrigerati non sono risultate negative anno su anno per la prima volta in 27 mesi.
Punti chiave:
- TVI Furgone: 273, in aumento dello 0,7% rispetto al mese precedente e del 10% anno su anno
- TVI Refrigerato: 205, in aumento dell'1,5% rispetto al mese precedente e del 13% anno su anno
- TVI Pianale: 271, in diminuzione del 3,2% rispetto al mese precedente ma in aumento del 4% anno su anno
- Tariffa media nazionale spot per furgone: $2,06 per miglio, in calo di 1 centesimo
- Tariffa media nazionale spot per refrigerato: $2,45 per miglio, invariata
- Tariffa media nazionale spot per pianale: $2,60 per miglio, in calo di 3 centesimi
DAT Freight & Analytics informa que los volúmenes de carga de camiones spot en julio se mantuvieron estables por segundo mes consecutivo y aumentaron más del 10% interanual, lo que podría señalar el fin de la caída de dos años en la demanda de servicios de carga. El Índice de Volumen de Carga DAT (TVI) mostró incrementos en las cargas de furgones y refrigerados, mientras que las cargas de plataforma disminuyeron ligeramente. Es notable que las tarifas nacionales promedio de transporte para furgones y refrigerados no mostraron resultados negativos interanuales por primera vez en 27 meses.
Puntos clave:
- TVI Furgón: 273, un aumento del 0,7% mes a mes y del 10% interanual
- TVI Refrigerado: 205, un aumento del 1,5% mes a mes y del 13% interanual
- TVI Plataforma: 271, una disminución del 3,2% mes a mes pero un aumento del 4% interanual
- Tarifa promedio nacional spot para furgón: $2,06 por milla, una disminución de 1 centavo
- Tarifa promedio nacional spot para refrigerado: $2,45 por milla, sin cambios
- Tarifa promedio nacional spot para plataforma: $2,60 por milla, una disminución de 3 centavos
DAT Freight & Analytics는 7월 스팟 트럭 화물 물량이 두 번째 연속으로 안정세를 보였고, 전년 대비 10% 이상 증가했다고 보고했습니다. 이는 트럭 화물 서비스 수요의 2년 하락이 끝날 수도 있음을 암시합니다. DAT 트럭 화물 물량 지수(TVI)는 밴 및 냉동 화물의 증가를 보였으나, 평면 화물은 약간 감소했습니다. 특히, 국가 평균 드라이 밴 및 냉동 스팟 운임 요금이 27개월 만에 처음으로 전년 대비 부정적이지 않았습니다.
주요 사항:
- 밴 TVI: 273, 전월 대비 0.7% 증가 및 전년 대비 10% 증가
- 냉동 TVI: 205, 전월 대비 1.5% 증가 및 전년 대비 13% 증가
- 평면 TVI: 271, 전월 대비 3.2% 감소하지만 전년 대비 4% 증가
- 국가 평균 스팟 밴 요금: 마일당 $2.06, 1센트 감소
- 국가 평균 스팟 냉동 요금: 마일당 $2.45, 변동 없음
- 국가 평균 스팟 평면 요금: 마일당 $2.60, 3센트 감소
DAT Freight & Analytics rapporte que les volumes de fret de chargement spot en juillet sont restés stables pour le deuxième mois consécutif et ont augmenté de plus de 10 % par rapport à l'année précédente, ce qui pourrait signaler la fin de la baisse de deux ans de la demande de services de chargement. L'Indice de Volume de Chargement DAT (TVI) a montré des augmentations pour les chargements en fourgons et réfrigérés, tandis que les chargements à plat ont légèrement diminué. Il est à noter que les tarifs moyens nationaux de transport en fourgon et réfrigéré n'ont pas été négatifs d'une année sur l'autre pour la première fois en 27 mois.
Points clés :
- TVI Fourgon : 273, en hausse de 0,7 % par rapport au mois précédent et de 10 % par rapport à l'année précédente
- TVI Réfrigéré : 205, en hausse de 1,5 % par rapport au mois précédent et de 13 % par rapport à l'année précédente
- TVI Plat : 271, en baisse de 3,2 % par rapport au mois précédent mais en hausse de 4 % par rapport à l'année précédente
- Tarif moyen national spot pour fourgon : 2,06 $ par mile, en baisse de 1 cent
- Tarif moyen national spot pour réfrigéré : 2,45 $ par mile, inchangé
- Tarif moyen national spot pour plat : 2,60 $ par mile, en baisse de 3 cents
DAT Freight & Analytics berichtet, dass die Spot-Lkw-Frachtmengen im Juli im zweiten aufeinanderfolgenden Monat stabil waren und im Vergleich zum Vorjahr um über 10% gestiegen sind, was möglicherweise das Ende des zweijährigen Rückgangs der Nachfrage nach Lkw-Diensten signalisiert. Der DAT Truckload Volume Index (TVI) zeigte Zuwächse bei Fracht mit Kastenwagen und Kühlfracht, während die Flachbettfracht leicht zurückging. Bemerkenswert ist, dass die durchschnittlichen nationalen Spotlinienraten für trockene Kastenwagen und Kühltransporte zum ersten Mal seit 27 Monaten nicht mehr negativ im Vergleich zum Vorjahr waren.
Wichtige Punkte:
- TVI Kastenwagen: 273, ein Anstieg von 0,7% im Vergleich zum Vormonat und 10% im Vergleich zum Vorjahr
- TVI Kühltransporte: 205, ein Anstieg von 1,5% im Vergleich zum Vormonat und 13% im Vergleich zum Vorjahr
- TVI Flachbett: 271, ein Rückgang von 3,2% im Vergleich zum Vormonat, aber ein Anstieg von 4% im Vergleich zum Vorjahr
- Durchschnittlicher nationaler Spotpreis für Kastenwagen: $2,06 pro Meile, um 1 Cent gesunken
- Durchschnittlicher nationaler Spotpreis für Kühltransporte: $2,45 pro Meile, unverändert
- Durchschnittlicher nationaler Spotpreis für Flachbetten: $2,60 pro Meile, um 3 Cent gesunken
- Spot truckload freight volumes up over 10% year-over-year, indicating potential end to demand decline
- DAT Truckload Volume Index (TVI) increased for van and refrigerated loads
- National average dry van and reefer spot linehaul rates not year-over-year negative for first time in 27 months
- Van TVI up 10% year-over-year
- Reefer TVI up 13% year-over-year
- Flatbed TVI up 4% year-over-year
- Flatbed TVI down 3.2% month-over-month
- National average spot van rate down 1 cent to $2.06 per mile
- National average spot flatbed rate down 3 cents to $2.60 per mile
- National average load-to-truck ratios declined for all three equipment types
Insights
The DAT Truckload Volume Index (TVI) data suggests a potential stabilization in the trucking industry after a prolonged period of declining demand. The 10% year-over-year increase in spot truckload freight volumes is a positive indicator for the sector. However, it's important to note that while volumes are up, pricing remains relatively flat. The parity in year-over-year spot van rates after 27 months of decline is a significant milestone, potentially signaling a bottom in the market.
From an investor's perspective, this data presents a mixed picture. The volume increase is encouraging, but the lack of corresponding price growth suggests that overcapacity issues may still be present. The decline in load-to-truck ratios across all equipment types compared to June further supports this view. However, the year-over-year improvements in these ratios indicate a gradual move towards a more balanced market.
Overall, while the news is cautiously positive for the trucking industry, investors should remain vigilant. The sector may be approaching an inflection point, but sustained improvement in both volumes and pricing will be necessary to confirm a true recovery.
The trucking industry's dynamics are closely tied to broader economic trends. The reported near-record container imports suggest robust consumer demand, which could be a positive indicator for the overall economy. However, the mention of weather-related supply chain disruptions adds a layer of complexity to interpreting this data.
Interestingly, the divergence between spot and contract rates is narrowing, particularly in the van segment. This convergence could lead to a more competitive environment for carriers and potentially impact their profitability. The stability in flatbed rates since January, despite seasonal fluctuations typically seen in this segment, warrants attention and may indicate changing patterns in industrial and construction activity.
For investors, these trends suggest a need to closely monitor economic indicators that influence trucking demand, such as retail sales, manufacturing output and construction activity. The data also highlights the importance of operational efficiency for trucking companies in a market where volume growth is not yet translating into significant price increases.
Truckload volumes rose in July as spot van rates hit parity year over year (Graphic: DAT Freight & Analytics)
The DAT Truckload Volume Index (TVI), an indicator of loads moved during a given month, increased marginally for van and refrigerated (“reefer”) loads in July:
-
Van TVI: 273, up
0.7% month over month -
Reefer TVI: 205, up
1.5% -
Flatbed TVI: 271, down
3.2%
The TVI was higher for all three equipment types compared to July 2023. The van TVI increased almost
“Near-record container imports and weather-related supply chain disruptions helped drive loads to the spot market at a time when available capacity tightened,” said Ken Adamo, DAT Chief of Analytics. “The pricing environment for carriers showed signs of improvement. National average dry van and reefer spot linehaul rates in July were not year-over-year negative for the first time in 27 months.”
Spot rates held steady
National average spot truckload van and reefer rates held firm compared to June:
-
Spot van:
per mile, down$2.06 1 cent -
Spot reefer:
a mile, unchanged$2.45 -
Spot flatbed:
a mile, down$2.60 3 cents
Linehaul rates, which subtract an amount equal to an average fuel surcharge, were also flat. The average van linehaul rate was
National average rates for contracted freight were generally unmoved:
-
Contract van rate:
per mile, down$2.43 1 cent -
Contract reefer rate:
a mile, unchanged$2.81 -
Contract flatbed rate:
a mile, down$3.11 3 cents
Load-to-truck ratios declined
National average load-to-truck ratios declined for all three equipment types:
- Van ratio: 4.2, down from 4.7 in June, meaning there were 4.2 loads for every van truck on the DAT One marketplace.
- Reefer ratio: 6.5, down from 7.0
- Flatbed ratio: 11.9, down from 14.6
Ratios were higher compared to July 2023, when the average van ratio was 3.6, the reefer ratio was 5.4, and the flatbed ratio was 9.4. Load-to-truck ratios reflect truckload supply and demand on the DAT One marketplace and indicate the pricing environment for spot truckload freight.
About the DAT Truckload Volume Index
The DAT Truckload Volume Index reflects the change in the number of loads with a pickup date during that month. A baseline of 100 equals the number of loads moved in January 2015, as recorded in DAT RateView, a truckload pricing database and analysis tool with rates paid on an average of 3 million loads per month.
DAT benchmark spot rates are derived from invoice data for hauls of 250 miles or more with a pickup date during the month reported. Linehaul rates subtract an amount equal to an average fuel surcharge.
About DAT Freight & Analytics
DAT Freight & Analytics operates both the largest truckload freight marketplace and truckload freight data analytics service in
Founded in 1978, DAT is a business unit of Roper Technologies (Nasdaq: ROP), a constituent of the Nasdaq 100, S&P 500, and Fortune 1000. DAT is headquartered in
View source version on businesswire.com: https://www.businesswire.com/news/home/20240816883366/en/
DAT
Annabel Reeves
PR@dat.com / annabel.reeves@dat.com; 503-501-0143
Source: DAT Freight & Analytics
FAQ
What was the DAT Truckload Volume Index (TVI) for vans in July 2024?
How did national average spot truckload rates change in July 2024?
What was the year-over-year change in spot truckload freight volumes in July 2024?