Informatica Reports Second Quarter 2024 Financial Results
Informatica (NYSE: INFA) reported strong Q2 2024 results, with Cloud Subscription ARR up 37% year-over-year to $703 million and Total ARR increasing 7.8% to $1.67 billion. The company beat and raised guidance for Cloud Subscription ARR, Subscription ARR, Non-GAAP Operating Income, and Adjusted Unlevered Free Cash Flow. Key highlights include:
- GAAP Total Revenues increased 6.6% to $400.6 million
- GAAP Subscription Revenues up 16% to $264.3 million
- GAAP Cloud Subscription Revenue rose 35% to $161.4 million
- Non-GAAP Operating Income of $114.9 million
Informatica also launched CLAIRE GPT in North America and expanded partnerships with Microsoft, Snowflake, Databricks, and Oracle. The company updated its full-year 2024 guidance, raising expectations for key metrics while slightly lowering Total Revenue projections due to strategic shifts and FX headwinds.
Informatica (NYSE: INFA) ha riportato risultati forti per il secondo trimestre del 2024, con Cloud Subscription ARR in aumento del 37% anno su anno, arrivando a 703 milioni di dollari e Total ARR che cresce del 7,8% a 1,67 miliardi di dollari. L'azienda ha superato le aspettative e ha rivisto al rialzo le previsioni per Cloud Subscription ARR, Subscription ARR, Non-GAAP Operating Income e Adjusted Unlevered Free Cash Flow. I punti salienti includono:
- GAAP Total Revenues aumentato del 6,6% a 400,6 milioni di dollari
- GAAP Subscription Revenues in aumento del 16% a 264,3 milioni di dollari
- GAAP Cloud Subscription Revenue cresciuto del 35% a 161,4 milioni di dollari
- Non-GAAP Operating Income di 114,9 milioni di dollari
Informatica ha anche lanciato CLAIRE GPT in Nord America ed ampliato le partnership con Microsoft, Snowflake, Databricks e Oracle. L'azienda ha aggiornato le previsioni per l'intero anno 2024, aumentando le aspettative per i principali parametri mentre ha leggermente abbassato le proiezioni delle entrate totali a causa di spostamenti strategici e contraccolpi legati ai cambi valutari.
Informatica (NYSE: INFA) reportó resultados sólidos para el segundo trimestre de 2024, con Cloud Subscription ARR aumentando un 37% interanual a 703 millones de dólares y Total ARR creciendo un 7,8% a 1,67 mil millones de dólares. La empresa superó las expectativas y elevó su guía para Cloud Subscription ARR, Subscription ARR, Non-GAAP Operating Income y Adjusted Unlevered Free Cash Flow. Los aspectos destacados incluyen:
- GAAP Total Revenues aumentó un 6,6% a 400,6 millones de dólares
- GAAP Subscription Revenues creció un 16% a 264,3 millones de dólares
- GAAP Cloud Subscription Revenue incrementó un 35% a 161,4 millones de dólares
- Non-GAAP Operating Income de 114,9 millones de dólares
Informatica también lanzó CLAIRE GPT en América del Norte y amplió asociaciones con Microsoft, Snowflake, Databricks y Oracle. La compañía actualizó sus proyecciones para todo el año 2024, elevando las expectativas para métricas clave mientras que levemente redujo las proyecciones de ingresos totales debido a cambios estratégicos y vientos en contra de cambios de divisas.
인포매틱카 (NYSE: INFA)는 2024년 2분기 강력한 실적을 발표했으며, 클라우드 구독 ARR이 전년 대비 37% 증가하여 7억 3천만 달러에 달하고 총 ARR이 7.8% 증가하여 16억 7천만 달러에 이르렀습니다. 이 회사는 클라우드 구독 ARR, 구독 ARR, 비-GAAP 운영 수익 및 조정된 비부채 자유 현금 흐름에 대한 지침을 초과 달성하고 상향 조정했습니다. 주요 하이라이트는 다음과 같습니다:
- GAAP 총 수익이 6.6% 증가하여 4억 600만 달러
- GAAP 구독 수익이 16% 증가하여 2억 6430만 달러
- GAAP 클라우드 구독 수익이 35% 증가하여 1억 6140만 달러
- 비-GAAP 운영 수익이 1억 1490만 달러
인포매틱카는 또한 북미에서 CLAIRE GPT를 출시하고 Microsoft, Snowflake, Databricks 및 Oracle과의 파트너십을 확대했습니다. 이 회사는 전체 2024년 연간 지침을 업데이트하여 주요 지표에 대한 기대를 높이는 한편 전략적 변화와 외환 영향을 이유로 총 수익 전망을 소폭 하향 조정했습니다.
Informatica (NYSE: INFA) a publié des résultats solides pour le deuxième trimestre de 2024, avec Cloud Subscription ARR en hausse de 37 % par rapport à l'année précédente, atteignant 703 millions de dollars et Total ARR augmentant de 7,8 % à 1,67 milliard de dollars. L'entreprise a dépassé les attentes et a relevé les prévisions pour Cloud Subscription ARR, Subscription ARR, Non-GAAP Operating Income et Adjusted Unlevered Free Cash Flow. Les points saillants comprennent :
- GAAP Total Revenues en augmentation de 6,6 % à 400,6 millions de dollars
- GAAP Subscription Revenues en hausse de 16 % à 264,3 millions de dollars
- GAAP Cloud Subscription Revenue en augmentation de 35 % à 161,4 millions de dollars
- Non-GAAP Operating Income de 114,9 millions de dollars
Informatica a également lancé CLAIRE GPT en Amérique du Nord et élargi ses partenariats avec Microsoft, Snowflake, Databricks et Oracle. L'entreprise a mis à jour ses prévisions pour l'année 2024, augmentant les attentes pour les indicateurs clés tout en abaissant légèrement les prévisions de revenus totaux en raison de changements stratégiques et des vents contraires des taux de change.
Informatica (NYSE: INFA) meldete starke Ergebnisse für das zweite Quartal 2024, mit Cloud Subscription ARR, das um 37% im Vergleich zum Vorjahr auf 703 Millionen Dollar gestiegen ist, und Total ARR, das um 7,8% auf 1,67 Milliarden Dollar gewachsen ist. Das Unternehmen übertraf die Erwartungen und hob die Prognosen für Cloud Subscription ARR, Subscription ARR, Non-GAAP Operating Income und Adjusted Unlevered Free Cash Flow an. Wichtige Highlights sind:
- GAAP Gesamtumsatz stieg um 6,6% auf 400,6 Millionen Dollar
- GAAP Abonnementumsätze erhöhten sich um 16% auf 264,3 Millionen Dollar
- GAAP Cloud Subscription Umsatz wuchs um 35% auf 161,4 Millionen Dollar
- Non-GAAP Betriebsgewinn von 114,9 Millionen Dollar
Informatica hat auch CLAIRE GPT in Nordamerika eingeführt und Partnerschaften mit Microsoft, Snowflake, Databricks und Oracle ausgebaut. Das Unternehmen hat seine Prognosen für das Gesamtjahr 2024 aktualisiert und die Erwartungen für wichtige Kennzahlen angehoben, während die Prognosen für den Gesamtumsatz aufgrund strategischer Veränderungen und Wechselkursbelastungen leicht gesenkt wurden.
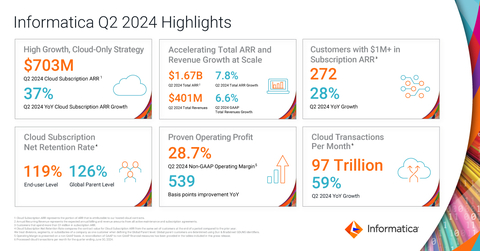
- Cloud Subscription ARR increased 37% year-over-year to $703 million
- Total ARR grew 7.8% year-over-year to $1.67 billion
- GAAP Subscription Revenues increased 16% year-over-year to $264.3 million
- GAAP Cloud Subscription Revenue rose 35% year-over-year to $161.4 million
- Raised full-year 2024 guidance for Cloud Subscription ARR, Subscription ARR, Non-GAAP Operating Income, and Adjusted Unlevered Free Cash Flow
- Launched CLAIRE GPT in North America, expanding AI capabilities
- Expanded partnerships with major tech companies like Microsoft, Snowflake, Databricks, and Oracle
- Achieved a Cloud Subscription net retention rate of 119% at end-user level and 126% at global parent level
- Reported 272 customers spending over $1 million in subscription ARR, up 28% year-over-year
- Updated GAAP Total Revenues guidance for full-year 2024 from $1.685-$1.705 billion to $1.660-$1.680 billion
- Expecting lower professional service revenues due to shift of implementation and support work to partners
- Anticipating lower upfront recognized self-managed subscription revenue due to shorter average duration of renewals
- Increased FX-related revenue headwinds of approximately $4 million compared to previous assumptions
Insights
Informatica's Q2 2024 results demonstrate strong growth in cloud-based offerings, reflecting the company's successful pivot towards a cloud-first strategy. The 37% year-over-year increase in Cloud Subscription ARR to
The company's overall financial health appears solid, with total ARR growing 7.8% year-over-year to
Notably, Informatica has raised its full-year 2024 guidance for key metrics, including Cloud Subscription ARR and Non-GAAP Operating Income. This upward revision indicates management's confidence in the company's growth trajectory and operational efficiency.
However, investors should note the slight downward adjustment in the GAAP Total Revenues guidance for the full year, primarily due to shifts in professional services strategy and accounting impacts. While this may temporarily affect top-line growth, the focus on partner-led implementations could lead to improved scalability and margins in the long term.
The company's strong cash flow position, with Adjusted Unlevered Free Cash Flow (after-tax) of
Informatica's Q2 results underscore its strategic positioning in the rapidly evolving AI and cloud data management landscape. The launch of CLAIRE GPT in North America marks a significant milestone, integrating generative AI capabilities into the company's Intelligent Data Management Cloud (IDMC) platform. This move aligns with the industry's shift towards AI-augmented data management solutions and could be a key differentiator for Informatica.
The 59% year-over-year increase in cloud transactions processed, reaching 96.6 trillion per month, demonstrates the scalability and robustness of Informatica's cloud infrastructure. This growth in transaction volume is a strong indicator of increased customer adoption and usage of the company's cloud services.
Informatica's expanded partnerships with major cloud providers like Microsoft, Snowflake, Databricks and Oracle are strategically important. These collaborations, including native integrations and joint solutions, enhance Informatica's ecosystem presence and provide customers with seamless data management capabilities across multiple cloud platforms.
The introduction of Cloud Data Access Management (CDAM) for Azure and Snowflake addresses the critical need for centralized data governance and access control in multi-cloud environments. This offering could be particularly appealing to enterprises grappling with complex data security and compliance requirements.
Overall, Informatica's product innovations and strategic partnerships position it well to capitalize on the growing demand for AI-powered, cloud-native data management solutions in the enterprise market.
Informatica's Q2 2024 results reflect broader market trends in the enterprise data management sector. The strong growth in cloud-based offerings aligns with the ongoing shift towards cloud-first strategies among large enterprises. The 37% year-over-year increase in Cloud Subscription ARR outpaces the overall market growth, suggesting Informatica is gaining market share in the cloud data management space.
The company's focus on AI and generative AI capabilities, exemplified by the launch of CLAIRE GPT, is timely given the surging interest in AI-powered solutions across industries. This positions Informatica to capitalize on the growing demand for intelligent data management tools that can handle the complexities of modern data environments.
The expansion of Informatica's global presence, particularly the planned office opening in Saudi Arabia, indicates a strategic move to tap into emerging markets with high growth potential. This aligns with the increasing focus on data-driven initiatives in regions like the Middle East.
The reported increase in customers spending over
However, the slight reduction in full-year GAAP Total Revenues guidance, partly due to shifts in professional services strategy, reflects broader industry trends towards partner-led implementations. While this may impact short-term revenue, it could lead to a more scalable and efficient business model in the long run.
-
Cloud Subscription Annualized Recurring Revenue (ARR) increased
37% year-over-year to$703 million -
Total ARR increased
7.8% year-over-year to$1.67 billion - Results within or above all second quarter 2024 guidance metric ranges
- Raises full-year 2024 Cloud Subscription ARR, Subscription ARR, Non-GAAP Operating Income and Adjusted Unlevered Free Cash Flow (after-tax) guidance; updates Total Revenue guidance
Source: Informatica Q2 2024
"We are very pleased with the continued customer momentum and consistent execution from our cloud-only, consumption-driven strategy, enabling us to beat and raise our Cloud Subscription ARR, Subscription ARR and bottom-line profitability outlook,” said Amit Walia, Chief Executive Officer at Informatica. “CLAIRE GPT, now generally available in
Second Quarter 2024 Financial Highlights:
-
GAAP Total Revenues increased
6.6% year-over-year to$400.6 million $1.6 million 7.0% year-over-year. -
GAAP Subscription Revenues increased
16% year-over-year to$264.3 million 35% year-over-year to$161.4 million 61% of subscription revenues. -
Total ARR increased
7.8% year-over-year to$1.67 billion $2.0 million -
Subscription ARR increased
15% year-over-year to$1.20 billion $1.1 million -
Cloud Subscription ARR increased
37% year-over-year to$703 million $0.7 million -
GAAP Operating Income of
$9.5 million $114.9 million -
GAAP Operating Cash Flow of
$24.9 million -
Adjusted Unlevered Free Cash Flow (after-tax) of
$71.2 million $37.9 million
A reconciliation of GAAP to non-GAAP financial measures has been provided in the tables included in this press release. An explanation of these measures is also included below under the heading “Non-GAAP Financial Measures.”
Second Quarter 2024 Business Highlights:
-
Processed 96.6 trillion cloud transactions per month for the quarter ended June 30, 2024, compared to 60.7 trillion cloud transactions per month in the same quarter last year, an increase of
59% year-over-year. -
Reported 272 customers that spend more than
$1 million 28% year-over-year. -
Reported 2,038 customers that spend more than
$100,000 5% year-over-year. -
Achieved a Cloud Subscription net retention rate (NRR) of
119% at the end-user level and126% at the global parent level as of June 30, 2024.
Product Innovation and Business Updates:
-
Launched CLAIRE GPT in
North America : the first GenAI-powered data management assistant grounded by enterprise metadata intelligence leveraging Informatica's Intelligent Data Management Cloud™ (IDMC) capabilities. -
Expanded global presence in
Saudi Arabia : announced plans to open an office in the Kingdom to align with the Saudi government’s vision for becoming a cloud-first, data-driven state ahead of the World Expo 2030. - Expanded partnership with Microsoft: announced Informatica's Data Quality Microsoft Fabric Native Application allowing Fabric customers to leverage AI-powered data profiling and data quality services to discover, cleanse, enrich and remediate data quality issues in Microsoft OneLake; announced public preview of IDMC as an Azure Native ISV Service within the Azure Management Console and Azure Marketplace; and announced availability of Cloud Data Access Management (CDAM) for Azure, a policy-based access management, providing a centralized control plane for both data governance and access.
- Expanded partnership with Snowflake: announced availability of Native SQL ELT support for 250+ Snowflake functions; announced Informatica’s GenAI blueprint for combining Snowflake’s Cortex AI service with IDMC services including Cloud Data Integration, Cloud Data Quality, Cloud Data Cataloging and Governance, Cloud Data Access Management, Master Data Management and Cloud Application Integration orchestration delivering a retrieval augmented generation (RAG) solution; launched Informatica's Enterprise Data Integrator (EDI) Snowflake Native Application leveraging Snowflake's Streamlit user interface and Snowpipe Streaming; and launched CDAM for Snowflake, a policy-based access management, providing a centralized control plane for both data governance and access.
- Expanded partnership with Databricks: announced IDMC platform verification for Unity Catalog to manage data lineage and governance; announced Informatica’s GenAI blueprint for Databricks DBRX customers to develop RAG-based GenAI applications; launched native SQL ELT capabilities to develop ELT pipelines for Databricks compute; and announced availability of Informatica’s Cloud Data Integration-free service (CDI-Free) offering via Databricks Partner Connect.
- Expanded partnership with Oracle: launched Cloud Data Governance and Catalog service natively on Oracle Cloud Infrastructure (OCI).
-
On June 11, 2024, the Company repriced its
$1.8 billion 2.75% to2.25% and eliminating the Credit Spread Adjustment related to the transfer from LIBOR to SOFR (Secured Overnight Financing Rate). This repricing will save approximately$11 million
Industry Recognition:
- Named the 2024 Data Integration Partner of the Year by Databricks at their annual Data + AI Summit.
- Named the 2024 Build with Partner of the Year by MongoDB at their annual .local NYC conference.
- Recognized by IDC as the Market Share Leader for both data integration and data intelligence markets (Worldwide Data Integration and Intelligence Software Market Shares, 2023, IDC #US51712324 June 2024).
- Named a Champion in the Bloor Research 2024 MarketUpdate reports for Data Fabric, Data Quality, and Test Data Management.
Upcoming Events:
-
On Monday, August 5, 2024, the Company is scheduled to host investor meetings at the KeyBanc Technology Leadership Forum in
Vail, CO. -
On Wednesday, August 28, 2024, the Company is scheduled to participate in a fireside chat discussion at the Deutsche Bank Technology Conference in
Dana Point, CA , at 11:00 a.m. Pacific Time. A live webcast and replay will be available on the Company's Investor Relations website. -
On Wednesday, September 4, 2024, the Company is scheduled to participate in a fireside chat discussion at the Citi Global TMT Conference in
New York, NY , at 1:20 p.m. Eastern Time. A live webcast and replay will be available on the Company's Investor Relations website. -
On Tuesday, September 10, 2024, the Company is scheduled to participate in a fireside chat discussion at the Goldman Sachs Communacopia & Technology Conference in
San Francisco, CA , at 2:25 p.m. Pacific Time. A live webcast and replay will be available on the Company's Investor Relations website. -
On Wednesday, September 11, 2024, the Company is scheduled to host investor meetings at the Wolfe Research TMT Conference in
San Francisco, CA.
Third Quarter and Full-Year 2024 Financial Outlook
The Company provides the financial guidance below based on current market conditions and expectations and it is subject to various important cautionary factors described below. Guidance includes the impact from macroeconomic conditions and expected foreign exchange headwinds versus the prior year comparable periods.
Based on information available as of July 30, 2024, guidance for the third quarter 2024 is as follows:
Third Quarter 2024 Ending September 30, 2024:
-
GAAP Total Revenues are expected to be in the range of
$412 million $428 million 2.8% year-over-year growth at the midpoint of the range. -
Subscription ARR is expected to be in the range of
$1.19 9 billion$1.21 9 billion12.2% year-over-year growth at the midpoint of the range. -
Cloud Subscription ARR is expected to be in the range of
$738 million $748 million 35.2% year-over-year growth at the midpoint of the range. -
Non-GAAP Operating Income is expected to be in the range of
$139 million $151 million 13.2% year-over-year growth at the midpoint of the range.
Based on information available as of July 30, 2024, guidance for the full-year 2024 is as follows:
Full-Year 2024 Ending December 31, 2024:
-
Updating GAAP Total Revenues from
$1.68 5 billion$1.70 5 billion$1.66 0 billion$1.68 0 billion4.7% year-over-year growth at the midpoint of the range. This reduction is driven primarily by three factors. First, as a direct result of our strategy to shift more of our customers’ implementation and support work to our professional service partners, we now expect professional service revenues will be lower. Second, due to the lower average duration of self-managed subscription renewals, we now expect lower upfront recognized self-managed subscription revenue per ASC 606 accounting standards. Third, due to the recent strengthening of theU.S. dollar against the Euro, Pound, and Yen, we now expect increased FX-related revenue headwinds of approximately$4 million -
Reaffirming Total ARR is expected to be in the range of
$1.71 8 billion$1.77 2 billion7.3% year-over-year growth at the midpoint of the range. -
Raising Subscription ARR from
$1.26 1 billion$1.29 5 billion$1.26 5 billion$1.29 9 billion13.2% year-over-year growth at the midpoint of the range. -
Raising Cloud Subscription ARR from
$826 million $840 million $829 million $843 million 35.5% year-over-year growth at the midpoint of the range. -
Raising Non-GAAP Operating Income from
$533 million $553 million $538 million $558 million 18.5% year-over-year growth at the midpoint of the range. -
Raising Adjusted Unlevered Free Cash Flow (after-tax) from
$535 million $555 million $545 million $565 million 23.0% year-over-year growth at the midpoint of the range.
The Company is assuming constant FX rates for the year based on the rates at the start of the planning period. For reference purposes, the assumed FX rates for our top four currencies in full-year 2024 are as follows:
Currency |
Planned Rate
|
Forecast Rate
|
||
EUR/$ |
1.10 |
1.07 |
||
GBP/$ |
1.27 |
1.26 |
||
$/CAD |
1.32 |
1.37 |
||
$/JPY |
141 |
161 |
Using the foreign exchange rate assumptions noted above, the Company has incorporated the following FX impacts into 2024 guidance:
|
Q3 2024 |
Full-Year 2024 |
|
Total Revenues |
|
|
|
Total ARR |
|
|
|
Subscription ARR |
|
|
|
Cloud Subscription ARR |
$— |
|
In addition to the above guidance, the Company is also providing third quarter 2024 Total ARR for modeling purposes. Total ARR is expected to be in the range of
In addition to the above guidance, the Company is also providing third quarter and full-year 2024 cash paid for interest estimates for modeling purposes. For the third quarter 2024, we estimate cash paid for interest to be approximately
In addition to the above guidance, the Company is also providing a third quarter and full-year 2024 weighted-average number of basic and diluted share estimates for modeling purposes. For the third quarter 2024, we expect basic weighted-average shares outstanding to be approximately 304 million shares and diluted weighted-average shares outstanding to be approximately 312 million shares. For the full-year 2024, we expect basic weighted-average shares outstanding to be approximately 302 million shares and diluted weighted-average shares outstanding to be approximately 313 million shares.
Reconciliation of Non-GAAP Operating Income and Adjusted Unlevered Free Cash Flow after-tax guidance to the most directly comparable GAAP measures is not available without unreasonable effort, as certain items cannot be reasonably predicted because of their high variability, complexity, and low visibility. In particular, the measures and effects of our stock-based compensation expense specific to our equity compensation awards and employer payroll tax-related items on employee stock transactions are directly impacted by the timing of employee stock transactions and unpredictable fluctuations in our stock price, which we expect to have a significant impact on our future GAAP financial results.
Webcast and Conference Call
A conference call to discuss Informatica’s second quarter 2024 financial results and financial outlook for the third quarter and full-year 2024 is scheduled for 2:00 p.m. Pacific Time today. To participate, please dial 1-833-470-1428 from the
Forward-Looking Statements
This press release and the related conference call and webcast contain forward-looking statements within the meaning of Section 27A of the Securities Act of 1933, as amended, and Section 21E of the Securities Exchange Act of 1934, as amended. These statements may relate to, but are not limited to, expectations of future operating results or financial performance, including our GAAP and non-GAAP guidance for the third quarter and 2024 fiscal year, the effect of foreign currency exchange rates, the effect of macroeconomic conditions, management’s plans, priorities, initiatives, and strategies, our efforts to reduce operating expenses and adjust cash flows in light of current business needs and priorities, our expected costs related to restructuring and related charges, including the timing of such charges, the impact of the restructuring and related charges on our business, results of operations and financial condition, plans regarding our stock repurchase authorization, management's estimates and expectations regarding growth of our business, the potential benefits realized by customers by the use of artificial intelligence and machine learning in our products and the potential benefits realized by customers from our cloud modernization programs, market, and partnerships. Forward-looking statements are inherently subject to risks and uncertainties, some of which cannot be predicted or quantified. In some cases, you can identify forward-looking statements because they contain words such as “anticipate,” “believe,” “contemplate,” “continue,” “could,” “estimate,” “expect,” “intend,” “may,” “plan,” “potential,” “predict,” “project,” “should,” “target,” “toward,” “will,” or “would,” or the negative of these words or other similar terms or expressions. You should not put undue reliance on any forward-looking statements. Forward-looking statements should not be read as a guarantee of future performance or results and will not necessarily be accurate indications of the times at, or by, which such performance or results will be achieved, if at all.
Forward-looking statements are based on information available at the time those statements are made and are based on current expectations, estimates, forecasts, and projections as well as the beliefs and assumptions of management as of that time with respect to future events. These statements are subject to risks and uncertainties, many of which involve factors or circumstances that are beyond our control, that could cause actual performance or results to differ materially from those expressed in or suggested by the forward-looking statements. In light of these risks and uncertainties, the forward-looking events and circumstances discussed in this press release and the related conference call and webcast may not occur and actual results could differ materially from those anticipated or implied in the forward-looking statements. These risks, uncertainties, assumptions, and other factors include, but are not limited to, those related to our business and financial performance, the effects of adverse global macroeconomic conditions and geopolitical uncertainty, the effects of public health crises on our business, results of operations, and financial condition, our ability to attract and retain customers, our ability to develop new products and services and enhance existing products and services, our ability to respond rapidly to emerging technology trends, our ability to execute on our business strategy, including our strategy related to the Informatica IDMC platform and key partnerships, our ability to increase and predict customer consumption of our platform, our ability to compete effectively, and our ability to manage growth.
Further information on these and additional risks, uncertainties, and other factors that could cause actual outcomes and results to differ materially from those included in or contemplated by the forward-looking statements contained in this press release and the related conference call and webcast are included under the caption “Risk Factors” and elsewhere in our Annual Report on Form 10-K that was filed for the fiscal year ended December 31, 2023, and other filings and reports we make with the Securities and Exchange Commission from time to time, including our Quarterly Report on Form 10-Q that will be filed for the second quarter ended June 30, 2024. All forward-looking statements contained herein are based on information available to us as of the date hereof and we do not assume any obligation to update these statements as a result of new information or future events.
Non-GAAP Financial Measures and Key Business Metrics
We review several operating and financial metrics, including the following unaudited non-GAAP financial measures and key business metrics to evaluate our business, measure our performance, identify trends affecting our business, formulate business plans, and make strategic decisions:
Non-GAAP Financial Measures
In addition to our results determined in accordance with
Non-GAAP Income from Operations and Non-GAAP Net Income exclude the effect of stock-based compensation expense-related charges, including employer payroll tax-related items on employee stock transactions starting Q2 2024, amortization of acquired intangibles, equity compensation related payments, expenses associated with acquisitions, sponsor-related costs and expenses associated with restructuring efforts, and are adjusted for income tax effects. We believe the presentation of operating results that exclude these non-cash or non-recurring items provides useful supplemental information to investors and facilitates the analysis of our operating results and comparison of operating results across reporting periods.
Adjusted EBITDA represents GAAP net income (loss) as adjusted for income tax benefit (expense), interest income, interest expense, debt refinancing costs, other income (expense) net, stock-based compensation-related charges, including employer payroll tax-related items on employee stock transactions starting Q2 2024, amortization of intangibles, restructuring, expenses associated with acquisitions, sponsor-related costs and depreciation. We believe adjusted EBITDA is an important metric for understanding our business to assess our relative profitability adjusted for balance sheet debt levels.
Adjusted Unlevered Free Cash Flow (after-tax) represents operating cash flow less purchases of property and equipment and is adjusted for interest payments, equity compensation payments, sponsor-related costs, expenses associated with acquisitions and restructuring costs (including payments for impaired leases). We believe this measure provides useful supplemental information to investors because it is an indicator of our liquidity over the long term needed to maintain and grow our core business operations. We also provide actual and forecast cash interest expense to aid in the calculation of adjusted free cash flow (after-tax).
Key Business Metrics
Annual Recurring Revenue ("ARR") represents the expected annual billing amounts from all active maintenance and subscription agreements. ARR is calculated based on the contract Monthly Recurring Revenue (MRR) multiplied by 12. MRR is calculated based on the accounting adjusted total contract value divided by the number of months of the agreement based on the start and end dates of each contracted line item. The aggregate ARR calculated at the end of each reported period represents the value of all contracts that are active as of the end of the period, including those contracts that have expired but are still under negotiation for renewal. We typically allow for a grace period of up to 6 months past the original contract expiration quarter during which we engage in the renewal process before we report the contract as lost/inactive. This grace-period ARR amount has been less than
Cloud Subscription Annual Recurring Revenue ("Cloud Subscription ARR") represents the portion of ARR that is attributable to our hosted cloud contracts. We believe that Cloud Subscription ARR is a helpful metric for understanding our business since it represents the approximate annualized cash value collected over a 12-month period for all of our recurring Cloud contracts. Cloud Subscription ARR is a subset of our overall Subscription ARR, and by providing this breakdown of Cloud Subscription ARR, it provides visibility on the size and growth rate of our Cloud Subscription ARR within our overall Subscription ARR. Cloud Subscription ARR should be viewed independently of subscription revenue and deferred revenue related to our subscription contracts and is not intended to be combined with or to replace either of those items.
Subscription Annual Recurring Revenue ("Subscription ARR") represents the portion of ARR only attributable to our subscription contracts. Subscription ARR includes Cloud Subscription ARR and self-managed Subscription Annual Recurring Revenue. We believe that Subscription ARR is a helpful metric for understanding our business since it represents the approximate annualized cash value collected over a 12-month period for all of our recurring subscription contracts. Subscription ARR excludes maintenance contracts on our perpetual licenses. Subscription ARR should be viewed independently of subscription revenue and deferred revenue related to our subscription contracts and is not intended to be combined with or to replace either of those items.
Maintenance Annual Recurring Revenue ("Maintenance ARR") represents the portion of ARR only attributable to our maintenance contracts. We believe that Maintenance ARR is a helpful metric for understanding our business since it represents the approximate annualized cash value collected over a 12-month period for all our maintenance contracts. Maintenance ARR includes maintenance contracts supporting our perpetual licenses. Maintenance ARR should be viewed independently of maintenance revenue and deferred revenue related to our maintenance contracts and is not intended to be combined with or to replace either of those items. As we continue to shift our focus from perpetual to cloud, we expect Maintenance ARR will decrease in future quarters.
Cloud Subscription Net Retention Rate ("Cloud Subscription NRR") compares the contract value for Cloud Subscription ARR from the same set of customers at the end of a period compared to the prior year. We treat divisions, segments or subsidiaries inside companies with us as separate customers when defining the End-user level. We treat divisions, segments, or subsidiaries of a company as one customer when defining the Global Parent level. Global Parent customers are determined using Dun & Bradstreet GDUNS identifiers. To calculate our Cloud Subscription NRR for a particular period, we first establish the Cloud Subscription ARR value at the end of the prior year period. We subsequently measure the Cloud Subscription ARR value at the end of the current period from the same cohort of customers. Cloud Subscription NRR is then calculated by dividing the aggregate Cloud Subscription ARR in the current period by the prior year period. An increase in the Cloud Subscription NRR occurs as a result of price increases on existing contracts, higher consumption of existing products, and sales of additional new subscription products to existing customers exceeding losses from subscription contracts due to price decreases, usage decreases and cancellations. We believe Cloud Subscription NRR is an important metric for understanding our business since it measures the rate at which we are able to sell additional products into our cloud subscription customer base.
Subscription Net Retention Rate ("Subscription Net Retention" NRR) compares the contract value for Subscription ARR from the same set of customers at the end of a period compared to the prior year. We treat divisions, segments, or subsidiaries inside companies as separate customers when defining the End-user level. To calculate our Subscription NRR for a particular period, we first establish the Subscription ARR value at the end of the prior-year period. We subsequently measure the Subscription ARR value at the end of the current period from the same cohort of customers. The net retention rate is then calculated by dividing the aggregate Subscription ARR in the current period by the prior-year period. An increase in the Subscription NRR occurs as a result of price increases on existing contracts, higher consumption of existing products, and sales of additional new subscription products to existing customers exceeding losses from subscription contracts due to price decreases, usage decreases and cancellations. Our Cloud Subscription NRR continues to outpace total Subscription NRR as self-managed subscription customers are moving to cloud offerings which is net neutral to Subscription NRR but will be additive to Cloud Subscription NRR for the same cohort of customers.
Supplemental Information
Subscription revenue disaggregation:
- Cloud subscription revenue represents revenues from cloud subscription offerings, which deliver applications and infrastructure technologies via cloud-based deployment models for which we develop functionality, provide unspecified updates and enhancements, host, manage, upgrade, and support, and that customers access by entering into a subscription agreement with us for a stated period.
- Self-managed subscription license revenue represents revenues from customers and partners contracted to use our self-managed software during a subscription term.
- Self-managed subscription support and other revenue represents revenues generated primarily through the sale of license support contracts sold together with the self-managed subscription license purchased by the customer. Self-managed subscription license support contracts provide customers with rights to unspecified software product upgrades, maintenance releases and patches released during the term of the support period and include internet access to technical content, as well as internet and telephone access to technical support personnel.
About Informatica
Informatica (NYSE: INFA), a leader in enterprise AI-powered cloud data management, brings data and AI to life by empowering businesses to realize the transformative power of their most critical assets. We have created a new category of software, the Informatica Intelligent Data Management Cloud™ (IDMC). IDMC is an end-to-end data management platform, powered by CLAIRE AI, that connects, manages and unifies data across any multi-cloud or hybrid system, democratizing data and enabling enterprises to modernize and advance their business strategies. Customers in approximately 100 countries, including more than 80 of the Fortune 100, rely on Informatica to drive data-led digital transformation. Informatica. Where data and AI come to life.
INFORMATICA INC. |
|||||||||||||||
CONSOLIDATED STATEMENTS OF OPERATIONS |
|||||||||||||||
(in thousands, except per share data) |
|||||||||||||||
(unaudited) |
|||||||||||||||
|
|||||||||||||||
|
Three Months Ended June 30, |
Six Months Ended June 30, |
|||||||||||||
|
2024 |
2023 |
2024 |
2023 |
|||||||||||
|
|
|
|
|
|||||||||||
Revenues: |
|
|
|
|
|||||||||||
Subscriptions |
$ |
264,306 |
|
$ |
227,589 |
|
$ |
516,283 |
|
$ |
441,511 |
|
|||
Perpetual license |
|
— |
|
|
13 |
|
|
21 |
|
|
819 |
|
|||
Software revenue |
|
264,306 |
|
|
227,602 |
|
|
516,304 |
|
|
442,330 |
|
|||
Maintenance and professional services |
|
136,319 |
|
|
148,386 |
|
|
272,928 |
|
|
299,089 |
|
|||
Total revenues |
|
400,625 |
|
|
375,988 |
|
|
789,232 |
|
|
741,419 |
|
|||
Cost of revenues: |
|
|
|
|
|||||||||||
Subscriptions |
|
47,367 |
|
|
38,626 |
|
|
94,205 |
|
|
74,310 |
|
|||
Perpetual license |
|
— |
|
|
213 |
|
|
5 |
|
|
393 |
|
|||
Software costs |
|
47,367 |
|
|
38,839 |
|
|
94,210 |
|
|
74,703 |
|
|||
Maintenance and professional services |
|
34,501 |
|
|
43,864 |
|
|
68,379 |
|
|
87,023 |
|
|||
Amortization of acquired technology |
|
1,027 |
|
|
2,889 |
|
|
2,061 |
|
|
5,763 |
|
|||
Total cost of revenues |
|
82,895 |
|
|
85,592 |
|
|
164,650 |
|
|
167,489 |
|
|||
Gross profit |
|
317,730 |
|
|
290,396 |
|
|
624,582 |
|
|
573,930 |
|
|||
Operating expenses: |
|
|
|
|
|||||||||||
Research and development |
|
79,234 |
|
|
87,707 |
|
|
158,888 |
|
|
169,746 |
|
|||
Sales and marketing |
|
147,453 |
|
|
134,500 |
|
|
284,886 |
|
|
263,038 |
|
|||
General and administrative |
|
48,962 |
|
|
38,756 |
|
|
99,408 |
|
|
80,116 |
|
|||
Amortization of intangible assets |
|
31,718 |
|
|
34,348 |
|
|
63,457 |
|
|
68,639 |
|
|||
Restructuring |
|
899 |
|
|
471 |
|
|
5,254 |
|
|
27,724 |
|
|||
Total operating expenses |
|
308,266 |
|
|
295,782 |
|
|
611,893 |
|
|
609,263 |
|
|||
Income (loss) from operations |
|
9,464 |
|
|
(5,386 |
) |
|
12,689 |
|
|
(35,333 |
) |
|||
Interest income |
|
13,765 |
|
|
9,920 |
|
|
27,172 |
|
|
17,503 |
|
|||
Interest expense |
|
(38,333 |
) |
|
(37,466 |
) |
|
(77,430 |
) |
|
(72,517 |
) |
|||
Other income, net |
|
851 |
|
|
2,531 |
|
|
7,186 |
|
|
3,161 |
|
|||
Loss before income taxes |
|
(14,253 |
) |
|
(30,401 |
) |
|
(30,383 |
) |
|
(87,186 |
) |
|||
Income tax (benefit) expense |
|
(19,081 |
) |
|
122,065 |
|
|
(44,545 |
) |
|
181,634 |
|
|||
Net income (loss) |
$ |
4,828 |
|
$ |
(152,466 |
) |
$ |
14,162 |
|
$ |
(268,820 |
) |
|||
Net income (loss) per share attributable to Class A and Class B-1 common stockholders: |
|
|
|
|
|||||||||||
Basic |
$ |
0.02 |
|
$ |
(0.53 |
) |
$ |
0.05 |
|
$ |
(0.94 |
) |
|||
Diluted |
$ |
0.02 |
|
$ |
(0.53 |
) |
$ |
0.05 |
|
$ |
(0.94 |
) |
|||
Weighted-average shares used in computing net income (loss) per share: |
|
|
|
|
|||||||||||
Basic |
|
300,930 |
|
|
287,109 |
|
|
298,913 |
|
|
286,004 |
|
|||
Diluted |
|
314,934 |
|
|
287,109 |
|
|
313,716 |
|
|
286,004 |
|
|||
INFORMATICA INC. |
|||||||
CONSOLIDATED BALANCE SHEETS |
|||||||
(in thousands, except par value data) |
|||||||
(Unaudited) |
|||||||
|
|||||||
|
June 30, |
December 31, |
|||||
|
2024 |
2023 |
|||||
Assets |
|
|
|||||
Current assets: |
|
|
|||||
Cash and cash equivalents |
$ |
798,465 |
|
$ |
732,443 |
|
|
Short-term investments |
|
330,072 |
|
|
259,828 |
|
|
Accounts receivable, net of allowances of |
|
318,739 |
|
|
500,068 |
|
|
Contract assets, net |
|
83,172 |
|
|
79,864 |
|
|
Prepaid expenses and other current assets |
|
252,689 |
|
|
180,383 |
|
|
Total current assets |
|
1,783,137 |
|
|
1,752,586 |
|
|
Property and equipment, net |
|
144,137 |
|
|
149,266 |
|
|
Operating lease right-of-use-assets |
|
51,351 |
|
|
57,799 |
|
|
Goodwill |
|
2,345,753 |
|
|
2,361,643 |
|
|
Customer relationships intangible asset, net |
|
609,927 |
|
|
669,781 |
|
|
Other intangible assets, net |
|
8,830 |
|
|
17,393 |
|
|
Deferred tax assets |
|
15,415 |
|
|
15,237 |
|
|
Other assets |
|
163,255 |
|
|
178,377 |
|
|
Total assets |
$ |
5,121,805 |
|
$ |
5,202,082 |
|
|
Liabilities and Stockholders’ Equity |
|
|
|||||
Current liabilities: |
|
|
|||||
Accounts payable |
$ |
20,506 |
|
$ |
18,050 |
|
|
Accrued liabilities |
|
43,863 |
|
|
61,194 |
|
|
Accrued compensation and related expenses |
|
94,317 |
|
|
167,427 |
|
|
Current operating lease liabilities |
|
14,834 |
|
|
16,411 |
|
|
Current portion of long-term debt |
|
18,750 |
|
|
18,750 |
|
|
Income taxes payable |
|
869 |
|
|
4,305 |
|
|
Deferred revenue |
|
685,734 |
|
|
767,244 |
|
|
Total current liabilities |
|
878,873 |
|
|
1,053,381 |
|
|
Long-term operating lease liabilities |
|
39,932 |
|
|
46,003 |
|
|
Long-term deferred revenue |
|
11,805 |
|
|
19,482 |
|
|
Long-term debt, net |
|
1,798,140 |
|
|
1,805,960 |
|
|
Deferred tax liabilities |
|
20,728 |
|
|
22,425 |
|
|
Long-term income taxes payable |
|
40,110 |
|
|
37,679 |
|
|
Other liabilities |
|
6,401 |
|
|
4,554 |
|
|
Total liabilities |
|
2,795,989 |
|
|
2,989,484 |
|
|
Stockholders’ equity: |
|
|
|||||
Class A common stock; |
|
2,589 |
|
|
2,510 |
|
|
Class B-1 common stock; |
|
440 |
|
|
440 |
|
|
Class B-2 common stock; |
|
— |
|
|
— |
|
|
Additional paid-in-capital |
|
3,664,821 |
|
|
3,540,502 |
|
|
Accumulated other comprehensive loss |
|
(47,700 |
) |
|
(22,370 |
) |
|
Accumulated deficit |
|
(1,294,334 |
) |
|
(1,308,484 |
) |
|
Total stockholders’ equity |
|
2,325,816 |
|
|
2,212,598 |
|
|
Total liabilities and stockholders’ equity |
$ |
5,121,805 |
|
$ |
5,202,082 |
|
|
INFORMATICA INC. |
|||||||||||||||
CONSOLIDATED STATEMENTS OF CASH FLOWS |
|||||||||||||||
(in thousands) |
|||||||||||||||
(unaudited) |
|||||||||||||||
|
|||||||||||||||
|
Three Months Ended June 30, |
Six Months Ended June 30, |
|||||||||||||
|
2024 |
2023 |
2024 |
2023 |
|||||||||||
|
|
|
|
|
|||||||||||
Operating activities: |
|
|
|
|
|||||||||||
Net income (loss) |
$ |
4,828 |
|
$ |
(152,466 |
) |
$ |
14,162 |
|
$ |
(268,820 |
) |
|||
Adjustments to reconcile net income (loss) to net cash provided by operating activities: |
|
|
|
|
|||||||||||
Depreciation and amortization |
|
3,873 |
|
|
4,273 |
|
|
6,066 |
|
|
8,471 |
|
|||
Non-cash operating lease costs |
|
3,433 |
|
|
3,674 |
|
|
7,335 |
|
|
9,024 |
|
|||
Stock-based compensation |
|
65,499 |
|
|
55,208 |
|
|
129,600 |
|
|
105,550 |
|
|||
Deferred income taxes |
|
(745 |
) |
|
(7,479 |
) |
|
(1,576 |
) |
|
3,998 |
|
|||
Amortization of intangible assets and acquired technology |
|
32,745 |
|
|
37,237 |
|
|
65,518 |
|
|
74,402 |
|
|||
Amortization of debt issuance costs |
|
903 |
|
|
857 |
|
|
1,790 |
|
|
1,704 |
|
|||
Amortization of investment discount, net of premium |
|
(1,408 |
) |
|
(900 |
) |
|
(2,848 |
) |
|
(1,751 |
) |
|||
Debt refinancing costs |
|
1,366 |
|
|
— |
|
|
1,366 |
|
|
— |
|
|||
Changes in operating assets and liabilities: |
|
|
|
|
|||||||||||
Accounts receivable |
|
(44,290 |
) |
|
(38,332 |
) |
|
176,418 |
|
|
159,247 |
|
|||
Prepaid expenses and other assets |
|
8,430 |
|
|
16,098 |
|
|
8,197 |
|
|
27,081 |
|
|||
Accounts payable and accrued liabilities |
|
5,001 |
|
|
14,749 |
|
|
(92,022 |
) |
|
(103,327 |
) |
|||
Income taxes payable |
|
(31,305 |
) |
|
106,566 |
|
|
(74,812 |
) |
|
128,750 |
|
|||
Deferred revenue |
|
(23,478 |
) |
|
(2,780 |
) |
|
(82,700 |
) |
|
(37,742 |
) |
|||
Net cash provided by operating activities |
|
24,852 |
|
|
36,705 |
|
|
156,494 |
|
|
106,587 |
|
|||
Investing activities: |
|
|
|
|
|||||||||||
Purchases of property and equipment |
|
(1,175 |
) |
|
(1,891 |
) |
|
(1,565 |
) |
|
(3,115 |
) |
|||
Purchases of investments |
|
(122,558 |
) |
|
(117,628 |
) |
|
(269,555 |
) |
|
(147,925 |
) |
|||
Maturities of investments |
|
52,093 |
|
|
71,200 |
|
|
202,032 |
|
|
151,700 |
|
|||
Sales of investments |
|
— |
|
|
23,798 |
|
|
— |
|
|
23,798 |
|
|||
Other |
|
— |
|
|
— |
|
|
1,878 |
|
|
— |
|
|||
Net cash (used in) provided by investing activities |
|
(71,640 |
) |
|
(24,521 |
) |
|
(67,210 |
) |
|
24,458 |
|
|||
Financing activities: |
|
|
|
|
|||||||||||
Payment of debt |
|
(6,659 |
) |
|
(4,688 |
) |
|
(11,347 |
) |
|
(9,376 |
) |
|||
Payment of debt refinancing costs |
|
(1,349 |
) |
|
— |
|
|
(1,349 |
) |
|
— |
|
|||
Proceeds from issuance of debt |
|
1,971 |
|
|
— |
|
|
1,971 |
|
|
— |
|
|||
Proceeds from issuance of common stock under employee stock purchase plan |
|
— |
|
|
— |
|
|
13,797 |
|
|
16,131 |
|
|||
Payments for dividends related to Class B-2 shares |
|
— |
|
|
— |
|
|
(12 |
) |
|
(12 |
) |
|||
Payments for taxes related to net share settlement of equity awards |
|
(30,848 |
) |
|
(11,100 |
) |
|
(76,691 |
) |
|
(11,100 |
) |
|||
Proceeds from issuance of shares under equity plans |
|
28,860 |
|
|
4,172 |
|
|
57,721 |
|
|
7,653 |
|
|||
Net cash (used in) provided by financing activities |
|
(8,025 |
) |
|
(11,616 |
) |
|
(15,910 |
) |
|
3,296 |
|
|||
Effect of foreign exchange rate changes on cash and cash equivalents |
|
(1,790 |
) |
|
(672 |
) |
|
(7,352 |
) |
|
583 |
|
|||
Net increase in cash and cash equivalents |
|
(56,603 |
) |
|
(104 |
) |
|
66,022 |
|
|
134,924 |
|
|||
Cash and cash equivalents at beginning of period |
|
855,068 |
|
|
632,907 |
|
|
732,443 |
|
|
497,879 |
|
|||
Cash and cash equivalents at end of period |
$ |
798,465 |
|
$ |
632,803 |
|
$ |
798,465 |
|
$ |
632,803 |
|
|||
Supplemental disclosures: |
|
|
|
|
|||||||||||
Cash paid for interest |
$ |
37,922 |
|
$ |
36,580 |
|
$ |
75,704 |
|
$ |
71,062 |
|
|||
Cash paid for income taxes, net of refunds |
$ |
12,970 |
|
$ |
22,979 |
|
$ |
31,843 |
|
$ |
48,886 |
|
|||
INFORMATICA INC. |
|||||||||||||||
NON-GAAP FINANCIAL MEASURES AND KEY BUSINESS METRICS |
|||||||||||||||
(in thousands, except per share data) |
|||||||||||||||
(unaudited) |
|||||||||||||||
|
|||||||||||||||
RECONCILIATIONS OF GAAP TO NON-GAAP |
|||||||||||||||
Reconciliation of GAAP net income (loss) to Non-GAAP net income |
|||||||||||||||
|
|||||||||||||||
|
Three Months Ended June 30, |
Six Months Ended June 30, |
|||||||||||||
|
2024 |
2023 |
2024 |
2023 |
|||||||||||
|
(in thousands) |
(in thousands) |
|||||||||||||
GAAP net income (loss) |
$ |
4,828 |
|
$ |
(152,466 |
) |
$ |
14,162 |
|
$ |
(268,820 |
) |
|||
Stock-based compensation-related charges (1) |
|
68,576 |
|
|
55,208 |
|
|
132,677 |
|
|
105,550 |
|
|||
Amortization of intangibles |
|
32,745 |
|
|
37,237 |
|
|
65,518 |
|
|
74,402 |
|
|||
Restructuring |
|
899 |
|
|
471 |
|
|
5,254 |
|
|
27,724 |
|
|||
Debt refinancing costs |
|
1,366 |
|
|
— |
|
|
1,366 |
|
|
— |
|
|||
Acquisition-related costs |
|
2,403 |
|
|
— |
|
|
7,205 |
|
|
— |
|
|||
Sponsor-related costs |
|
773 |
|
|
— |
|
|
773 |
|
|
— |
|
|||
Income tax effect |
|
(40,358 |
) |
|
107,687 |
|
|
(86,499 |
) |
|
153,922 |
|
|||
Non-GAAP net income |
$ |
71,232 |
|
$ |
48,137 |
|
$ |
140,456 |
|
$ |
92,778 |
|
|||
|
|
|
|
|
|||||||||||
Net income (loss) per share: |
|
|
|
|
|||||||||||
Net income (loss) per share—basic |
$ |
0.02 |
|
$ |
(0.53 |
) |
$ |
0.05 |
|
$ |
(0.94 |
) |
|||
Net income (loss) per share—diluted |
$ |
0.02 |
|
$ |
(0.53 |
) |
$ |
0.05 |
|
$ |
(0.94 |
) |
|||
Non-GAAP net income per share—basic |
$ |
0.24 |
|
$ |
0.17 |
|
$ |
0.47 |
|
$ |
0.32 |
|
|||
Non-GAAP net income per share—diluted |
$ |
0.23 |
|
$ |
0.17 |
|
$ |
0.45 |
|
$ |
0.32 |
|
|||
|
|
|
|
|
|||||||||||
Share count (in thousands): |
|
|
|
|
|||||||||||
Weighted-average shares used in computing net income (loss) per share—basic |
|
300,930 |
|
|
287,109 |
|
|
298,913 |
|
|
286,004 |
|
|||
Weighted-average shares used in computing net income (loss) per share—diluted |
|
314,934 |
|
|
287,109 |
|
|
313,716 |
|
|
286,004 |
|
|||
Weighted-average shares used in computing Non-GAAP net income per share—basic |
|
300,930 |
|
|
287,109 |
|
|
298,913 |
|
|
286,004 |
|
|||
Weighted-average shares used in computing Non-GAAP net income per share—diluted |
|
314,934 |
|
|
290,980 |
|
|
313,716 |
|
|
289,812 |
|
|||
|
|||||||||||||||
(1) Beginning with the second quarter of 2024, the Company adjusted for employer payroll tax-related items on employee stock transactions in certain non-GAAP metrics. The stock-based compensation related employer tax-related expense for comparative periods were immaterial and are not reflected in the balances above. |
|||||||||||||||
Reconciliation of GAAP income (loss) from operations to Non-GAAP income from operations |
|||||||||||||||
|
|||||||||||||||
|
Three Months Ended June 30, |
Six Months Ended June 30, |
|||||||||||||
|
2024 |
2023 |
2024 |
2023 |
|||||||||||
|
(in thousands) |
(in thousands) |
|||||||||||||
GAAP income (loss) from operations |
$ |
9,464 |
|
$ |
(5,386 |
) |
$ |
12,689 |
|
$ |
(35,333 |
) |
|||
Stock-based compensation-related charges |
|
68,576 |
|
|
55,208 |
|
|
132,677 |
|
|
105,550 |
|
|||
Amortization of intangibles |
|
32,745 |
|
|
37,237 |
|
|
65,518 |
|
|
74,402 |
|
|||
Restructuring |
|
899 |
|
|
471 |
|
|
5,254 |
|
|
27,724 |
|
|||
Acquisition-related costs |
|
2,403 |
|
|
— |
|
|
7,205 |
|
|
— |
|
|||
Sponsor-related costs |
|
773 |
|
|
— |
|
|
773 |
|
|
— |
|
|||
Non-GAAP income from operations |
$ |
114,860 |
|
$ |
87,530 |
|
$ |
224,116 |
|
$ |
172,343 |
|
|||
|
|||||||||||||||
Non-GAAP operating margin (% of total revenue) |
28.7 |
% |
23.3 |
% |
28.4 |
% |
23.2 |
% |
|||||||
INFORMATICA INC. |
|||||||||||||||||||
NON-GAAP FINANCIAL MEASURES AND KEY BUSINESS METRICS |
|||||||||||||||||||
|
|||||||||||||||||||
Adjusted EBITDA Reconciliation |
|||||||||||||||||||
|
|||||||||||||||||||
|
Three Months Ended June 30, |
Six Months Ended June 30, |
Trailing Twelve Months ("TTM") Ended June 30, |
||||||||||||||||
|
2024 |
2023 |
2024 |
2023 |
2024 |
||||||||||||||
|
(in thousands) |
(in thousands) |
(in thousands) |
||||||||||||||||
GAAP net income (loss) |
$ |
4,828 |
|
$ |
(152,466 |
) |
$ |
14,162 |
|
$ |
(268,820 |
) |
$ |
157,699 |
|
||||
Income tax (benefit) expense |
|
(19,081 |
) |
|
122,065 |
|
|
(44,545 |
) |
|
181,634 |
|
|
(178,068 |
) |
||||
Interest income |
|
(13,765 |
) |
|
(9,920 |
) |
|
(27,172 |
) |
|
(17,503 |
) |
|
(49,355 |
) |
||||
Interest expense |
|
38,333 |
|
|
37,466 |
|
|
77,430 |
|
|
72,517 |
|
|
156,309 |
|
||||
Debt refinancing costs |
|
1,366 |
|
|
— |
|
|
1,366 |
|
|
— |
|
|
1,366 |
|
||||
Other income, net |
|
(2,217 |
) |
|
(2,531 |
) |
|
(8,552 |
) |
|
(3,161 |
) |
|
(6,366 |
) |
||||
Stock-based compensation-related charges |
|
68,576 |
|
|
55,208 |
|
|
132,677 |
|
|
105,550 |
|
|
245,226 |
|
||||
Amortization of intangibles |
|
32,745 |
|
|
37,237 |
|
|
65,518 |
|
|
74,402 |
|
|
140,396 |
|
||||
Restructuring |
|
899 |
|
|
471 |
|
|
5,254 |
|
|
27,724 |
|
|
37,285 |
|
||||
Acquisition-related costs |
|
2,403 |
|
|
— |
|
|
7,205 |
|
|
— |
|
|
8,789 |
|
||||
Sponsor-related costs |
|
773 |
|
|
— |
|
|
773 |
|
|
— |
|
|
773 |
|
||||
Depreciation |
|
3,853 |
|
|
4,208 |
|
|
6,071 |
|
|
8,408 |
|
|
14,746 |
|
||||
Adjusted EBITDA |
$ |
118,713 |
|
$ |
91,738 |
|
$ |
230,187 |
|
$ |
180,751 |
|
$ |
528,800 |
|
||||
Adjusted Unlevered Free Cash Flow |
|||||||||||||||
|
|||||||||||||||
|
Three Months Ended June 30, |
Six Months Ended June 30, |
|||||||||||||
|
2024 |
2023 |
2024 |
2023 |
|||||||||||
|
(in thousands, except percentages) |
(in thousands, except percentages) |
|||||||||||||
Total GAAP Revenue |
$ |
400,625 |
|
$ |
375,988 |
|
$ |
789,232 |
|
$ |
741,419 |
|
|||
Net cash provided by operating activities |
$ |
24,852 |
|
$ |
36,705 |
|
$ |
156,494 |
|
$ |
106,587 |
|
|||
Less: Purchases of property, plant, and equipment |
|
(1,175 |
) |
|
(1,891 |
) |
|
(1,565 |
) |
|
(3,115 |
) |
|||
Add: Equity compensation payments |
|
— |
|
|
53 |
|
|
— |
|
|
121 |
|
|||
Add: Restructuring costs |
|
2,527 |
|
|
5,476 |
|
|
16,473 |
|
|
25,620 |
|
|||
Add: Acquisition related costs |
|
6,682 |
|
|
— |
|
|
6,682 |
|
|
— |
|
|||
Add: Sponsor-related costs |
|
429 |
|
|
— |
|
|
429 |
|
|
— |
|
|||
Adjusted Free Cash Flow (after-tax)(1) |
$ |
33,315 |
|
$ |
40,343 |
|
$ |
178,513 |
|
$ |
129,213 |
|
|||
Add: Cash paid for interest |
|
37,922 |
|
|
36,580 |
|
|
75,704 |
|
|
71,062 |
|
|||
Adjusted Unlevered Free Cash Flow (after-tax)(1) |
$ |
71,237 |
|
$ |
76,923 |
|
$ |
254,217 |
|
$ |
200,275 |
|
|||
|
|
|
|
|
|||||||||||
Adjusted Free Cash Flow (after-tax) margin(1) |
|
8 |
% |
|
11 |
% |
|
23 |
% |
|
17 |
% |
|||
Adjusted Unlevered Free Cash Flow (after-tax) margin(1) |
|
18 |
% |
|
20 |
% |
|
32 |
% |
|
27 |
% |
|||
|
|||||||||||||||
(1) Includes cash tax payments of |
|||||||||||||||
Key Business Metrics |
|||||||
|
|||||||
|
June 30, |
||||||
|
2024 |
2023 |
|||||
|
(in thousands, except percentages) |
||||||
Cloud Subscription Annual Recurring Revenue |
$ |
702,600 |
|
$ |
512,615 |
|
|
Self-managed Subscription Annual Recurring Revenue |
|
493,935 |
|
|
529,723 |
|
|
Subscription Annual Recurring Revenue |
|
1,196,535 |
|
|
1,042,338 |
|
|
Maintenance Annual Recurring Revenue on Perpetual Licenses |
|
471,697 |
|
|
505,186 |
|
|
Total Annual Recurring Revenue |
$ |
1,668,232 |
|
$ |
1,547,524 |
|
|
|
|
|
|||||
Subscription Net Retention Rate (End-user level) |
|
106 |
% |
|
107 |
% |
|
Cloud Subscription Net Retention Rate (End-user level) |
|
119 |
% |
|
116 |
% |
|
Cloud Subscription Net Retention Rate (Global Parent level) |
|
126 |
% |
|
122 |
% |
|
INFORMATICA INC. |
|||||
SUPPLEMENTAL INFORMATION |
|||||
|
|||||
Additional Business Metrics |
|||||
|
|||||
|
June 30, |
||||
|
2024 |
2023 |
|||
Maintenance Renewal Rate |
96 |
% |
94 |
% |
|
Subscription Renewal Rate |
90 |
% |
92 |
% |
|
Customers that spend more than |
272 |
|
213 |
|
|
Customers that spend more than |
2,038 |
|
1,940 |
|
|
Cloud transactions processed per month in trillions(3) |
96.6 |
|
60.7 |
|
|
|
|||||
(1) Total number of customers that spend more than |
|||||
(2) Total number of customers that spend more than |
|||||
(3) Total number of cloud transactions processed on our platform per month in trillions, which measures data processed. |
|||||
Disaggregation of Subscription Revenues |
|||||||||||
|
|||||||||||
|
Three Months Ended June 30, |
Six Months Ended June 30, |
|||||||||
|
2024 |
2023 |
2024 |
2023 |
|||||||
|
(in thousands) |
(in thousands) |
|||||||||
Revenues: |
|
|
|
|
|||||||
Cloud subscription |
$ |
161,422 |
$ |
119,244 |
$ |
312,860 |
$ |
231,022 |
|||
Self-managed subscription license |
|
53,976 |
|
56,878 |
|
105,924 |
|
107,427 |
|||
Self-managed subscription support and other |
|
48,908 |
|
51,467 |
|
97,499 |
|
103,062 |
|||
Subscription revenues |
$ |
264,306 |
$ |
227,589 |
$ |
516,283 |
$ |
441,511 |
|||
Net Debt Reconciliation |
|||||||
|
|||||||
|
June 30, |
December 31 |
|||||
|
2024 |
2023 |
|||||
|
(in millions) |
||||||
Dollar Term Loan |
$ |
1,833 |
|
$ |
1,842 |
|
|
Less: Cash, cash equivalents, and short-term investments |
|
(1,129 |
) |
|
(992 |
) |
|
Total net debt |
$ |
704 |
|
$ |
850 |
|
|
View source version on businesswire.com: https://www.businesswire.com/news/home/20240730917230/en/
Investor Relations:
Victoria Hyde-Dunn
vhydedunn@informatica.com
Public Relations:
prteam@informatica.com
Source: Informatica