TRX Gold Reports First Quarter 2025 Results
TRX Gold reported Q1 2025 results with significant operational achievements. The company poured 4,841 ounces of gold, generating revenue of $12.5 million (up from $9.4M in Q1 2024) and gross profit of $4.8 million (up from $3.7M). The increase was mainly due to record average realized gold price of $2,653 per ounce.
Processing costs decreased significantly to $12.60 per tonne (down from $26.56) following the expansion to 2,000 tonnes per day capacity. Total ore processed reached 1,703 tpd, a 108% increase from Q1 2024. Mining costs also improved to $4.00 per tonne (from $4.25).
The company announced its best drill results ever at the Stamford Bridge Zone, intersecting 37 meters @ 6.86 g/t Au and 35.5m @ 5.48 g/t Au. This new gold mineralization zone is located 250m east of the Buckreef Gold Main Zone.
TRX Gold ha riportato i risultati del primo trimestre 2025 con importanti traguardi operativi. L'azienda ha estratto 4.841 once d'oro, generando un fatturato di 12,5 milioni di dollari (rispetto a 9,4 milioni nel primo trimestre 2024) e un utile lordo di 4,8 milioni di dollari (rispetto a 3,7 milioni). L'aumento è stato principalmente dovuto al prezzo medio realizzato dell'oro, record, di 2.653 dollari per oncia.
I costi di lavorazione sono diminuiti significativamente a 12,60 dollari per tonnellata (rispetto a 26,56) a seguito dell'espansione a una capacità di 2.000 tonnellate al giorno. La quantità totale di minerale lavorato ha raggiunto 1.703 tpd, con un incremento del 108% rispetto al primo trimestre 2024. Anche i costi minerari sono migliorati, scendendo a 4,00 dollari per tonnellata (da 4,25).
L'azienda ha annunciato i migliori risultati di perforazione mai ottenuti nella zona di Stamford Bridge, con intersezioni di 37 metri @ 6,86 g/t Au e 35,5m @ 5,48 g/t Au. Questa nuova zona di mineralizzazione d'oro si trova a 250 metri a est della zona principale di Buckreef Gold.
TRX Gold reportó resultados del primer trimestre de 2025 con logros operacionales significativos. La compañía extrajo 4,841 onzas de oro, generando ingresos de 12.5 millones de dólares (en comparación con 9.4 millones en el primer trimestre de 2024) y una ganancia bruta de 4.8 millones de dólares (frente a 3.7 millones). El aumento se debió principalmente al precio promedio de oro realizado, un récord, de 2,653 dólares por onza.
Los costos de procesamiento disminuyeron significativamente a 12.60 dólares por tonelada (en vez de 26.56) tras la expansión a una capacidad de 2,000 toneladas por día. El total de mineral procesado alcanzó 1,703 tpd, un aumento del 108% respecto al primer trimestre de 2024. Los costos de minería también mejoraron a 4.00 dólares por tonelada (de 4.25).
La compañía anunció sus mejores resultados de perforación de la historia en la zona de Stamford Bridge, intersectando 37 metros @ 6.86 g/t Au y 35.5m @ 5.48 g/t Au. Esta nueva zona de mineralización de oro se encuentra a 250 metros al este de la zona principal de Buckreef Gold.
TRX Gold는 2025년 1분기 결과를 보고하며 중요한 운영 성과를 발표했습니다. 이 회사는 4,841 온스의 금을 채굴하여 1,250만 달러의 수익을 창출했습니다(2024년 1분기 940만 달러에서 증가)와 함께 480만 달러의 총 이익을 기록했습니다(370만 달러에서 증가). 이 증가는 주로 온스당 2,653달러라는 역사적인 평균 금 가격 덕분입니다.
처리 비용은 하루 2,000 톤의 용량 확장으로 인해 톨당 12.60달러로 현저히 감소했습니다(26.56달러에서 감소). 총 처리된 광석량은 1,703 tpd에 달하여 2024년 1분기 대비 108% 증가했습니다. 채굴 비용 또한 톨당 4.00달러로 개선되었습니다(4.25달러에서 감소).
회사는 스탬퍼드 브리지 지역에서 최고의 굴착 결과를 발표했으며, 37미터 @ 6.86 g/t Au 및 35.5미터 @ 5.48 g/t Au를 교차했습니다. 이 새로운 금 광물화 구역은 Buckreef Gold 메인 존에서 동쪽으로 250미터 떨어진 곳에 위치해 있습니다.
TRX Gold a annoncé ses résultats du premier trimestre 2025, marqués par des réalisations opérationnelles significatives. L'entreprise a extrait 4 841 onces d'or, générant un chiffre d'affaires de 12,5 millions de dollars (contre 9,4 millions au premier trimestre 2024) et un bénéfice brut de 4,8 millions de dollars (contre 3,7 millions). Cette augmentation est principalement due au prix moyen réalisé de l'or, qui a atteint un niveau record de 2 653 dollars par once.
Les coûts de traitement ont considérablement diminué à 12,60 dollars par tonne (contre 26,56) suite à l'extension de la capacité à 2 000 tonnes par jour. La quantité totale de minerai traité a atteint 1 703 tpd, soit une augmentation de 108 % par rapport au premier trimestre 2024. Les coûts miniers se sont également améliorés, atteignant 4,00 dollars par tonne (contre 4,25).
L'entreprise a annoncé ses meilleurs résultats de forage jamais réalisés à la zone de Stamford Bridge, recensant 37 mètres @ 6,86 g/t Au et 35,5 m @ 5,48 g/t Au. Cette nouvelle zone de minéralisation aurifère est située à 250 mètres à l'est de la zone principale de Buckreef Gold.
TRX Gold hat die Ergebnisse des ersten Quartals 2025 mit bedeutenden betrieblichen Erfolgen veröffentlicht. Das Unternehmen hat 4.841 Unzen Gold gefördert und damit einen Umsatz von 12,5 Millionen Dollar (ein Anstieg von 9,4 Millionen im ersten Quartal 2024) sowie einen Bruttogewinn von 4,8 Millionen Dollar (ein Anstieg von 3,7 Millionen) erzielt. Der Anstieg war hauptsächlich auf den rekordverdächtigen durchschnittlichen Realisierungspreis von 2.653 Dollar pro Unze zurückzuführen.
Die Verarbeitungskosten sanken erheblich auf 12,60 Dollar pro Tonne (ein Rückgang von 26,56) nach der Erweiterung auf eine Kapazität von 2.000 Tonnen pro Tag. Die Gesamtmenge des verarbeiteten Erzes erreichte 1.703 tpd, ein Anstieg von 108% gegenüber dem ersten Quartal 2024. Die Bergbaukosten verbesserten sich ebenfalls auf 4,00 Dollar pro Tonne (von 4,25).
Das Unternehmen gab bekannt, dass es die besten Bohrergebnisse in der Stamford Bridge Zone erzielt hat und dabei 37 Meter @ 6,86 g/t Au und 35,5m @ 5,48 g/t Au durchschnitten hat. Diese neue Goldmineralisationszone befindet sich 250 Meter östlich der Hauptzone von Buckreef Gold.
- Revenue increased 33% YoY to $12.5M
- Gross profit grew 30% to $4.8M
- Processing costs reduced by 53% to $12.60 per tonne
- Mill throughput increased 108% YoY
- Record average realized gold price of $2,653 per ounce
- Best-ever drill results at Stamford Bridge Zone
- Lower average head grade of 1.29 g/t (vs 2.57 g/t in Q1 2024)
- Decreased gold recovery rate to 72% (vs 81% in Q1 2024)
- Slightly lower gold production of 4,841 oz (vs 4,927 oz in Q1 2024)
Insights
The Q1 2025 results demonstrate a compelling financial narrative despite mixed operational metrics. Revenue surged by 33% to
The expanded 2,000 tpd processing facility is proving transformative, with throughput increasing by
The financial resilience during a lower-grade mining phase, combined with planned access to higher-grade ore blocks in H2 2025, positions TRX for potentially stronger performance ahead. The cost optimization achieved through the plant expansion provides a robust foundation for margin expansion when higher-grade ore processing resumes.
The operational metrics reveal a strategic mining sequence in progress. The temporary reduction in head grade to 1.29 g/t is a calculated trade-off, part of a necessary stripping campaign to access higher-grade ore blocks. The processing facility's demonstrated capability to handle 2,073 tpd exceeds the nominal 2,000 tpd design capacity, indicating robust plant engineering and potential for further optimization.
The blended material ratio of
The exploration results from Stamford Bridge Zone, particularly the 37m @ 6.86 g/t Au intersection, represent potentially game-changing discoveries. The emerging 1-kilometer bridge between main zones could significantly impact future resource estimates and mine life planning.
Plant Expansion Results in Significantly Lower Operating Cost Per Tonne
TORONTO, Jan. 15, 2025 (GLOBE NEWSWIRE) -- TRX Gold Corporation (TSX: TRX) (NYSE American: TRX) (the “Company” or “TRX Gold”) today reported its results for the first quarter of 2025 (“Q1 2025”) for the three months ended November 30, 2024. Financial results are available on the Company’s website at www.TRXgold.com.
Key highlights for Q1 2025 include:
- Capturing record gold prices: The Company poured 4,841 ounces of gold (Q1 2024: 4,927) and sold 4,813 ounces of gold (Q1 2024: 4,895) generating revenue of
$12.5 million (Q1 2024:$9.4 million ), gross profit of$4.8 million (Q1 2024:$3.7 million ) and Adjusted EBITDA1 of$4.4 million (Q1 2024:$2.6 million ). The increase in revenue, gross profit and Adjusted EBITDA1 compared to the prior comparative period is mainly related to a record average realized gold price (net)1 of$2,653 per ounce (Q1 2024:$1,942 per ounce). - Production level in line with expectations and mine sequencing: Gold production in Q1 2025 was mainly in line with the prior year comparative period and reflects higher mill throughput, offset by a lower average head grade of 1.29 g/t (Q1 2024: 2.57 g/t) and lower average recovery of
72% (Q1 2024:81% ). A planned mine sequence commenced in Q1 2025, accessing lower grade ore blocks during the quarter, concurrent with a scheduled stripping campaign, in order to access higher grade ore blocks in the second half of F2025. The lower average recovery in Q1 2025 was mainly due to a higher proportion of blended material processed in Q1 2025 (24% oxide /76% sulphide) compared to the prior year period, where the mill processed a higher proportion of oxide material at a higher average recovery. The Company also experienced lower recovery rates with lower grade material. - Decreasing variable cost per tonne: Processing costs per tonne of
$12.60 in Q1 2025 were significantly lower than the prior year comparative period (Q1 2024:$26.56 per tonne) predominantly due to greater economies of scale following final commissioning of the expanded 2,000 tonne per day (“tpd”) processing facility. Mining costs per tonne of$4.00 in Q1 2025 were also lower than the prior year comparative period (Q1 2024:$4.25) and are expected to continue to improve over time as owner operated equipment will be utilized to provide cost effective support for site development projects as well as plant feed operations. - Benefitting from economies of scale: Total ore tonnes processed at the newly expanded processing facility of 1,703 tpd in Q1 2025, were
108% higher than the prior year comparative period (Q1 2024: 817 tpd), reaching a maximum of 2,073 tpd, following commissioning of the newly expanded processing plant in early Q1 2025 (September 2024). The higher processing plant throughput provided a higher proportion of overhead cost absorption, significantly benefitting processing cost per tonne. - Increase in annual gold production is expected: The Company continues to expect gold production for fiscal 2025 (“F2025”) to be higher than fiscal 2024 (“F2024”) levels, reflecting a full year of operations from the expanded 2,000 tpd processing plant and an expected decreased reliance on lower grade stockpile inventory, partially offset by a waste stripping campaign required to access high grade ore blocks to deliver consistent higher grade ore feed to the mill. The Company continues to expect cash cost per ounce to be in line with F2024 levels, mainly due to the impact of higher expected gold production and significantly lower processing costs per tonne, offset by a lower average grade profile, in line with the scheduled mine sequence. Mining costs per tonne are also expected to trend lower in F2025.
- Best drill results to date at Buckreef Gold: During Q1 2025, the Company announced its two best drill results ever, on a gram x tonne x meters (“gtm”) basis, intersecting 37 meters (“m”) @ 6.86 g/t Au (253.82 gtm) from 130 m (hole BMDD315) and 35.5 m @ 5.48 g/t Au (194.54 gtm) from 64 m, located along the newly discovered and high-priority Stamford Bridge Zone. This is a promising new gold mineralization shear zone located approximately 250 m east of the Buckreef Gold Main Zone that is beginning to form what may become a potential 1-kilometer “bridge” between the Buckreef Gold Main Zone and the prospective Eastern Porphyry and Anfield zones. Subsequent to Q1 2025, the Company announced additional high-grade intercepts at Stamford Bridge (see January 14, 2025 Press Release) as part of its ongoing exploration program focused on newly defined exploration targets.
- Growth initiatives in place: Growth capital in F2025 is expected to be consistent with F2024 levels and includes expansion initiatives related to the long-term growth of Buckreef Gold, including plant optimizations aimed at increasing recovery, throughput and production and study costs aimed at expanding Buckreef Gold and developing the larger project.
- Exploration is a priority: Exploration spending is expected to increase in F2025 and includes diamond drill and reverse circulation drilling services provided by the State Mining Corporation (“STAMICO”) for a program which includes brownfields drilling at Buckreef Main Zone (Northeast and Southwest), Buckreef West, Eastern Porphyry, and greenfield drilling at Stamford Bridge and Anfield.
- Health & Safety remain top of mind: The Company achieved zero lost time injuries and there were no environmental or community related incidents during Q1 2025.
TRX Gold’s CEO, Stephen Mullowney comments: “Q1 2025 has been quite busy and has progressed in line with our plan. Gold production is a function of tonnes processed x head grade x recovery and consequently, your major cost drivers are tonnes moved and tonnes processed. We are pleased to see the lower operating costs per tonne come through on the plant expansion, which has enabled the business to be profitable even when processing lower grade material. These costs savings are expected to significantly benefit the business as the grade profile in the mining sequence improves. We have not stopped here, our newly appointed COO Richard Boffey, has been busy with ongoing operational efficiencies which are expected to benefit the business in the second half of the year as well. The exploration team continues to plan and execute an initial drill program at the newly discovered Stamford Bridge Zone, which is turning into quite an exciting discovery, with the best ever drill results to date at Buckreef Gold and the outline of a shear structure becoming more evident. Much more work will follow at this high-priority target over the next several months, as we hope to uncover a new mineable zone. Lastly, we are laser-focused on the mine plan in order to get to those high-grade ore blocks in the second half of this fiscal year, so that we can continue to capitalize on our reduced cost profile and robust gold prices.”
Figure 1: Buckreef Gold new and expanded crushing circuit (Q2 2024)
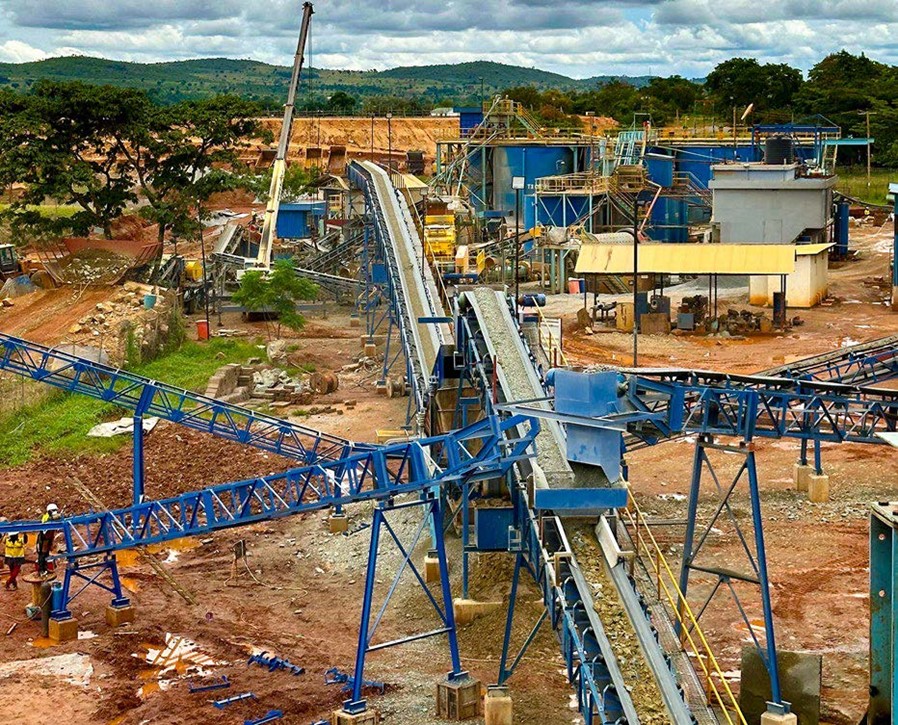
Figure 2: New 350 Excavator and Haul Truck (at December 20, 2024)
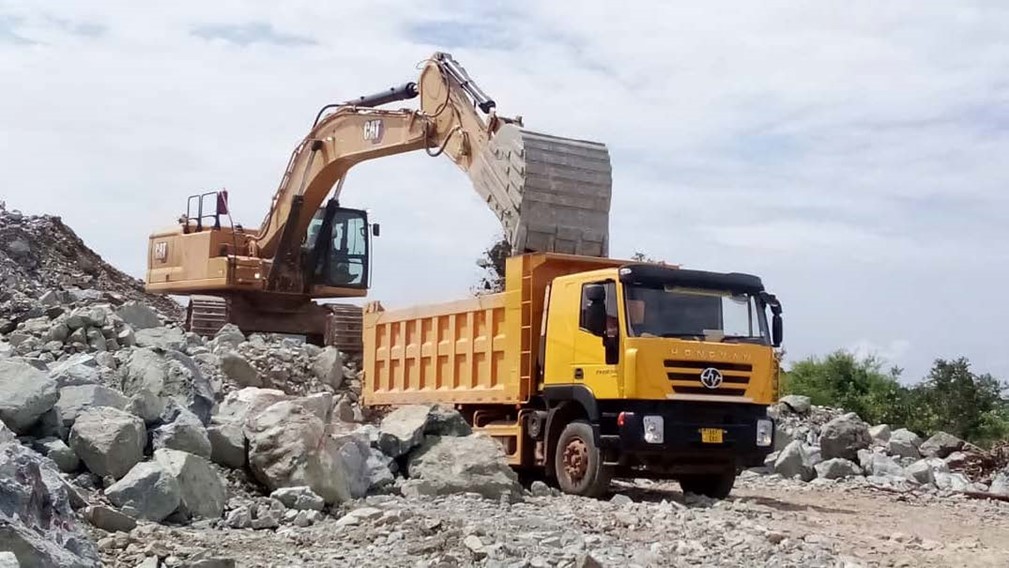
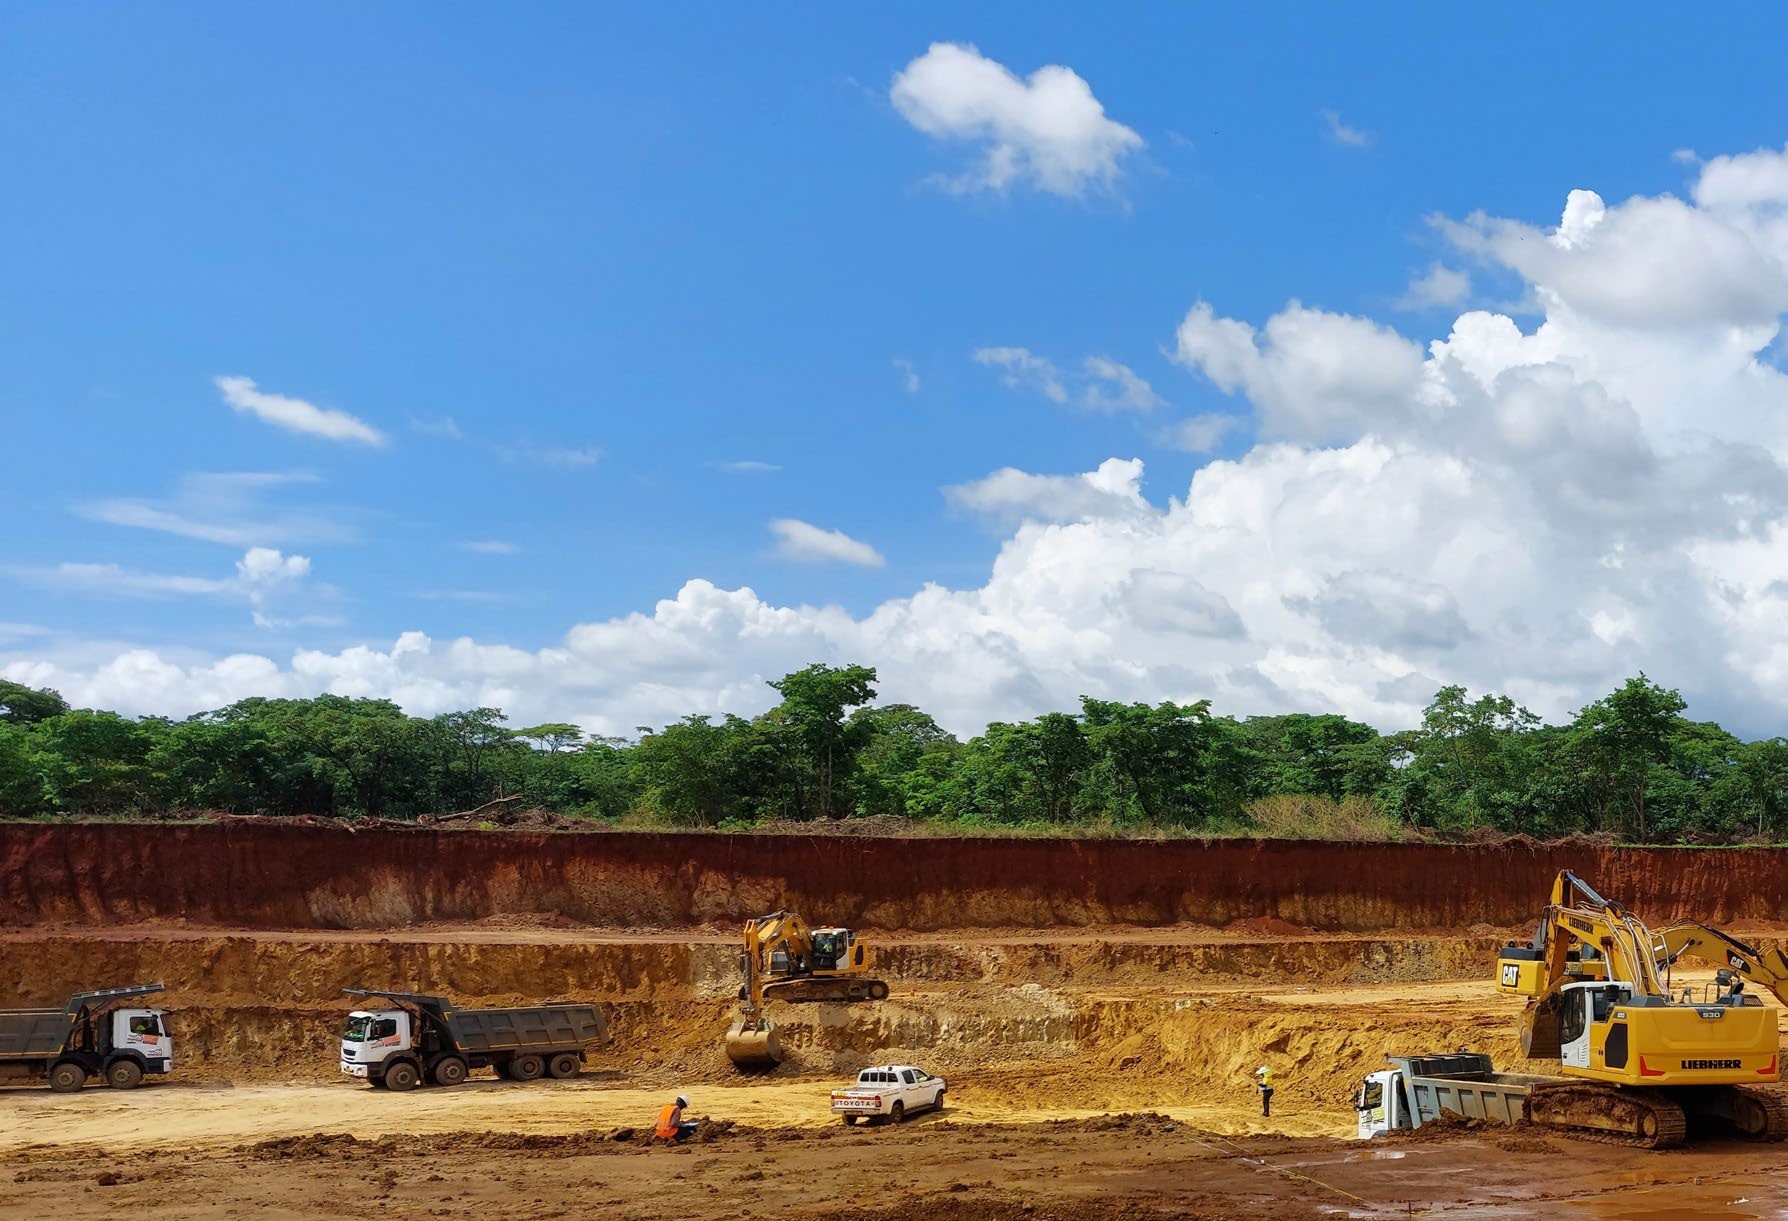
Figure 3: Buckreef Gold’s Open Pit Mining Operations (Q4 2024)
Qualified Person
Mr. William van Breugel, P.Eng, BASc (Hons), Technical Advisor to TRX Gold Corporation, is the Company’s Qualified Person under National Instrument 43-101 “Standards of Disclosure for Mineral Projects” (“NI 43-101”) and has reviewed and assumes responsibility for the scientific and technical content in this press release.
Q1 2025 Results Conference Call and Webcast Details
When: Tuesday, January 21 at 11:00 AM EST
Webcast URL: https://shorturl.at/Wxbj3
Conference call numbers:
Canada/USA TF: 1-844-763-8274
International Toll: +1-647-484-8814
A replay will be made available for 30 days following the call on the Company’s website.
About TRX Gold Corporation
TRX Gold is rapidly advancing the Buckreef Gold Project. Anchored by a Mineral Resource published in May 20202, the project currently hosts a Measured and Indicated Mineral Resource (“M&I Resource”) of 35.88 million tonnes (“MT”) at 1.77 grams per tonne (“g/t”) gold containing 2,036,280 ounces (“oz”) of gold and an Inferred Mineral Resource of 17.8 MT at 1.11 g/t gold for 635,540 oz of gold. The leadership team is focused on creating both near-term and long-term shareholder value by increasing gold production to generate positive cash flow. The positive cash flow will be utilized for exploratory drilling with the goal of increasing the current mineral resource base and advancing the larger project development which represents
For investor or shareholder inquiries, please contact:
Investors
Christina Lalli
Vice President, Investor Relations
TRX Gold Corporation
+1-438-399-8665
c.lalli@TRXgold.com
www.TRXgold.com
Non-IFRS Performance Measures
The company has included certain non-IFRS measures in this news release. The following non-IFRS measures should be read in conjunction with the Company’s unaudited interim consolidated financial statements for the three month ended November 30, 2024 filed on SEDAR+ and with the Securities and Exchange Commission (“SEC”), as well as the Company’s audited consolidated financial statements included in the Company's Annual Report on Form 40-F and Annual Information Form for the year ended August 31, 2024. The financial statements and related notes of TRX Gold have been prepared in accordance with International Financial Reporting Standards (“IFRS”). Additional information has been filed electronically on SEDAR+ and with the SEC and is available online under the Company’s profile at www.sedarplus.ca and the Company’s filings with the SEC at www.sec.gov and on our website at www.TRXgold.com.
Cash cost per ounce of gold sold
Cash cost per ounce of gold sold is a non-IFRS performance measure and does not constitute a measure recognized by IFRS and does not have a standardized meaning defined by IFRS. Cash cost per ounce may not be comparable to information in other gold producers’ reports and filings. As the Company uses this measure to monitor the performance of our gold mining operations and its ability to generate positive cash flow, total cash cost per ounce of gold sold starts with cost of sales related to gold production and removes depreciation.
Adjusted EBITDA
Adjusted EBITDA is a non-IFRS performance measure and does not constitute a measure recognized by IFRS and does not have a standardized meaning defined by IFRS. Adjusted EBITDA may not be comparable to information in other gold producers’ reports and filings. Adjusted EBITDA is presented as a supplemental measure of the Company’s performance and ability to service its obligations. Adjusted EBITDA is frequently used by securities analysts, investors and other interested parties in the evaluation of companies in the industry, many of which present Adjusted EBITDA when reporting their results. Issuers present Adjusted EBITDA because investors, analysts and rating agencies consider it useful in measuring the ability of those issuers to meet their obligations. Adjusted EBITDA represents net income before interest, income taxes, and depreciation and also eliminates the impact of a number of items that are not considered indicative of ongoing operating performance.
Certain items of expense are added, and certain items of income are deducted from net income that are not likely to recur or are not indicative of the Company’s underlying operating results for the reporting periods presented or for future operating performance and consist of:
- Change in fair value of derivative financial instruments;
- Accretion related to the provision for reclamation; and
- Share-based compensation expense.
The following table provides a reconciliation of net income (loss) and comprehensive income (loss) to Adjusted EBITDA per the financial statements for the three ended November 30, 2024.
| Three Months Ended November 30, 2024 | Three Months Ended November 30, 2023 | |||
| Net income and comprehensive income per financial statements | 2,137 | (39 | ) | |
| Add: | ||||
| Depreciation | 906 | 484 | ||
| Interest and other non-recurring expenses | 321 | 340 | ||
| Income tax expense | 1,693 | 1,191 | ||
| Change in fair value of derivative financial instruments | (819 | ) | (199 | ) |
| Share-based payment expense | 156 | 810 | ||
| Adjusted EBITDA | 4,394 | 2,587 | ||
Average realized price per ounce gold sold
| Three Months Ended November 30, 2024 | Three Months Ended November 30, 2023 | |||||
| Revenue per financial statements | $ | 12,528 | $ | 9,404 | ||
| Revenue recognized from OCIM prepaid gold purchase agreement | (915 | ) | (922 | ) | ||
| Revenue from gold spot sales | 11,613 | 8,482 | ||||
| Ounces of gold sold | 4,813 | 4,895 | ||||
| Ounces of gold sold from OCIM prepaid gold purchase agreement | (435 | ) | (527 | ) | ||
| Ounces from gold spot sales | 4,378 | 4,368 | ||||
| Average realized price (gross) | $ | 2,603 | $ | 1,921 | ||
| Average realized price net OCIM prepaid gold purchase agreement | $ | 2,653 | $ | 1,942 | ||
The Company has included “average realized price per ounce of gold sold”, “cash cost per ounce of gold sold” and “Adjusted EBITDA” as non-IFRS performance measures throughout this news release as TRX Gold believes that these generally accepted industry performance measures provide a useful indication of the Company’s operational performance. The Company believes that certain investors use this information to evaluate the Company’s performance and ability to generate cash flow. Accordingly, they are intended to provide additional information and should not be considered in isolation or as a substitute for measures of performance prepared in accordance with IFRS.
Forward-Looking and Cautionary Statements
This press release contains certain forward-looking statements as defined in the applicable securities laws. All statements, other than statements of historical facts, are forward-looking statements. Forward-looking statements are frequently, but not always, identified by words such as “expects”, “anticipates”, “believes”, “hopes”, “intends”, “estimated”, “potential”, “possible” and similar expressions, or statements that events, conditions or results “will”, “may”, “could” or “should” occur or be achieved. Forward-looking statements relate to future events or future performance and reflect TRX Gold management’s expectations or beliefs regarding future events and include, but are not limited to, statements with respect to continued operating cash flow, expansion of its process plant, estimation of mineral resources, ability to develop value creating activities, recoveries, subsequent project testing, success, scope and viability of mining operations, the timing and amount of estimated future production, and capital expenditure.
Although TRX Gold believes the expectations expressed in such forward-looking statements are based on reasonable assumptions, such statements are not guarantees of future performance. The actual achievements of TRX Gold or other future events or conditions may differ materially from those reflected in the forward-looking statements due to a variety of risks, uncertainties and other factors. These risks, uncertainties and factors include general business, legal, economic, competitive, political, regulatory and social uncertainties; actual results of exploration activities and economic evaluations; fluctuations in currency exchange rates; changes in costs; future prices of gold and other minerals; mining method, production profile and mine plan; delays in exploration, development and construction activities; changes in government legislation and regulation; the ability to obtain financing on acceptable terms and in a timely manner or at all; contests over title to properties; employee relations and shortages of skilled personnel and contractors; the speculative nature of, and the risks involved in, the exploration, development and mining business. These risks are set forth in reports that TRX Gold files with the SEC and the various Canadian securities authorities. You can review and obtain copies of these filings from the SEC's website at http://www.sec.gov/edgar.shtml and the Company’s profile on the System for Electronic Document Analysis and Retrieval (“SEDAR+”) at www.sedarplus.ca.
The disclosure contained in this press release of a scientific or technical nature relating to the Company’s Buckreef Project has been summarized or extracted from the technical report entitled “The National Instrument 43-101 Independent Technical Report, Updated Mineral Resource Estimate for the Buckreef Gold Mine Project, Tanzania, East Africa for TRX Gold” with an effective date (the “Effective Date”) of May 15, 2020 (the “2020 Technical Report”). The 2020 Technical Report was prepared by or under the supervision Mr. Wenceslaus Kutekwatekwa (Mining Engineer, Mining and Project Management Consultant) BSc Hons (Mining Eng.), MBA, FSAIMM, of Virimai Projects, and, Dr Frank Crundwell, MBA, PhD, a Consulting Engineer, each of whom is an independent Qualified Person as such term is defined in NI 43-101. The information contained herein is subject to all of the assumptions, qualifications and procedures set out in the 2020 Technical Report and reference should be made to the full details of the 2020 Technical Report which has been filed with the applicable regulatory authorities and is available on the Company’s profile at www.sedarplus.ca. The Company did not complete any new work that would warrant reporting material changes in the previously reported Mineral Resource (“MRE”) and Mineral Reserve statements during the prior reporting period. The 2020 Technical Report follows the CIM Definition Standards on Mineral Resources and Mineral Reserves (“CIM Definition Standards”) and the CIM Estimation of Mineral Resources & Mineral Reserves Best Practice Guidelines (“CIM Guidelines”).
The information contained in this press release is as of the date of the press release and TRX Gold assumes no duty to update such information.
1 Refer to “Non-IFRS Performance Measures” section.
2 See Forward-Looking and Cautionary Statements
Photos accompanying this announcement are available at
https://www.globenewswire.com/NewsRoom/AttachmentNg/1ef4ca4a-7364-427a-987f-4ac1e0b5b289
https://www.globenewswire.com/NewsRoom/AttachmentNg/1e3461bc-4b48-43d7-ab71-fc00c09c5359
https://www.globenewswire.com/NewsRoom/AttachmentNg/d4da72b8-3a7d-4701-810d-647d07e64da7
