Troy Minerals Reports Analytical Results from Table Mountain Silica Project, Identifying Broad High-Purity Zones
Troy Minerals has announced results from sampling at its 100% owned Table Mountain Silica Project near Golden, British Columbia. The program identified three distinct zones of high-purity silica mineralization within the Mount Wilson Quartzite Formation:
- Table Mountain Zone: Averaged 98.90% SiO₂ from 45 grab samples (range: 98.18-99.74%)
- South Zone: Averaged 98.80% SiO₂ from 13 samples (range: 97.83-99.49%)
- Southeast Zone: Averaged 98.52% SiO₂ from 29 samples (range: 95.82-99.82%)
Channel sampling at the Table Mountain Zone yielded 98.86% SiO₂ over 62.11 metres across five channels. The quartzite zone extends at least 150 metres wide with a strike length of minimum 4 kilometers. All zones showed very low levels of deleterious elements.
Troy Minerals ha annunciato i risultati dei campionamenti presso il suo progetto siliceo Table Mountain, di cui detiene il 100% dei diritti, nei pressi di Golden, Columbia Britannica. Il programma ha identificato tre zone distinte di mineralizzazione di silice ad alta purezza all'interno della formazione di quarzite di Mount Wilson:
- Zona Table Mountain: Ha riportato una media del 98,90% di SiO₂ da 45 campioni prelevati (intervallo: 98,18-99,74%)
- Zona Sud: Ha riportato una media del 98,80% di SiO₂ da 13 campioni (intervallo: 97,83-99,49%)
- Zona Sud-Est: Ha riportato una media del 98,52% di SiO₂ da 29 campioni (intervallo: 95,82-99,82%)
I campionamenti a canale nella Zona Table Mountain hanno mostrato un contenuto di SiO₂ del 98,86% su 62,11 metri distribuiti su cinque canali. La zona di quarzite si estende per almeno 150 metri di larghezza con una lunghezza minima di strike di 4 chilometri. Tutte le zone hanno mostrato livelli molto bassi di elementi deleteri.
Troy Minerals ha anunciado los resultados de muestreo en su proyecto de sílice Table Mountain, del cual posee el 100%. El programa identificó tres zonas distintas de mineralización de sílice de alta pureza dentro de la Formación de Cuarcita de Mount Wilson:
- Zona Table Mountain: Promedió un 98.90% de SiO₂ a partir de 45 muestras (rango: 98.18-99.74%)
- Zona Sur: Promedió un 98.80% de SiO₂ a partir de 13 muestras (rango: 97.83-99.49%)
- Zona Sureste: Promedió un 98.52% de SiO₂ a partir de 29 muestras (rango: 95.82-99.82%)
El muestreo en canal en la Zona Table Mountain arrojó un 98.86% de SiO₂ a lo largo de 62.11 metros en cinco canales. La zona de cuarcita se extiende al menos 150 metros de ancho con una longitud mínima de strike de 4 kilómetros. Todas las zonas mostraron niveles muy bajos de elementos perjudiciales.
트로이 광물은 브리티시 컬럼비아주 골든 근처에 위치한 100% 소유의 테이블 마운틴 실리카 프로젝트에서의 샘플링 결과를 발표했습니다. 이 프로그램은 마운트 윌슨 석영암 형성 내에서 높은 순도의 실리카 광물화를 가진 세 가지 뚜렷한 구역을 식별했습니다:
- 테이블 마운틴 구역: 45개의 잡아당긴 샘플에서 평균 98.90% SiO₂ (범위: 98.18-99.74%)
- 남쪽 구역: 13개의 샘플에서 평균 98.80% SiO₂ (범위: 97.83-99.49%)
- 남동쪽 구역: 29개의 샘플에서 평균 98.52% SiO₂ (범위: 95.82-99.82%)
테이블 마운틴 구역에서의 채널 샘플링은 5개의 채널에서 62.11미터에 걸쳐 98.86% SiO₂를 측정했습니다. 석영암 구역은 최소 150미터 너비로 4킬로미터의 최소 스트라이크 길이를 가지고 있습니다. 모든 구역은 유해한 요소의 매우 낮은 수준을 보였습니다.
Troy Minerals a annoncé les résultats de l'échantillonnage de son projet de silice Table Mountain, dont il possède 100%. Le programme a identifié trois zones distinctes de minéralisation de silice de haute pureté au sein de la formation de quartzite de Mount Wilson :
- Zone de Table Mountain : Moyenne de 98,90% de SiO₂ sur 45 échantillons (plage : 98,18-99,74%)
- Zone Sud : Moyenne de 98,80% de SiO₂ sur 13 échantillons (plage : 97,83-99,49%)
- Zone Sud-Est : Moyenne de 98,52% de SiO₂ sur 29 échantillons (plage : 95,82-99,82%)
Le prélèvement par canaux dans la zone de Table Mountain a donné 98,86% de SiO₂ sur 62,11 mètres à travers cinq canaux. La zone de quartzite s'étend sur au moins 150 mètres de large, avec une longueur de filon d'au moins 4 kilomètres. Toutes les zones ont montré des niveaux très faibles d'éléments nuisibles.
Troy Minerals hat die Ergebnisse der Probenahme seines zu 100% im eigenen Besitz befindlichen Silica-Projekts Table Mountain in der Nähe von Golden, British Columbia, bekannt gegeben. Das Programm identifizierte drei unterschiedliche Zonen mit hochreinem Siliciumminerals innerhalb der Mount Wilson Quarzitenformation:
- Table Mountain Zone: Durchschnittlich 98,90% SiO₂ aus 45 Proben (Bereich: 98,18-99,74%)
- Südzone: Durchschnittlich 98,80% SiO₂ aus 13 Proben (Bereich: 97,83-99,49%)
- Südostzone: Durchschnittlich 98,52% SiO₂ aus 29 Proben (Bereich: 95,82-99,82%)
Die Kanalsammlung in der Table Mountain Zone lieferte 98,86% SiO₂ über 62,11 Meter in fünf Kanälen. Die Quarzitzone erstreckt sich mindestens 150 Meter in der Breite mit einer minimalen Streckenlänge von 4 Kilometern. Alle Zonen zeigten sehr niedrige Werte von schädlichen Elementen.
- High-purity silica content consistently above 98% across all three zones
- Extensive mineralization zone of 150m width and 4km strike length
- Channel sampling confirms consistency of high-grade results
- Very low levels of contaminating elements
- None.
VANCOUVER, BC / ACCESS Newswire / February 6, 2025 / Troy Minerals Inc. ("Troy" or the "Company") (CSE:TROY)(OTCQB:TROYF)(FSE:VJ3) is pleased to announce that it has received results from a sampling and mapping program on its
Key Highlights
Three distinct zones of high-purity silica mineralization identified within the Mount Wilson Quartzite Formation.
98.86% SiO₂ over a total of 62.11 metres of channel sampling in five channels at the main Table Mountain Zone.Outcrop sampling returned
98.18% to99.74% SiO2 from 45 samples at Table Mountain Zone,97.83% to99.49% SiO₂ from 13 samples at South Zone, and95.82% to99.82% SiO₂ from 29 samples at Southeast Zone. *Very low deleterious elements identified in all samples.
President of Troy Minerals Inc., Yannis Tsitos commented: "These comprehensive maiden assay results validate the potential of Table Mountain as a key high-purity silica asset. Sampling confirmed the exceptional quality and consistency of silica mineralization across the Project. With grades reaching 98 to
The sampling program consisted of both systematic grab samples and channel samples, with a total of 110 grab samples (107 outcrop and 3 float) taken within the property area and 70 channel samples collected from 62.11 metres within 74.16 metres of channels.
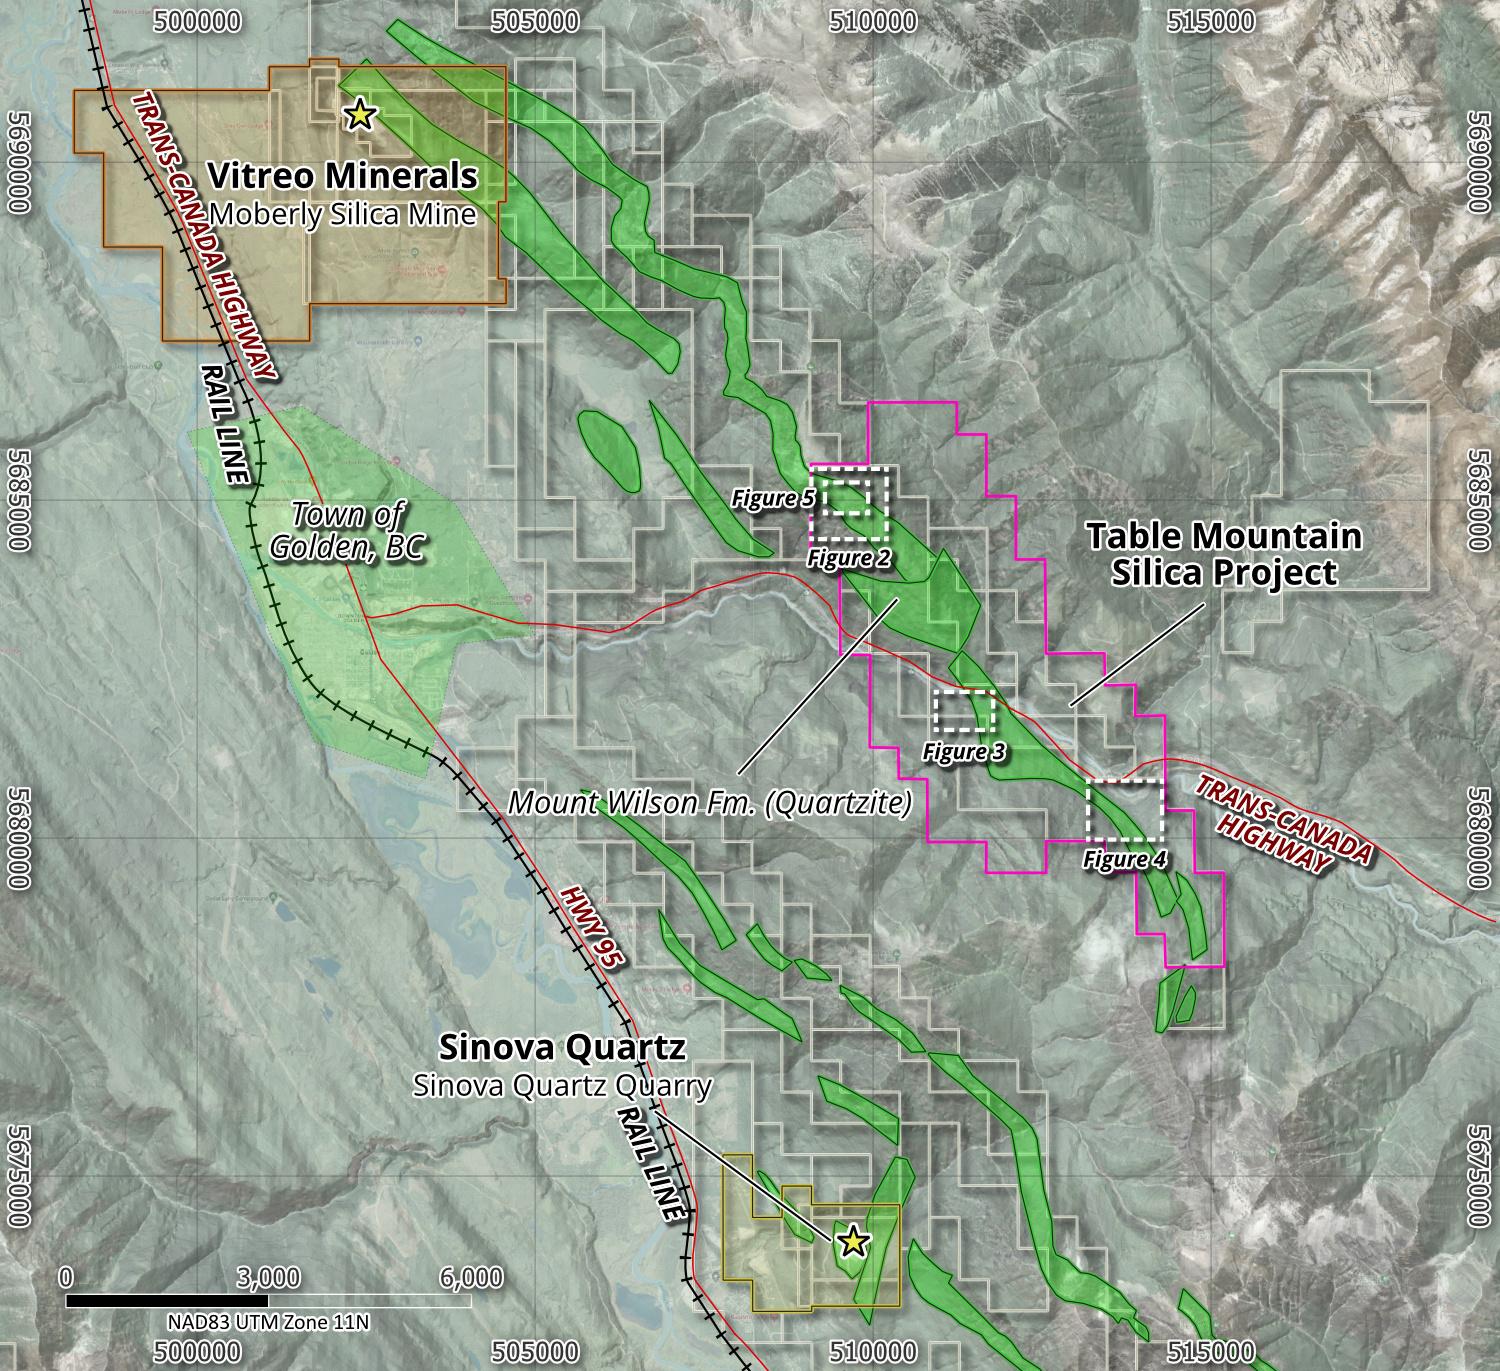
Figure 1. Index Map
Outcrop Sampling Results
Three main areas returned significant high-purity silica results: the Table Mountain Zone, located at the north end of the Property, the South Zone, and the Southeast Zone.
The most extensively sampled zone was the Table Mountain Zone, which returned an average grade of
Figure 2. Table Mountain Zone Outcrop Sampling - %SiO2
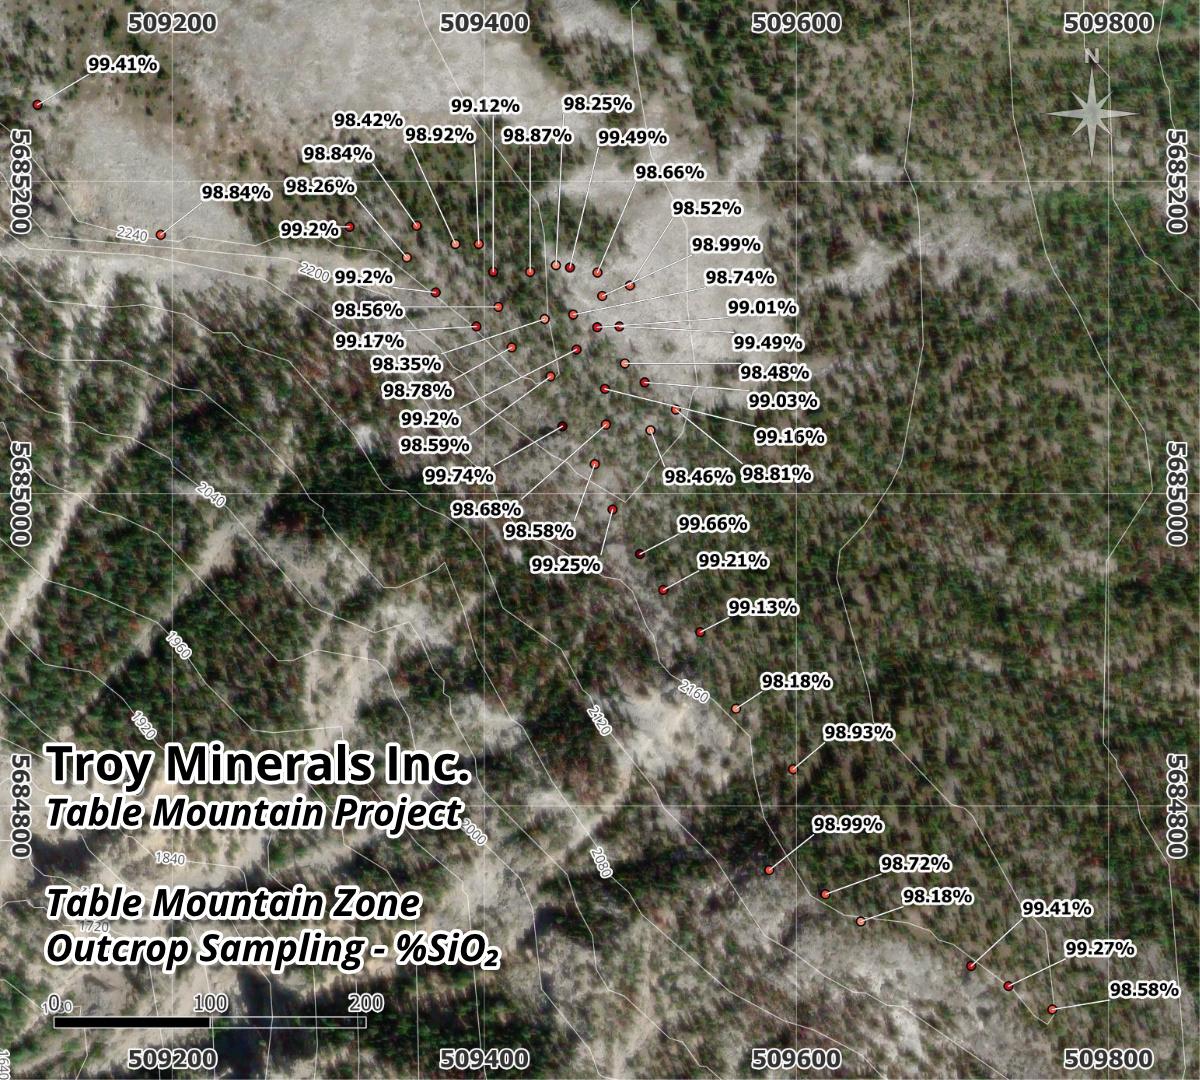
Table 1. Table Mountain Zone Outcrop Samples
Sample # | Easting (m) | Northing (m) | SiO2 (%) | Al2O3 (%) | CaO (%) | Fe2O3 (%) | MgO (%) | P2O5 (%) | TiO2 (%) | B (ppm) |
299516 | 509114 | 5685249 | 99.41 | 0.11 | 0.02 | 0.39 | 0.01 | <0.01 | <0.01 | 6 |
299517 | 509193 | 5685166 | 98.84 | 0.14 | 0.01 | 0.23 | 0.02 | <0.01 | <0.01 | 8 |
299518 | 509314 | 5685171 | 99.20 | 0.10 | 0.01 | 0.25 | 0.02 | <0.01 | 0.01 | 10 |
299519 | 509350 | 5685151 | 98.26 | 0.12 | 0.01 | 0.35 | 0.01 | <0.01 | 0.01 | 15 |
299520 | 509369 | 5685129 | 99.20 | 0.13 | 0.01 | 0.21 | <0.01 | <0.01 | 0.03 | 16 |
299521 | 509395 | 5685107 | 99.17 | 0.15 | 0.01 | 0.27 | 0.02 | <0.01 | 0.01 | 8 |
299522 | 509418 | 5685094 | 98.78 | 0.23 | 0.02 | 0.26 | 0.01 | <0.01 | 0.01 | 12 |
299523 | 509442 | 5685075 | 98.59 | 0.14 | 0.02 | 0.26 | <0.01 | 0.01 | 0.01 | 12 |
299524 | 509450 | 5685043 | 99.74 | 0.07 | 0.01 | 0.30 | 0.01 | 0.01 | 0.01 | 6 |
299525 | 509471 | 5685019 | 98.58 | 0.04 | 0.01 | 0.36 | 0.01 | 0.01 | 0.01 | 7 |
299526 | 509482 | 5684990 | 99.25 | 0.14 | 0.02 | 0.27 | 0.04 | 0.01 | 0.01 | 7 |
299527 | 509500 | 5684961 | 99.66 | 0.16 | 0.02 | 0.31 | 0.02 | 0.01 | 0.01 | 7 |
299528 | 509515 | 5684938 | 99.21 | 0.14 | 0.01 | 0.32 | 0.02 | 0.01 | 0.01 | 7 |
299529 | 509538 | 5684911 | 99.13 | 0.11 | 0.01 | 0.27 | 0.03 | 0.01 | 0.01 | 21 |
299530 | 509561 | 5684862 | 98.18 | 0.25 | 0.01 | 0.31 | 0.03 | 0.01 | 0.01 | 7 |
299531 | 509598 | 5684823 | 98.93 | 0.27 | 0.02 | 0.36 | 0.03 | 0.01 | 0.01 | 7 |
299532 | 509583 | 5684759 | 98.99 | 0.09 | 0.01 | 0.30 | <0.01 | 0.01 | 0.01 | 7 |
299533 | 509619 | 5684743 | 98.72 | 0.16 | 0.01 | 0.35 | 0.02 | 0.01 | 0.01 | 14 |
299534 | 509641 | 5684726 | 98.18 | 0.30 | 0.01 | 0.33 | 0.04 | 0.01 | 0.02 | 15 |
299535 | 509712 | 5684697 | 99.41 | 0.13 | 0.01 | 0.30 | 0.02 | 0.01 | 0.01 | 7 |
299536 | 509736 | 5684685 | 99.27 | 0.11 | 0.01 | 0.33 | 0.02 | 0.01 | 0.01 | 7 |
299537 | 509764 | 5684670 | 98.58 | 0.13 | 0.02 | 0.36 | 0.03 | 0.01 | 0.02 | 8 |
299548 | 509306 | 5685510 | 99.32 | 0.14 | 0.01 | 0.29 | 0.01 | 0.01 | 0.01 | 18 |
299560 | 509476 | 5685127 | 98.99 | 0.13 | 0.01 | 0.32 | 0.03 | 0.01 | 0.02 | 27 |
299561 | 509472 | 5685107 | 99.01 | 0.05 | 0.01 | 0.32 | 0.01 | 0.01 | <0.01 | 18 |
299562 | 509457 | 5685115 | 98.74 | 0.15 | 0.01 | 0.26 | 0.01 | 0.01 | 0.02 | 28 |
299563 | 509439 | 5685112 | 98.35 | 0.20 | 0.02 | 0.34 | 0.02 | 0.01 | 0.01 | 27 |
299564 | 509459 | 5685092 | 99.20 | 0.09 | 0.01 | 0.32 | <0.01 | 0.01 | 0.01 | 21 |
299565 | 509487 | 5685107 | 99.49 | 0.09 | 0.01 | 0.28 | 0.03 | 0.01 | 0.02 | 28 |
299566 | 509490 | 5685083 | 98.48 | 0.25 | 0.02 | 0.35 | 0.01 | 0.01 | 0.01 | 26 |
299567 | 509503 | 5685071 | 99.03 | 0.11 | 0.02 | 0.34 | 0.02 | 0.01 | <0.01 | 21 |
299568 | 509477 | 5685067 | 99.16 | 0.10 | 0.01 | 0.30 | <0.01 | 0.01 | <0.01 | 18 |
299569 | 509478 | 5685044 | 98.68 | 0.10 | 0.01 | 0.32 | 0.03 | 0.01 | <0.01 | 20 |
299570 | 509506 | 5685041 | 98.46 | 0.43 | 0.02 | 0.32 | 0.06 | 0.01 | 0.01 | 29 |
299571 | 509523 | 5685054 | 98.81 | 0.13 | 0.01 | 0.31 | 0.03 | 0.01 | 0.01 | 22 |
299572 | 509382 | 5685160 | 98.42 | 0.09 | 0.01 | 0.29 | 0.01 | 0.01 | 0.01 | 23 |
299573 | 509397 | 5685160 | 98.92 | 0.11 | 0.01 | 0.36 | <0.01 | 0.01 | <0.01 | 18 |
299574 | 509406 | 5685142 | 99.12 | 0.09 | 0.01 | 0.30 | 0.02 | 0.01 | <0.01 | 17 |
299575 | 509409 | 5685120 | 98.56 | 0.14 | 0.01 | 0.37 | <0.01 | 0.01 | <0.01 | 21 |
299581 | 509357 | 5685172 | 98.84 | 0.08 | 0.02 | 0.32 | <0.01 | 0.01 | 0.01 | 18 |
299582 | 509429 | 5685142 | 98.87 | 0.15 | 0.01 | 0.29 | <0.01 | 0.01 | 0.02 | 8 |
299583 | 509446 | 5685146 | 98.25 | 0.33 | 0.02 | 0.33 | 0.03 | 0.01 | 0.03 | 17 |
299584 | 509455 | 5685145 | 99.49 | 0.11 | 0.02 | 0.27 | <0.01 | 0.01 | 0.01 | 5 |
299585 | 509473 | 5685142 | 98.66 | 0.08 | 0.01 | 0.36 | <0.01 | 0.01 | <0.01 | 6 |
299586 | 509493 | 5685133 | 98.52 | 0.05 | 0.01 | 0.29 | <0.01 | 0.01 | <0.01 | <5 |
Note: 299548, 299584, and 299585 are float samples taken near outcrop.
The South Zone, comprising 13 high-grade quartzite outcrop grab samples averaged
Figure 3. South Zone Outcrop Sampling - %SiO2
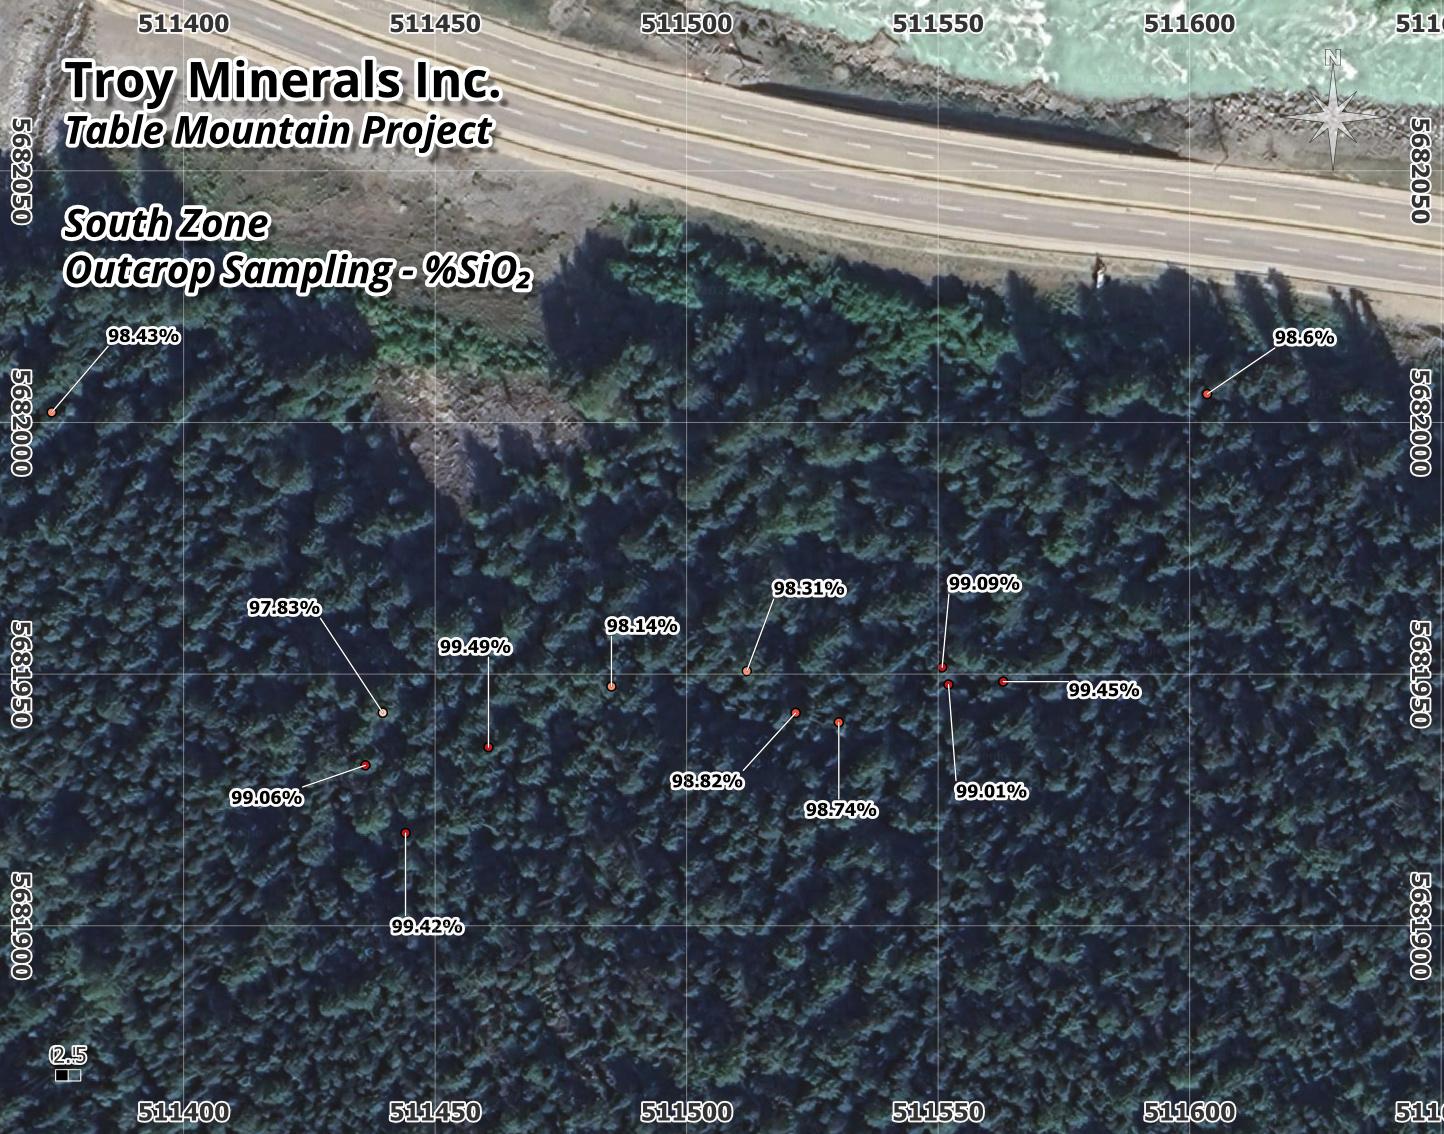
Table 2. South Zone Outcrop Samples
Sample # | Easting (m) | Northing (m) | SiO2 (%) | Al2O3 (%) | CaO (%) | Fe2O3 (%) | MgO (%) | P2O5 (%) | TiO2 (%) | B (ppm) |
248351 | 511603 | 5682006 | 98.60 | 0.28 | 0.08 | 0.25 | 0.04 | 0.01 | 0.01 | 15 |
248352 | 511563 | 5681948 | 99.45 | 0.15 | 0.02 | 0.22 | 0.02 | 0.01 | <0.01 | 6 |
248353 | 511552 | 5681948 | 99.01 | 0.19 | 0.03 | 0.29 | 0.04 | 0.01 | 0.01 | 9 |
248354 | 511551 | 5681951 | 99.09 | 0.11 | 0.02 | 0.22 | 0.03 | 0.01 | 0.01 | 6 |
248355 | 511530 | 5681940 | 98.74 | 0.09 | 0.02 | 0.23 | <0.01 | 0.01 | <0.01 | 6 |
248356 | 511522 | 5681942 | 98.82 | 0.08 | 0.01 | 0.31 | <0.01 | 0.01 | <0.01 | <5 |
248357 | 511512 | 5681951 | 98.31 | 0.09 | 0.01 | 0.24 | 0.01 | 0.01 | 0.01 | 5 |
248358 | 511485 | 5681948 | 98.14 | 0.13 | 0.28 | 0.32 | 0.03 | 0.01 | 0.01 | 8 |
248359 | 511461 | 5681935 | 99.49 | 0.11 | 0.02 | 0.30 | 0.02 | 0.01 | <0.01 | 10 |
248360 | 511436 | 5681932 | 99.06 | 0.03 | 0.05 | 0.25 | 0.01 | 0.02 | <0.01 | 5 |
248361 | 511444 | 5681918 | 99.42 | 0.07 | 0.01 | 0.29 | 0.02 | 0.01 | <0.01 | 6 |
248362 | 511440 | 5681942 | 97.83 | 0.32 | 0.73 | 0.36 | 0.03 | 0.03 | 0.01 | 8 |
248364 | 511374 | 5682002 | 98.43 | 0.09 | 0.43 | 0.36 | <0.01 | 0.16 | <0.01 | <5 |
The Southeast Zone, comprising 29 high-grade quartzite outcrop grab samples, returned an average of
Figure 4. Southeast Zone Outcrop Sampling - %SiO2
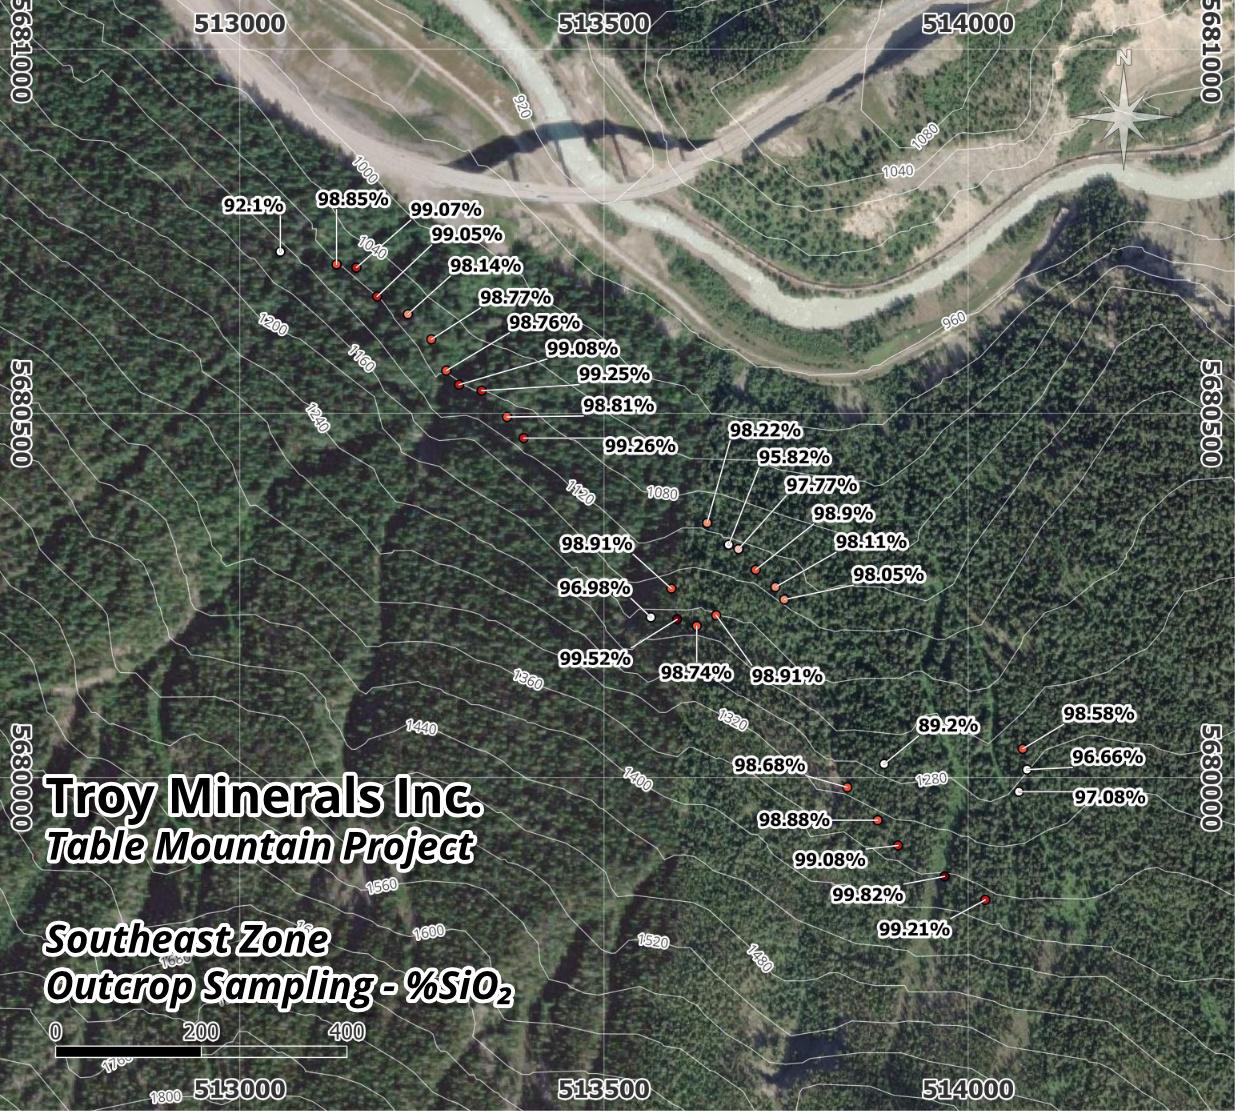
Table 3. Southeast Zone Outcrop Samples - %SiO2
Sample # | Easting (m) | Northing (m) | SiO2 (%) | Al2O3 (%) | CaO (%) | Fe2O3 (%) | MgO (%) | P2O5 (%) | TiO2 (%) | B (ppm) |
248384 | 513642 | 5680350 | 98.22 | 0.37 | 0.21 | 0.41 | 0.14 | 0.02 | 0.03 | 27 |
248385 | 513671 | 5680320 | 95.82 | 0.57 | 0.69 | 0.51 | 0.52 | 0.02 | 0.03 | 30 |
248386 | 513685 | 5680313 | 97.77 | 0.48 | 0.05 | 0.37 | 0.05 | 0.01 | 0.03 | 30 |
248387 | 513708 | 5680285 | 98.90 | 0.36 | 0.02 | 0.35 | 0.04 | <0.01 | 0.03 | 30 |
248388 | 513735 | 5680261 | 98.11 | 0.32 | 0.03 | 0.31 | 0.04 | <0.01 | 0.03 | 35 |
248389 | 513748 | 5680244 | 98.05 | 0.49 | 0.03 | 0.30 | 0.03 | <0.01 | 0.01 | 28 |
248390 | 513654 | 5680223 | 98.91 | 0.13 | 0.01 | 0.27 | 0.04 | <0.01 | 0.01 | 29 |
248391 | 513627 | 5680208 | 98.74 | 0.09 | 0.02 | 0.30 | 0.02 | <0.01 | 0.02 | 27 |
248392 | 513600 | 5680217 | 99.52 | 0.06 | 0.02 | 0.32 | 0.03 | <0.01 | 0.01 | 23 |
248393 | 513564 | 5680220 | 96.98 | 1.04 | 0.05 | 0.33 | 0.07 | 0.03 | 0.07 | 41 |
248394 | 513592 | 5680259 | 98.91 | 0.30 | 0.13 | 0.35 | 0.13 | <0.01 | 0.02 | 31 |
248395 | 513390 | 5680466 | 99.26 | 0.11 | 0.02 | 0.35 | 0.03 | <0.01 | 0.01 | 25 |
248396 | 513367 | 5680495 | 98.81 | 0.12 | 0.07 | 0.34 | 0.04 | <0.01 | 0.01 | 25 |
248397 | 513332 | 5680531 | 99.25 | 0.08 | 0.02 | 0.37 | 0.01 | <0.01 | 0.01 | 26 |
248398 | 513301 | 5680539 | 99.08 | 0.15 | 0.21 | 0.33 | 0.04 | <0.01 | 0.01 | 27 |
248399 | 513283 | 5680559 | 98.76 | 0.07 | 0.09 | 0.36 | 0.02 | <0.01 | 0.01 | 22 |
248400 | 513263 | 5680602 | 98.77 | 0.08 | 0.01 | 0.29 | <0.01 | <0.01 | 0.01 | 24 |
299501 | 513231 | 5680636 | 98.14 | 0.15 | 0.02 | 0.41 | 0.02 | <0.01 | 0.01 | 26 |
299502 | 513188 | 5680660 | 99.05 | 0.20 | 0.02 | 0.27 | <0.01 | <0.01 | 0.01 | 27 |
299503 | 513160 | 5680700 | 99.07 | 0.16 | 0.02 | 0.31 | 0.02 | <0.01 | 0.01 | 27 |
299504 | 513133 | 5680705 | 98.85 | 0.13 | 0.02 | 0.26 | 0.01 | <0.01 | 0.01 | 26 |
299508 | 513834 | 5679986 | 98.68 | 0.15 | 0.03 | 0.26 | 0.02 | <0.01 | 0.01 | 21 |
299509 | 513876 | 5679941 | 98.88 | 0.23 | 0.03 | 0.27 | 0.04 | <0.01 | 0.03 | 34 |
299510 | 513904 | 5679907 | 99.08 | 0.05 | 0.02 | 0.29 | <0.01 | <0.01 | 0.01 | 11 |
299511 | 513968 | 5679864 | 99.82 | 0.15 | 0.02 | 0.27 | 0.02 | <0.01 | 0.01 | 23 |
299512 | 514023 | 5679832 | 99.21 | 0.12 | 0.02 | 0.29 | 0.03 | <0.01 | 0.03 | 10 |
299513 | 514070 | 5679980 | 97.08 | 1.11 | 0.02 | 0.75 | 0.09 | 0.01 | 0.05 | 18 |
299514 | 514081 | 5680011 | 96.66 | 1.27 | 0.02 | 0.43 | 0.05 | 0.01 | 0.07 | 26 |
299515 | 514075 | 5680039 | 98.58 | 0.26 | 0.07 | 0.45 | 0.07 | 0.01 | 0.03 | 14 |
The remainder of samples were either taken near the contacts of the adjacent units or from non-quartzite outcrops of the adjacent Glenogle shale (east contact) and Beaverfoot dolomite (west contact) and were not included in the statistical summary of the quartzite samples taken.
Channel Sampling Results
Channel sampling was conducted at the Table Mountain Zone, with results consistently similar to the outcrop sampling results. Sampling procedure consisted of continuous chip sampling along a 3-centimetre cut channel. Samples were taken continuously over 1-metre intervals perpendicular to the strike orientation of the outcrop, with the sample sequence starting from the southwest end of the channel. Intervals shorter than 20 centimetres were combined with the previous interval. 66 continuous chip channel samples were collected over 62.11 metres within 74.16 metres in five channels, returning a weighted average of
Four additional duplicates were taken as QA/QC checks and passed validation. Sample density is sufficient to indicate the accurate representation of the underlying mineralization.
See Figure 5 and Table 4 below.
Figure 5. Channel Sampling Locations - Table Mountain Zone
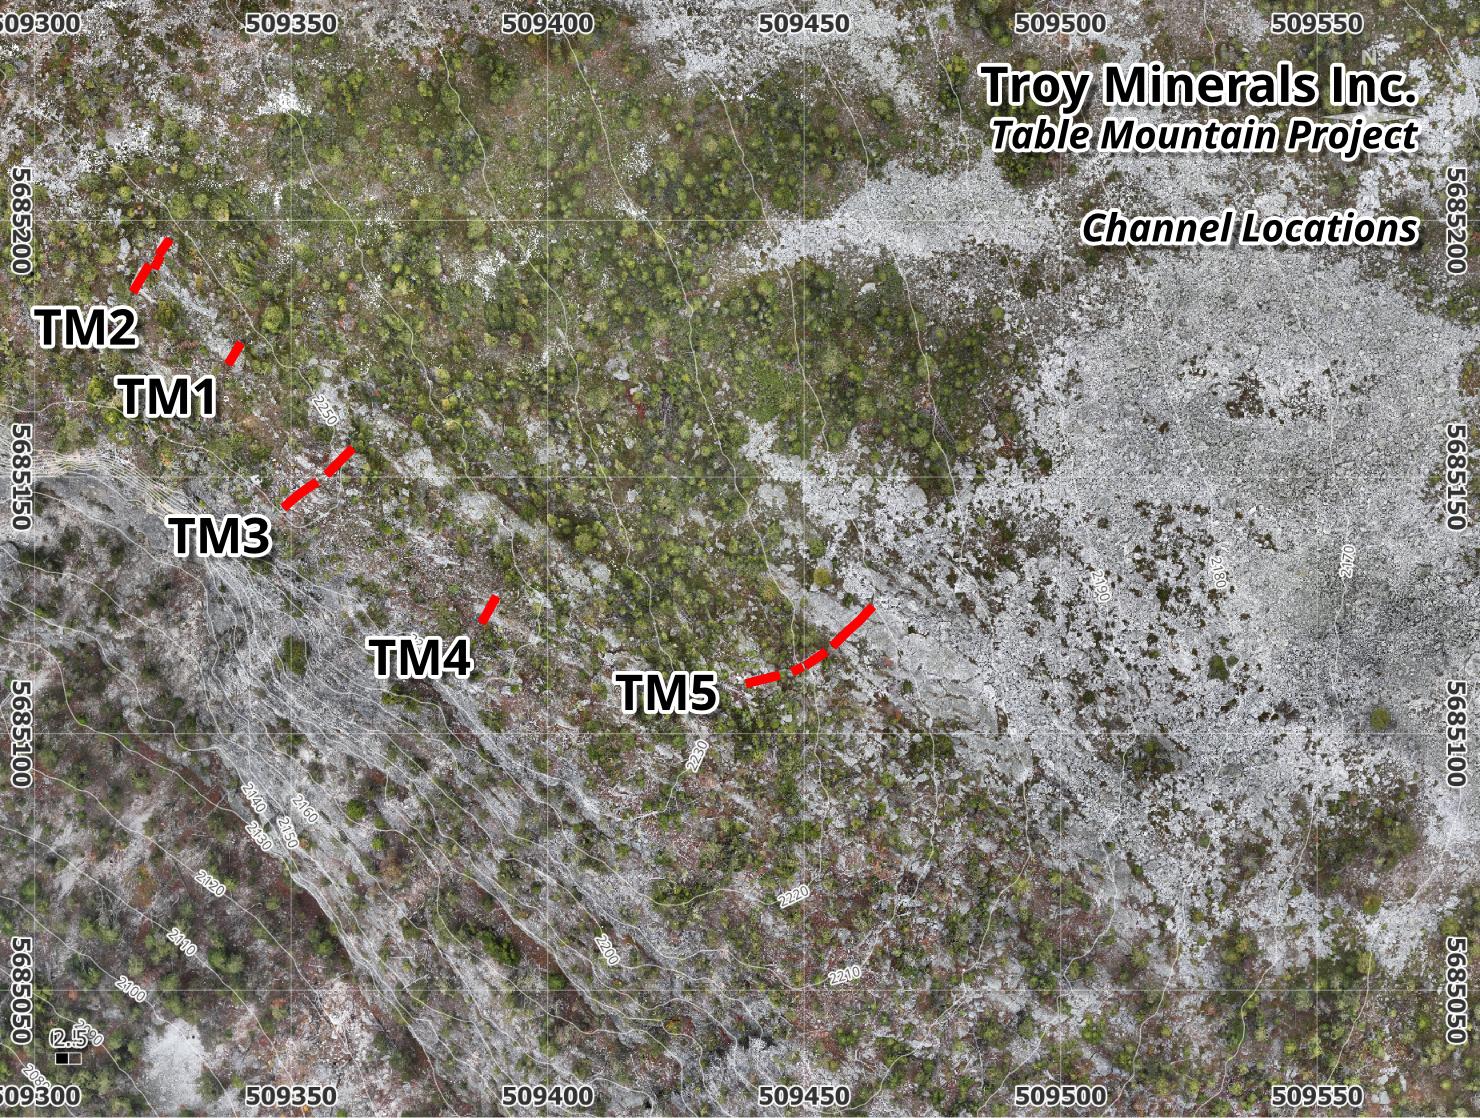
Table 4. Table Mountain Zone - Channel Sampling
Channel | From (m) | To (m) | Interval (m) | SiO2 (%) | Al2O3 (%) | CaO (%) | Fe2O3 (%) | MgO (%) | P2O5 (%) | TiO2 (%) | B (ppm) |
TM1 | 0.00 | 4.74 | 4.74 | 98.83 | 0.15 | 0.01 | 0.30 | 0.01 | 0.01 | 0.01 | 24 |
TM2 | 0.00 | 5.80 | 5.80 | 98.88 | 0.10 | 0.01 | 0.33 | 0.01 | 0.01 | 0.01 | 10 |
5.80 | 6.30 | 0.50 | Overburden | ||||||||
6.30 | 8.83 | 2.53 | 98.90 | 0.10 | 0.01 | 0.30 | 0.01 | 0.01 | 0.02 | 7 | |
8.83 | 9.38 | 0.55 | Overburden | ||||||||
9.38 | 13.0 | 3.62 | 99.21 | 0.09 | <0.01 | 0.35 | 0.01 | 0.01 | 0.02 | 11 | |
TM3 | 0.00 | 7.60 | 7.60 | 99.03 | 0.11 | <0.01 | 0.32 | 0.01 | 0.01 | 0.02 | 7 |
7.60 | 10.20 | 2.60 | Overburden | ||||||||
10.20 | 11.00 | 0.80 | 99.08 | 0.11 | <0.01 | 0.27 | 0.01 | 0.01 | 0.02 | 6 | |
11.00 | 11.90 | 0.90 | Overburden | ||||||||
11.90 | 18.00 | 6.10 | 98.79 | 0.11 | <0.01 | 0.29 | <0.01 | 0.01 | 0.02 | 10 | |
TM4 | 0.00 | 5.22 | 5.22 | 99.09 | 0.09 | <0.01 | 0.33 | <0.01 | 0.01 | 0.02 | 12 |
TM5 | 0.00 | 3.80 | 3.80 | 98.82 | 0.15 | <0.01 | 0.29 | <0.01 | 0.01 | 0.04 | 15 |
3.80 | 4.50 | 0.70 | Overburden | ||||||||
4.50 | 7.00 | 2.50 | 98.85 | 0.12 | <0.01 | 0.31 | 0.02 | 0.01 | 0.02 | 20 | |
7.00 | 10.20 | 3.20 | Overburden | ||||||||
10.20 | 12.00 | 1.80 | 98.77 | 0.09 | <0.01 | 0.34 | 0.01 | <0.01 | 0.01 | 12 | |
12.00 | 13.00 | 1.00 | Overburden | ||||||||
13.00 | 17.50 | 4.50 | 98.30 | 0.15 | 0.09 | 0.34 | 0.02 | <0.01 | 0.01 | 13 | |
17.50 | 20.10 | 2.60 | Overburden | ||||||||
20.10 | 33.20 | 13.10 | 98.81 | 0.11 | <0.01 | 0.31 | 0.01 | <0.01 | 0.01 | 9 | |
Discussion
Sampling results within the zones were consistently high purity, with the northern Table Mountain Zone returning the best and most consistent grades. The favourable grades reflect field observations of a broad zone of white quartzite measuring at least 150 metres wide and a strike length extending from the Trans-Canada Highway to the south and to the north, beyond the northern end of the Property, representing a total strike length of at least 4 kilometres. Although the western cliff face of Table Mountain clearly demarcates the western margin of the Mount Wilson Formation quartzite, the eastern margin is obscured by a deep boulder field originating from the extensive, steep quartzite exposure in this area.
Channels sampling results demonstrated a consistency in grade over a wide area within the Table Mountain Zone.
All samples were submitted to ALS Laboratories in North Vancouver, British Columbia for B-MS82L (boron) and ME-XRF26 (all other elements). Four sample duplicates were taken in the channel sampling sequence, and passed QA/QC.
* Cautionary Note
The reader is cautioned that grab samples are selective by nature and may not represent the true grade or style of mineralization across the property.
About the Table Mountain Project
The Table Mountain Silica Project comprises 2,304 hectares located 4 kilometres east of Golden, B.C., with excellent year-round access and proximity to the Canadian Pacific Railway Golden Rail Yard. The property hosts up to 10 kilometers of regionally mapped strike length of the Mount Wilson Formation, with apparent widths ranging from 300 to 1,400 metres at surface. The project is strategically positioned near both the Moberly Silica Mine and Sinova Quartz silica quarry, which exhibit economic grade silica greater than
Qualified Person
Technical information in this news release has been reviewed and approved by Case Lewis, P.Geo., a "Qualified Person" as defined under NI 43-101 Standards of Disclosure for Mineral Projects and a director of the Table Mountain Project vendor.
About Troy Minerals
Troy Minerals is a Canadian based publicly listed mining company focused on building shareholder value through acquisition, exploration, and development of strategically located "critical" mineral assets. Troy is aggressively advancing its projects within the silica (silicon), vanadium, and rare earths industries within regions that exhibit high and growing demand for such commodities, in both North America and Central-East Asia. The Company's primary objective is the near-term prospect of production with a vision of becoming a cash-flowing mining company to ultimately deliver tangible monetary value to shareholders, state, and local communities.
ON BEHALF OF THE BOARD,
Rana Vig | CEO & Director Telephone: 604-218-4766
Email: rana@ranavig.com
Forward-Looking Statements
Statement Regarding Forward-Looking Information: This release includes certain statements that may be deemed "forward-looking statements". All statements in this release, other than statements of historical facts, that address events or developments that Troy Resources Inc. (the "Company") expects to occur, are forward-looking statements. Forward-looking statements are statements that are not historical facts and are generally, but not always, identified by the words "expects", "plans", "anticipates", "believes", "intends", "estimates", "projects", "potential" and similar expressions, or that events or conditions "will", "would", "may", "could" or "should" occur. Although the Company believes the expectations expressed in such forward-looking statements are based on reasonable assumptions, such statements are not guarantees of future performance and actual results may differ materially from those in the forward-looking statements. Factors that could cause the actual results to differ materially from those in forward-looking statements include results of exploration activities may not show quality and quantity necessary for further exploration or future exploitation of minerals deposits, volatility of commodity prices, and continued availability of capital and financing, permitting and other approvals, and general economic, market or business conditions. Investors are cautioned that any such statements are not guarantees of future performance and actual results or developments may differ materially from those projected in the forward-looking statements. Forward-looking statements are based on the beliefs, estimates and opinions of the Company's management on the date the statements are made. Except as required by applicable securities laws, the Company undertakes no obligation to update these forward-looking statements in the event that management's beliefs, estimates or opinions, or other factors, should change.
The Canadian Securities Exchange has not reviewed this press release and does not accept responsibility for the adequacy or accuracy of this news release.
SOURCE: Troy Minerals Inc.
View the original press release on ACCESS Newswire