Temas Announces Positive Preliminary Economic Assessment for Piskanja Boron Project
Boron is critical for decarbonization as a high-impact, cross-cutting super material.
Boron demand is expected to outpace supply with each step toward Net Zero.
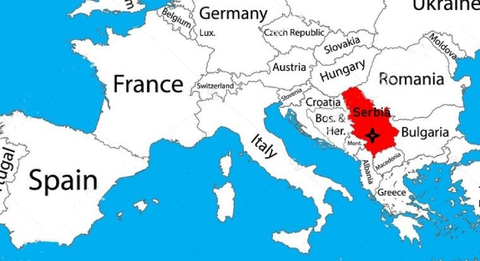
Location of
PEA HIGHLIGHTS
Post-tax Net Present Value (NPV10%) |
|
Post-tax IRR |
|
Initial capital cost (Capex) (including |
|
Capex payback from commercial production |
12 months |
Life of Mine (“LOM”) |
16 years |
Gross Project Revenue |
|
Net Project Cash Flow (post-tax) |
|
Average Annual Gross Revenue |
|
LOM average annual EBITDA |
|
Net operating margin |
|
Post-tax Operating Cost per t of product |
|
Weighted average revenue per t of product |
|
|
|
LOM average gross production |
305,304 tonnes |
Profitability Index (NPV/Capex) |
6.57X (post-tax) |
LOM Capital Intensity Index (Initial Capex/ROM tonnage) |
|
LOM average C1 (cash operating) cost (run-of-mine production) |
|
Average annual production (sales grade) colemanite |
258,272 t |
Average annual production of boric acid |
25,000 tonnes |
LOM average C1 cost (colemanite) post-tax |
|
LOM average C1 cost (boric acid) post-tax |
|
LOM mining production |
4.88 million tonnes |
LOM average grade B2O3 |
34.57 % |
Good potential for resource expansion |
|
Note:
All values in this news release are reported in
Assumed price/t (colemanite
Assumed price/t (boric acid, technical grade) for LOM:
Units expressed in metric tonnes
MINERAL RESOURCES
The basis for the PEA is the Mineral Resource Estimate prepared by Prof. Miodrag Banješević PhD.
The updated Mineral Resource Statement generated for the
Resource Category |
Geological Resource (tonne) |
B2O3 % |
Contained B2O3 (tonne) |
Measured |
1,391,574 |
35.59 |
495,251 |
Indicated |
5,478,986 |
34.05 |
1,865,677 |
Measured + Indicated |
6,870,560 |
34.36 |
2,360,928 |
Inferred |
284,771 |
39.59 |
112,732 |
Reported at a cut-off grade of 12 percent B2O3, at a minimum mining thickness of 1.2 m, considering reasonable underground mining, processing and selling technical parameters and costs benchmark against similar borate projects and a selling price of
SUMMARY OF PRELIMINARY ECONOMIC ASSESSMENT
The PEA was prepared independently under the supervision of Prof. Miodrag Banješević PhD.
ECONOMICS
Project economics were estimated assuming a constant price of
In summary, the Project has a post-tax LOM net project cashflow (pre-finance) of some
Project Cashflow |
US$ Millions |
Gross Revenue |
2,016.8 |
Deductions |
106.7 |
Net Revenue |
1,910.1 |
Operating Costs |
449.2 |
|
79.9 |
Sustaining Capital |
50.8 |
Closure Cost |
15.0 |
Project Cashflow |
1,315.1 |
Working Capital |
0 |
Corporation Tax |
101.1 |
|
|
Net Project Cashflow (post-tax) |
1,214.0 |
SENSITIVITIES
Discount Rate
The following table shows the pre- and post-tax NPVs at varying discount rates. (USD'000). The base case discount rate of
Discount Rate |
Pre-Tax NPV (USD‘000) |
Post-Tax NPV (USD‘000) |
|
831,083 |
777,955 |
|
647,789 |
610,987 |
|
553,917 |
524,893 |
|
476,926 |
453,909 |
|
385,467 |
369,049 |
The following table shows the effect on the post-tax NPV10 at varying revenue, opex, capex, and material price levels (from -
Sensitivities: Post Tax NPV at (USD’000,000) |
|||||||||||
|
- |
- |
- |
- |
- |
|
|
|
|
|
|
Revenue |
121 |
201 |
282 |
363 |
444 |
525 |
606 |
687 |
767 |
848 |
929 |
Opex |
616 |
598 |
580 |
561 |
543 |
525 |
507 |
488 |
470 |
452 |
434 |
Capital |
562 |
555 |
547 |
540 |
532 |
525 |
517 |
510 |
503 |
495 |
488 |
Colemanite Price |
148 |
223 |
299 |
374 |
450 |
525 |
600 |
676 |
751 |
826 |
902 |
BA Price |
497 |
503 |
508 |
514 |
519 |
525 |
530 |
536 |
541 |
547 |
552 |
The following table illustrates the projected Post-tax Net Present Value (“NPV”) sensitivity of the Piskanja project to Operating Cost and Capital Cost variations.
NPV (USD'000)
|
OPEX |
|||||||||||
|
- |
- |
- |
- |
- |
|
|
|
|
|
|
|
CAPEX |
- |
653,233 |
634,994 |
616,754 |
598,515 |
580,276 |
562,036 |
543,797 |
525,557 |
507,318 |
489,079 |
470,839 |
- |
645,805 |
627,565 |
609,326 |
591,086 |
572,847 |
554,608 |
536,368 |
518,129 |
499,889 |
481,650 |
463,411 |
|
- |
638,376 |
620,136 |
601,897 |
583,658 |
565,418 |
547,179 |
528,940 |
510,700 |
492,461 |
474,221 |
455,982 |
|
- |
630,947 |
612,708 |
594,468 |
576,229 |
557,990 |
539,750 |
521,511 |
503,271 |
485,032 |
466,793 |
448,553 |
|
- |
623,519 |
605,279 |
587,040 |
568,800 |
550,561 |
532,322 |
514,082 |
495,843 |
477,603 |
459,364 |
441,125 |
|
|
616,090 |
597,851 |
579,611 |
561,372 |
543,132 |
524,893 |
506,654 |
488,414 |
470,175 |
451,935 |
433,696 |
|
|
608,661 |
590,422 |
572,183 |
553,943 |
535,704 |
517,464 |
499,225 |
480,986 |
462,746 |
444,507 |
426,267 |
|
|
601,233 |
582,993 |
564,754 |
546,514 |
528,275 |
510,036 |
491,796 |
473,557 |
455,318 |
437,078 |
418,839 |
|
|
593,804 |
575,565 |
557,325 |
539,086 |
520,846 |
502,607 |
484,368 |
466,128 |
447,889 |
429,649 |
411,410 |
|
|
586,375 |
568,136 |
549,897 |
531,657 |
513,418 |
495,178 |
476,939 |
458,700 |
440,460 |
422,221 |
403,981 |
|
|
578,947 |
560,707 |
542,468 |
524,229 |
505,989 |
487,750 |
469,510 |
451,271 |
433,032 |
414,792 |
396,553 |
|
The table below illustrates the Post-tax NPV variability with changing Operating Cost and Revenue estimates.
NPV (USD'000) |
|
Revenue |
||||||||||
|
- |
- |
- |
- |
- |
|
|
|
|
|
|
|
OPEX |
- |
211,797 |
292,656 |
373,514 |
454,373 |
535,231 |
616,090 |
696,948 |
777,807 |
858,665 |
939,524 |
1,020,382 |
- |
193,558 |
274,417 |
355,275 |
436,134 |
516,992 |
597,851 |
678,709 |
759,568 |
840,426 |
921,285 |
1,002,143 |
|
- |
175,319 |
256,177 |
337,036 |
417,894 |
498,753 |
579,611 |
660,470 |
741,328 |
822,187 |
903,045 |
983,904 |
|
- |
157,079 |
237,938 |
318,796 |
399,655 |
480,513 |
561,372 |
642,230 |
723,089 |
803,947 |
884,806 |
965,664 |
|
- |
138,840 |
219,698 |
300,557 |
381,415 |
462,274 |
543,132 |
623,991 |
704,849 |
785,708 |
866,566 |
947,425 |
|
|
120,600 |
201,459 |
282,317 |
363,176 |
444,034 |
524,893 |
605,751 |
686,610 |
767,468 |
848,327 |
929,185 |
|
|
102,361 |
183,220 |
264,078 |
344,937 |
425,795 |
506,654 |
587,512 |
668,371 |
749,229 |
830,088 |
910,946 |
|
|
84,081 |
164,980 |
245,839 |
326,697 |
407,556 |
488,414 |
569,273 |
650,131 |
730,990 |
811,848 |
892,707 |
|
|
65,780 |
146,741 |
227,599 |
308,458 |
389,316 |
470,175 |
551,033 |
631,892 |
712,750 |
793,609 |
874,467 |
|
|
47,480 |
128,490 |
209,360 |
290,218 |
371,077 |
451,935 |
532,794 |
613,652 |
694,511 |
775,369 |
856,228 |
|
|
29,324 |
110,201 |
191,120 |
271,979 |
352,837 |
433,696 |
514,555 |
595,413 |
676,272 |
757,130 |
837,989 |
|
A more complete set of sensitivity tables are available within the PEA.
MINING
The geometry and depth of the mineralisation identified at Piskanja lends itself to an underground mining method. It is envisaged that mining will be by cut and fill method and that the key underground infrastructure will comprise:
-
twin access declines from surface to the deposit: i) Main Haulage Decline (“MHD”) from surface to the floor of
Mineralized Zone 1 and ii) Main Ventilation Decline (“MVD”) from surface to the roof ofMineralized Zone 3 ; - an underground spiral ramp connecting MHD and MVD and enabling access to all levels;
- a shaft connecting MHD and MVD to serve as an ore pass and temporary stockpile (if needed);
-
footwall drives located below seam horizons of
Mineralized Zone 1 ,Mineralized Zone 2 andMineralized Zone 3 ; - level drives and ventilation connections between three footwall drives.
The PEA envisages a Run of Mine (ROM) average annual tonnage of 307,956 tonnes to produce some 261,821 tonnes of sale grade colemanite and 25,000 tonnes of boric acid for a period of 17 years.
Excavation is currently proposed by mechanical cutting using Continuous Miners (“CM”). The rationale of the application of mechanical cutting, as opposed to drill and blast operations, is the need to minimize ground vibrations which may affect the residential structures and cause annoyance to the residents of the nearby village, Korlace. Similarly, the application of any caving mining methods or any mining methods which could cause ground subsidence is, at present moment, excluded from further considerations.
Material mined by the CMs would be hauled by shuttles or battery haulers to the nearest ore pass/ore bin and fed to the panel conveyor at the main haulage horizon. The panel conveyor would then haul the mined material to the main ore pass/ore bunker. The main ore pass has two functions: i) to reduce the mined material tonnes to the Main Haulage Decline and feed it to the Main belt conveyor and ii) to serve as a temporary ore storage/stockpile. Once fed to the main belt conveyor, the material is conveyed to the surface and fed to the ore processing system.
In order to achieve an overall planned mining recovery of
PROCESSING
All ROM production is to be fed to the Colemanite Plant for colemanite production with the aim of upgrading mined materials to desired concentrate levels of B2O3. A constant product grade of
The operating plan calls for the production of both colemanite concentrate and boric acid, the latter at a rate of 25 ktpa, and the former at a rate of approximately 250 ktpa. This production scenario has been modelled according to the process route shown in block form. It should be noted that further metallurgical test work is required to finalize the process flowsheet. However, the process flowsheet for B2O3 mineralized material beneficiation is well documented, shows that the process utilizes “off the shelf” technology, and is in fact commonly deployed in Turkish boron mines.
According to available data from
The production of boric acid is also a well-documented process with readily available technology used by several producers globally.
CAPITAL and OPERATING COSTS
A breakdown of the capital and operating costs used in the economic analysis is presented in the tables below.
Project Capital Costs [expended over a 24 month development period]
|
Base Cost |
Contingency |
Total |
|
|
|
|
Mining |
39,400 |
11,820 |
51,220 |
Processing - Colemanite |
2,000 |
600 |
2,600 |
Processing - Boric Acid |
- |
- |
- |
Infrastructure |
16,250 |
4,875 |
21,225 |
Tailings |
3,814 |
1,144 |
4,957 |
Total |
61,464 |
18,439 |
79,903 |
Unit Operating Costs (USD/t)
|
Colemanite |
Boric Acid |
Mining |
70.8 |
- |
Processing - Colemanite |
3.6 |
6.4 |
Processing - BA Plant |
1.7 |
205.8 |
Tailings/Waste Disposal |
0.1 |
0.5 |
Infrastructure |
4.3 |
6.4 |
G&A |
23.5 |
34.6 |
Royalty |
25.0 |
35.0 |
Sales/Marketing |
1.5 |
1.5 |
Tax |
23.9 |
50.4 |
Unit Costs per tonne of production |
154.5 |
340.7 |
The PEA is the culmination of years of hard work by the team at
KEY CONCLUSIONS
Exploration activities undertaken by Erin to date, in conjunction with the results of previous exploratory works, have outlined a significant boron minerals deposit which, in the opinion of the PEA Author, justifies further activities. Future activities should be undertaken in order to assess the potential of project development and, ultimately, mine construction.
The PEA reports a Mineral Resource estimate for the Project which includes a combined Measured and Indicated Mineral Resource of 6.87 Mt with a mean grade of
The report shows the potential of the project by demonstrating a post-tax NPV for the Project at a
It should be noted that there is a significant amount of future work to be undertaken in order to mitigate the risks before entering the mine construction phase. The authors of this PEA recommended appropriate actions and activities needed to properly assess and address these associated risks.
A future work program will be discussed with Erin in order to define the necessary steps towards the PFS stage, FS stage and ultimately, the mine construction phase in accordance with Serbian regulatory requirements and international standards, but also to define a set of decision-making milestones to assist in determining that the advancement of the project continues to be warranted.
RECOMMENDATIONS
Recommendations for work that may potentially lead to further improvements to the Project include:
- Expansion and improvement of the existing Piskanja Mineral Resource Estimate through further exploration and close-spaced drilling in the two unbounded directions
- Improvement and refinement of metallurgical recoveries and processes through further metallurgical test work
- Continued evaluation of different project operating scales (“right sizing”) and optimization of mine plans
- Evaluation and incorporation of existing technologies to improve sustainability and reduce environmental impact
- Additional test work to define geotechnical parameters of the rock mass
- Additional modelling or model refining (geotechnical, structural, resource, economical) as an aid to appropriate mine design
- A comprehensive environmental impact assessment
- A demonstration of mitigation measures
CAUTIONARY NOTE
The PEA summarized in this news release is considered preliminary in nature, contains numerous assumptions and includes Inferred Mineral Resources that are considered too speculative, geologically, to have the economic considerations applied to them that would enable them to be categorized as Mineral Reserves. There is no certainty that the results of the PEA will be realized. No Mineral Reserves have been estimated for Piskanja. Mineral Resources are not Mineral Reserves and do not have demonstrated economic viability. Inferred Mineral Resources are that part of the Mineral Resource for which quantity and grade or quality are estimated on the basis of limited geologic evidence and sampling, which is sufficient to imply but not verify grade or quality continuity. Inferred Mineral Resources may not be converted to mineral reserves. It is reasonably expected, though not guaranteed, that the majority of Inferred Mineral Resources could be upgraded to Indicated Mineral Resources with continued exploration. Mineral Resources are captured within an optimized mine plan (within the constraints of a PEA) and meet the test of reasonable prospects for economic extraction.
The effective date of the PEA is
QUALIFIED PERSONS
James E Wallis,
Prof. Miodrag Banješević PhD.
The PEA will be available at the Company’s filed documents at www.sedar.com within 45 days of the date of this release.
On behalf of the Board of Directors,
About
Pursuant to the Option Agreement,
All public filings for the Company can be found on the SEDAR website www.sedar.com. For more information about the Company, please visit www.temasresources.com.
Cautionary Note Regarding Forward-Looking Statements
This news release contains forward-looking statements and forward-looking information (collectively, “forward-looking statements”) within the meaning of applicable Canadian and
Forward-looking statements involve known and unknown risks, uncertainties and other factors which may cause the actual results, performance or achievements of the Company to differ materially from any future results, performance or achievements expressed or implied by the forward-looking information. Such risks and other factors include, among others, requirements for additional capital, operating and technical difficulties in connection with mineral exploration and development activities, actual results of exploration activities, including on the Piskanja project, the estimation or realization of mineral reserves and mineral resources, and there is no guarantee that such interests, will be certain, the timing and amount of estimated future production, the costs of production, capital expenditures, the costs and timing of the development of new deposits, requirements for additional capital, future prices of boron, changes in general economic conditions, changes in the financial markets and in the demand and market price for commodities, lack of investor interest in future financings, accidents, labour disputes and other risks of the mining industry, delays in obtaining governmental approvals (including of the
Readers are cautioned not to place undue reliance on forward-looking statements. The Company does not undertake any obligation to update any of the forward-looking statements in this news release or incorporated by reference herein, except as otherwise required by law.
Cautionary Note to
As a result of the adoption of the SEC Modernization Rules, the
U.S. investors are cautioned that while the foregoing terms are “substantially similar” to corresponding definitions under the CIM Standards, there are differences in the definitions under the SEC Modernization Rules and the CIM Standards. Accordingly, there is no assurance any mineral resources that Temas may report as “measured mineral resources”, “indicated mineral resources” and “inferred mineral resources” under NI 43-101 would be the same had
In accordance with Canadian securities laws, estimates of “inferred mineral resources” cannot form the basis of feasibility or other economic studies, except in limited circumstances where permitted under NI 43-101.
NEITHER THE CSE NOR ITS REGULATION SERVICES PROVIDER (AS THAT TERM IS DEFINED IN THE POLICIES OF THE
View source version on businesswire.com: https://www.businesswire.com/news/home/20220627005799/en/
For further information or investor relations inquiries:
President and CEO
E-mail: michael@temasresources.com
Tel: 647-477-2382
or
Vice President
Email: dave@howardgroupinc.com
Tel: 403-410-7907
Toll Free: 1-888-221-0915
Source: