S&P 500 Buybacks Decline 4.0% but Energy Buybacks increase 64.5%; Proforma Buyback Tax Would Have Reduced Operating Earnings by 0.46%
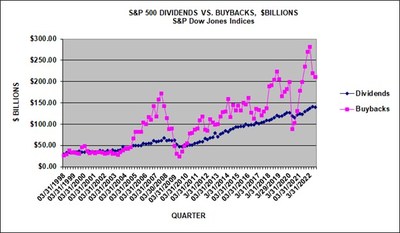
S&P Dow Jones Indices reported preliminary Q3 2022 buybacks for the S&P 500 at $210.8 billion, down 4.0% from $219.6 billion in Q2 2022 and 10.1% from $234.6 billion in Q3 2021. 319 companies executed buybacks, a decrease from 331 in Q2 2022. Financials rose 8.5% from Q2, but were 62.8% lower than Q3 2021. Energy saw a significant increase of 64.5% from Q2. Q3 dividends declined 0.2% to $140.3 billion, while total returns fell 2.5% to $351.2 billion.
- Energy sector buybacks increased by 640% year-over-year to $22.0 billion.
- Total shareholder returns over the 12-months reached a record $1.534 trillion, up from $1.241 trillion in 2021.
- Overall buyback expenditures decreased by 10.1% year-over-year.
- Financials sector buybacks dropped by 62.8% compared to Q3 2021.
- S&P 500 Q3 2022 buybacks were
$210.8 billion , down4.0% from Q2 2022's$219.6 billion , as participation declined - Financials increased
8.5% from Q2, but remained down62.8% from Q3 2021, as Energy went up64.5% from Q2 and up640% from Q3 2021 - On a proforma basis, the new net buyback
1% excise tax, which starts in 2023, would have reduced Q3 2022 operating earnings by0.46%
NEW YORK, Dec. 19, 2022 /PRNewswire/ -- S&P Dow Jones Indices ("S&P DJI") announced today preliminary S&P 500® stock buybacks, or share repurchases, data for Q3 2022.
Historical data on S&P 500 buybacks are available at www.spdji.com/indices/equity/sp-500.
Key Takeaways:
- Q3 2022 share repurchases were
$210.8 billion , down4.0% from Q2 2022's$219.6 billion expenditure and down10.1% from Q3 2021's$234.6 billion . - 319 companies reported buybacks of at least
$5 million for the quarter, down from 331 in Q2 2022 and up from 309 in Q3 2021; 384 companies did some buybacks for the quarter, the same as in Q2 2022 and up from 371 in Q3 2021; 441 companies did some buybacks for the 12-months ending September 2022, up from 424 in the prior 2021 period. - Buybacks remained top heavy with the top 20 companies accounting for
49.0% of Q3 2022 buybacks, an increase from Q2 2022's46.8% , but down from the53.8% in Q3 2021, and up from the pre-COVID historical average of44.5% . - For the 12-months ending September 2022, buybacks were
$981.6 billion , down from the record$1.00 5 trillion posted for the June 2022 period, and up from the$742.2 billion spent in the September 2021 time period. 21.2% of companies reduced share counts used for earnings-per-share (EPS) by at least4% year-over-year, up from Q2 2022's19.8% and Q3 2021's7.4% , and down from the pre-COVID Q3 2019 rate of22.8% .- S&P 500 Q3 2022 dividends decreased
0.2% to$140.3 billion from Q2 2022's record$140.6 billion and were7.9% greater than the$130.0 billion in Q3 2021. For the 12-months ending September 2022, dividends were a record$552.4 billion , up10.7% on an aggregate basis from the 12-month's September 2021's$498.9 billion . - Total shareholders return of buybacks and dividends declined to
$351.2 billion in Q3 2022, down2.5% from Q2 2022's$360.2 billion and down3.7% from Q3 2021's$364.7 billion . - Total shareholder returns for the 12-months ending September 2022 increased to a record
$1.53 4 trillion from the September 2021$1.24 1 trillion. - On a proforma basis, the new
1% excise tax on net buybacks, which will start in 2023, would have reduced the Q3 2022 S&P 500 operating earnings by0.46% and as reported GAAP earnings by0.52% ; for 2021 it would have reduced operating by0.45% and as reported GAAP by0.47% .
"Companies, led by Financials, continued to pull back from their Q1 record-breaking buyback expenditures. However, energy has reentered the market at a time when the sector's shares are up substantially for the year," said Howard Silverblatt, Senior Index Analyst at S&P Dow Jones Indices. "The math of lower stock prices has resulted in more shares repurchased with
On a proforma basis, the new
Silverblatt added: "While going from zero to anything is the biggest increase, the
Information Technology continued to lead in buybacks, as its percentage of buybacks and aggregate expenditures decreased. In Q3 2022, IT's share decreased to
Financials increased their buybacks after last quarter's significant pull back, as their Q3 2022 expenditures increased
Energy continued to increase their buybacks, as they increased their expenditures by
Health Care buybacks increased
The five issues with the highest total buybacks for Q3 2022 are:
- Apple (AAPL): continued to be the poster child for buybacks as it once again spent the most of any issue, with its Q3 2022 expenditure ranking as the third highest in S&P 500 history. For the quarter, the company spent
$24.7 billion , up0.7% from Q2 2022's$24.6 billion . Apple holds 18 of the top 20 record quarters (Meta Platforms holds #11 and QUALCOMM holds #12). For the 12-months ending September 2022, Apple spent$95.6 billion on buybacks, up from the prior 12-month's$92.5 billion . Over the five-year period, they have spent$409.1 billion and$582.0 billion over the ten-year period. - Alphabet (GOOG/L): was next with
$15.4 billion for Q3 2022, up from$15.2 billion in Q2 2022; the 12-month September 2022 expenditure was$57.4 billion versus the 12-month September 2021 expenditure of$44.7 billion . - Meta Platforms (META):
$7.4 billion for Q3 2022, up from$6.2 billion in Q2 2022; the 12-month September 2022 expenditure was$45.6 billion versus$31.5 billion . - Microsoft (MSFT):
$5.6 billion for Q3 2022, down from$8.8 billion in Q2 2022; the 12-month September 2022 expenditure was$30.6 billion versus$28.3 billion . - Exxon Mobile (XOM): returning to the top five for the first time since Q3 2014, the former poster child of buybacks spent
$4.5 billion in Q3 2022, up from$3.9 billion in Q2 2022 and nothing in Q3 2021; the 12-month September 2022 expenditure was$10.6 billion versus$0.1 billion .
For more information about S&P Dow Jones Indices, please visit www.spdji.com.
S&P Dow Jones Indices | ||||||||
S&P 500, $ U.S. BILLIONS | (preliminary in bold) | |||||||
PERIOD | MARKET | OPERATING | AS REPORTED | DIVIDEND & | ||||
VALUE | EARNINGS | EARNINGS | DIVIDENDS | BUYBACKS | DIVIDEND | BUYBACK | BUYBACK | |
$ BILLIONS | $ BILLIONS | $ BILLIONS | $ BILLIONS | $ BILLIONS | YIELD | YIELD | YIELD | |
12 Mo Sep,'22 Prelim. | 1.83 % | 3.26 % | 5.09 % | |||||
12 Mo Sep,'21 | 1.37 % | 2.03 % | 3.40 % | |||||
2021 | 1.27 % | 2.18 % | 3.45 % | |||||
2020 | 1.53 % | 1.64 % | 3.17 % | |||||
2019 | 1.81 % | 2.72 % | 4.54 % | |||||
2018 | 2.17 % | 3.84 % | 6.01 % | |||||
9/30/2022 Prelim. | 1.83 % | 3.26 % | 5.09 % | |||||
6/30/2022 | 1.70 % | 3.15 % | 4.85 % | |||||
3/31/2022 | 1.37 % | 2.57 % | 3.94 % | |||||
12/31/2021 | 1.27 % | 2.18 % | 3.45 % | |||||
9/30/2021 | 1.37 % | 2.03 % | 3.40 % | |||||
6/30/2021 | 1.33 % | 1.68 % | 3.01 % | |||||
3/31/2021 | 1.43 % | 1.48 % | 2.91 % | |||||
12/31/2020 | 1.53 % | 1.64 % | 3.17 % | |||||
9/30/2020 | 1.75 % | 2.05 % | 3.80 % | |||||
6/30/2020 | 1.93 % | 2.52 % | 4.45 % | |||||
3/31/2020 | 2.31 % | 3.37 % | 5.68 % | |||||
12/31/2019 | 1.81 % | 2.72 % | 4.54 % | |||||
9/30/2019 | 1.94 % | 3.12 % | 5.06 % | |||||
6/28/2019 | 1.93 % | 3.27 % | 5.20 % | |||||
3/29/2019 | 1.97 % | 3.49 % | 5.45 % | |||||
12/31/2018 | 2.17 % | 3.84 % | 6.01 % | |||||
9/30/2018 | 1.81 % | 2.93 % | 4.75 % |
S&P Dow Jones Indices | |||||||
S&P 500 SECTOR BUYBACKS | |||||||
SECTOR $ MILLIONS | Q3,'22 | Q2,'22 | Q3,'21 | 12MoSep,'22 | 12MoSep,'21 | 5-YEARS | 10-YEARS |
Consumer Discretionary | |||||||
Consumer Staples | |||||||
Energy | |||||||
Financials | |||||||
Healthcare | |||||||
Industrials | |||||||
Information Technology | |||||||
Materials | |||||||
Real Estate | |||||||
Communication Services | |||||||
Utilities | |||||||
TOTAL | |||||||
SECTOR BUYBACK MAKEUP % | Q3,'22 | Q2,'22 | Q3,'21 | 12MoSep,'22 | 12MoSep,'21 | 5-YEARS | 10-YEARS |
Consumer Discretionary | 9.27 % | 12.58 % | 8.76 % | 10.83 % | 8.69 % | 9.71 % | 12.16 % |
Consumer Staples | 5.37 % | 4.85 % | 3.55 % | 4.40 % | 4.80 % | 4.43 % | 6.15 % |
Energy | 10.44 % | 6.09 % | 1.27 % | 5.25 % | 0.73 % | 3.05 % | 3.66 % |
Financials | 10.92 % | 9.66 % | 26.39 % | 15.33 % | 20.57 % | 19.36 % | 18.23 % |
Healthcare | 9.56 % | 7.83 % | 6.89 % | 10.22 % | 9.34 % | 11.02 % | 11.83 % |
Industrials | 8.12 % | 8.12 % | 7.49 % | 7.74 % | 7.17 % | 8.08 % | 9.93 % |
Information Technology | 28.82 % | 32.76 % | 28.15 % | 28.44 % | 32.51 % | 31.85 % | 29.00 % |
Materials | 2.69 % | 3.97 % | 2.24 % | 3.17 % | 2.23 % | 2.25 % | 2.39 % |
Real Estate | 0.38 % | 0.51 % | 0.12 % | 0.38 % | 0.20 % | 0.38 % | 0.28 % |
Communication Services | 14.37 % | 13.40 % | 15.01 % | 13.97 % | 13.59 % | 9.54 % | 6.09 % |
Utilities | 0.07 % | 0.21 % | 0.13 % | 0.28 % | 0.17 % | 0.33 % | 0.29 % |
TOTAL | 100.00 % | 100.00 % | 100.00 % | 100.00 % | 100.00 % | 100.00 % | 100.00 % |
S&P Dow Jones Indices | ||||||||||
S&P 500 20 LARGEST Q3 2022 BUYBACKS, $ MILLIONS | ||||||||||
Company | Ticker | Sector | Q3 2022 | Q2 2021 | Q3 20221 | 12-Months | 12-Months | 5-Year | 10-Year | Indicated |
Buybacks | Buybacks | Buybacks | Sep,'22 | Sep,'21 | Buybacks | Buybacks | Dividend | |||
$ Million | $ Million | $ Million | $ Million | $ Million | $ Million | $ Million | $ Million | |||
Apple | AAPL | Information Technology | ||||||||
Alphabet | GOOGL | Communication Services | ||||||||
Meta Platforms | META | Communication Services | ||||||||
Microsoft | MSFT | Information Technology | ||||||||
Exxon Mobil | XOM | Energy | ||||||||
Procter & Gamble | PG | Consumer Staples | ||||||||
Lowe's Companies | LOW | Consumer Discretionary | ||||||||
Marathon Petroleum | MPC | Energy | ||||||||
NVIDIA | NVDA | Information Technology | ||||||||
Chevron | CVX | Energy | ||||||||
Comcast | CMCSA | Communication Services | ||||||||
Cigna | CI | Health Care | ||||||||
Walmart | WMT | Consumer Staples | ||||||||
ConocoPhillips | COP | Energy | ||||||||
Morgan Stanley | MS | Financials | ||||||||
S&P Global | SPGI | Financials | ||||||||
Charter Commun | CHTR | Communication Services | ||||||||
Johnson & Johnson | JNJ | Health Care | ||||||||
Visa | V | Information Technology | ||||||||
Union Pacific | UNP | Industrials | ||||||||
Top 20 | ||||||||||
S&P 500 | ||||||||||
Top 20 % of S&P 500 | 49.03 % | 41.34 % | 35.39 % | 39.95 % | 39.08 % | 32.40 % | 27.07 % | 19.02 % | ||
Gross values are not adjusted for float | ||||||||||
S&P Dow Jones Indices | ||||
S&P 500 Q3 2022 Buyback Report | ||||
SECTOR | DIVIDEND | BUYBACK | COMBINED | |
YIELD | YIELD | YIELD | ||
Consumer Discretionary | 1.03 % | 3.17 % | 4.20 % | |
Consumer Staples | 2.56 % | 1.87 % | 4.43 % | |
Energy | 3.66 % | 3.26 % | 6.92 % | |
Financials | 2.14 % | 4.00 % | 6.14 % | |
HealthCare | 1.60 % | 1.93 % | 3.53 % | |
Industrials | 1.69 % | 2.70 % | 4.39 % | |
Information Technology | 1.12 % | 3.20 % | 4.32 % | |
Materials | 2.06 % | 3.46 % | 5.52 % | |
Real Estate | 3.38 % | 0.41 % | 3.79 % | |
Communications Services | 1.40 % | 7.01 % | 8.41 % | |
Utilities | 3.00 % | 0.27 % | 3.27 % | |
S&P 500 | 1.75 % | 3.02 % | 4.76 % | |
Uses full values (unadjusted for float) | ||||
Dividends based on indicated; buybacks based on the last 12-months ending Q3,'22 | ||||
Share Count Changes | ||
(Y/Y diluted shares used for EPS) | >= | <=- |
Q3 2022 | 7.21 % | 21.24 % |
Q2 2022 | 8.42 % | 19.84 % |
Q1 2022 | 7.62 % | 17.64 % |
Q4 2021 | 10.06 % | 14.89 % |
Q3 2021 | 10.22 % | 7.41 % |
Q2 2021 | 11.02 % | 5.41 % |
Q1 2021 | 10.40 % | 5.80 % |
Q4 2020 | 9.02 % | 6.01 % |
Q3 2020 | 8.62 % | 9.62 % |
Q2 2020 | 8.60 % | 17.80 % |
Q1 2020 | 8.00 % | 19.60 % |
Q4 2019 | 7.63 % | 20.68 % |
Q3 2019 | 8.62 % | 22.85 % |
S&P Dow Jones Indices is the largest global resource for essential index-based concepts, data and research, and home to iconic financial market indicators, such as the S&P 500® and the Dow Jones Industrial Average®. More assets are invested in products based on our indices than products based on indices from any other provider in the world. Since Charles Dow invented the first index in 1884, S&P Dow Jones Indices has been innovating and developing indices across the spectrum of asset classes helping to define the way investors measure and trade the markets.
S&P Dow Jones Indices is a division of S&P Global (NYSE: SPGI), which provides essential intelligence for individuals, companies, and governments to make decisions with confidence. For more information, visit: www.spdji.com.
S&P Dow Jones Indices Media Contacts:
April Kabahar
(+1) 917 796 3121
april.kabahar@spglobal.com
Lauren Davis
(+1) 484 269 7118
lauren.davis@spglobal.com
S&P Dow Jones Indices Index Services:
Howard Silverblatt
Senior Index Analyst
(+1) 973 769 2306
howard.silverblatt@spglobal.com
![]() View original content to download multimedia:https://www.prnewswire.com/news-releases/sp-500-buybacks-decline-4-0-but-energy-buybacks-increase-64-5-proforma-buyback-tax-would-have-reduced-operating-earnings-by-0-46-301706117.html
View original content to download multimedia:https://www.prnewswire.com/news-releases/sp-500-buybacks-decline-4-0-but-energy-buybacks-increase-64-5-proforma-buyback-tax-would-have-reduced-operating-earnings-by-0-46-301706117.html
SOURCE S&P Dow Jones Indices