DAT Truckload Volume Index: Freight volumes cooled in September
- Spot rates dipped to mid-2020 levels.
- The spot van rate averaged $2.11 per mile in September, up 2 cents compared to August.
- The contract van rate increased 2 cents to $2.59 per mile.
- Freight volumes decreased due to seasonally declining shipments of retail goods and fresh produce.
- Diesel prices increased for the fourth straight month.
Insights
Analyzing...

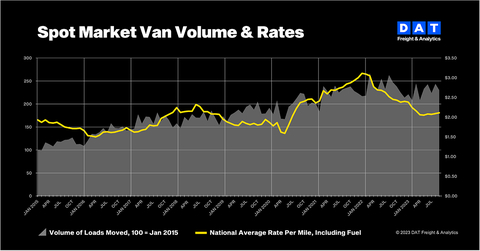
DAT Truckload Volume Index: Freight volumes cooled in September (Graphic: DAT Freight & Analytics)
Seasonally declining shipments of retail goods and fresh produce decreased demand for truckload services last month. The DAT Truckload Volume Index (TVI) fell for all three equipment types in September:
-
Van TVI: 230,
5.7% lower compared to August -
Refrigerated TVI: 167, down
6.2% -
Flatbed TVI: 245, down
9.3%
Van and refrigerated (“reefer”) indexes were almost
Spot rates dipped to mid-2020 levels
While volumes declined, diesel prices increased for the fourth straight month. Spot line-haul rates, which subtract an amount equal to an average fuel surcharge, dipped to their lowest points since June 2020:
-
Line-haul van rate:
$1.56 1 cent -
Line-haul reefer rate:
$1.92 2 cents -
Line-haul flatbed rate:
$1.85 4 cents
DAT’s broker-to-carrier benchmark spot rates increased as carriers negotiated to recover fuel expenses. The spot van rate averaged
Van, reefer ratios declined
DAT’s national average van and reefer load-to-truck ratios slipped in September. Load-to-truck ratios measure the number of loads posted to the DAT One marketplace relative to the number of trucks. Changes in the ratio typically reflect the pricing environment for truckload services on the spot market:
- Van ratio: 2.8, unchanged from August
- Reefer ratio: 3.4, down from 4.4
- Flatbed ratio: 6.9, up from 6.0
DAT benchmark rates for contracted freight rose slightly compared to August. The contract van rate increased
“Seasonality took hold in September,” said Ken Adamo, DAT Chief of Analytics. “Retailers had not yet replenished inventory ahead of the holidays, produce season was winding down and construction shipments slowed. At the same time, there were no disruptive events to push freight to the spot market. Hurricane season has been mild, and our data showed the United Auto Workers strike had little impact on freight movements in September.”
About the DAT Truckload Volume Index
The DAT Truckload Volume Index reflects the change in the number of loads with a pickup date during that month; the actual index number is normalized each month to accommodate any new data sources without distortion. A baseline of 100 equals the number of loads moved in January 2015, as recorded in DAT RateView, a truckload pricing database and analysis tool with rates paid on an average of 3 million loads per month.
Spot truckload rates are negotiated for each load and paid to the carrier by a freight broker. National average spot rates are derived from payments to carriers by freight brokers, third-party logistics providers and other transportation buyers for hauls of 250 miles or more with a pickup date during the month reported. DAT’s rate analysis is based on
About DAT Freight & Analytics
DAT Freight & Analytics operates the largest truckload freight marketplace in
Founded in 1978, DAT is a business unit of Roper Technologies (Nasdaq: ROP), a constituent of the S&P 500 and Fortune 1000 indices.
View source version on businesswire.com: https://www.businesswire.com/news/home/20231018639964/en/
Annabel Reeves
Corporate Communications, DAT Freight & Analytics
PR@dat.com / annabel.reeves@dat.com; 503-501-0143
Stephen Petit
SiefkesPetit Communications
425-443-8976
Source: DAT Freight & Analytics


