U.S. Winter Season Maintains Fall Season Strength, Radian Home Price Index Reveals
In February, home prices across the United States rose at a faster pace than the month prior (January 2021) and continued to appreciate at higher than 2020 average monthly rates. According to Radian Home Price Index (HPI) data released today by Red Bell Real Estate, LLC, a Radian Group Inc. company (NYSE: RDN), home prices nationally rose from the end of January 2021 to the end of February 2021 at an annualized rate of 8.2 percent. The company believes the Radian HPI is the most comprehensive and timely measure of U.S. housing market prices and conditions available in the market today.

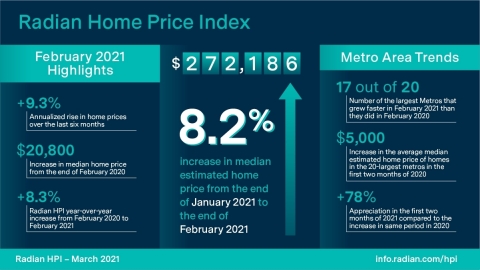
Radian Home Price Index (HPI) Infographic March 2021 (Graphic: Business Wire)
February 2020 was the last month before pandemic-related shutdowns were implemented nationally. One year past that transition, home prices have shown tremendous resiliency in aggregate. The Radian HPI rose 8.3 percent year-over-year (February 2020 to February 2021). In comparison, the year-over-year period from February 2019 through February 2020 recorded a 7.4 percent increase in home prices nationally. The Radian HPI is calculated based on the estimated values of more than 70 million unique addresses each month, covering all single-family property types and geographies.
“It is crystal clear that home values have withstood the most severe pandemic in generations. While the general economy struggled and unemployment rose, millions of Americans saw their property wealth increase during a time of great personal and economic stress,” noted Steve Gaenzler, SVP of Data and Analytics. The average homeowner in the U.S. gained more than
NATIONAL DATA AND TRENDS
-
Median home price in the U.S. rose to
$272,186 - Home prices rose an annualized 9.3 percent over the last six months
Nationally, the median estimated price for single-family and condominium homes rose to
Housing markets continue to be buoyed by on-going imbalances between housing supply and demand. February 2021 continued a streak of records broken. In fact, February 2021 set both the record for lowest number of active listing in any February, as well as the highest number of sales in a February. Moreover, the absorption of inventory was brisk. The number of sales equated to 27 percent of the number of active listings, suggesting a very strong demand for inventory.
REGIONAL DATA AND TRENDS
- February gains were solid across nearly all regions
- Midwest softened while Southwest and West showed strongest gains
Similar to the national reporting, all U.S. regions reported positive price appreciation in residential markets in February 2021. The MidAtlantic and Northeast were particularly resilient in what are normally down months for housing activity. While their appreciation rates were comparable to those recorded over the last four months, it is more common to see some slowing of appreciation during winter months in these markets. The Midwest did record the weakest Regional appreciation rate and was weaker than prior months. The Southwest and West regions captured the top performing Regions in February.
At the state level, home price appreciation was positive in all 50 states and the District of Columbia, however 20 of the 51 states reported slower monthly appreciation in February when compared to the prior month. Momentum of home price appreciation differs by state.
METROPOLITAN AREA DATA AND TRENDS
- Metropolitan areas outpaced prior year
- 2021 starting off strong for large metro areas
All the 20-largest metro areas of the U.S. reported positive price appreciation in February as compared to January 2021. Three metros -- New York, Philadelphia, and Boston -- recorded slower annualized price appreciation month-over-month. What is striking, however, is that 17 of the 20 largest metros report higher rates of appreciation than in the month prior to the onset of the COVID pandemic in the U.S in 2020. These metros grew faster in February 2021 than they did in February of 2020. To put that in perspective, the start of 2020 was the strongest on record post the Great Recession as housing markets were very strong prior to the pandemic and reflects the broad strength of housing market prices.
In just the first two months of 2021, the average median estimated price of homes in the 20-largest metros is higher by almost
ABOUT THE RADIAN HPI
Red Bell Real Estate, LLC, a subsidiary of Radian Group Inc., provides national and regional indices for download at radian.com/hpi, along with information on how to access the full library of indices.
Additional content on the housing market can also be found on the Radian Insights page located at https://radian.com/news-and-knowledge/insights.
Red Bell offers the Radian HPI data set along with a client access portal for content visualization and data extraction. The engine behind the Radian HPI has created more than 100,000 unique data series, which are updated on a monthly basis.
The Radian HPI Portal is a self-service data and visualization platform that contains a library of thousands of high-value indices based on both geographic dimensions as well as by market, or property attributes. The platform provides monthly updated access to nine different geographic dimensions, from the national level down to zip codes. In addition, the Radian HPI provides unique insights into market changes, conditions and strength across multiple property attributes, including bedroom count and livable square footage. To help enhance its customers’ understanding of granular real estate markets, the library is expanded regularly to include more insightful indices.
In addition to the services offered by its Red Bell subsidiary, Radian is ensuring the American dream of homeownership responsibly and sustainably through products and services that include industry-leading mortgage insurance and a comprehensive suite of mortgage, risk, title, valuation, asset management and other real estate services. The company is powered by technology, informed by data and driven to deliver new and better ways to transact and manage risk. Visit www.radian.com to see how Radian is shaping the future of mortgage and real estate services.
View source version on businesswire.com: https://www.businesswire.com/news/home/20210323005374/en/


