Home Prices Start 4th Quarter Slower, But Just Slightly, Reveals Radian Home Price Index

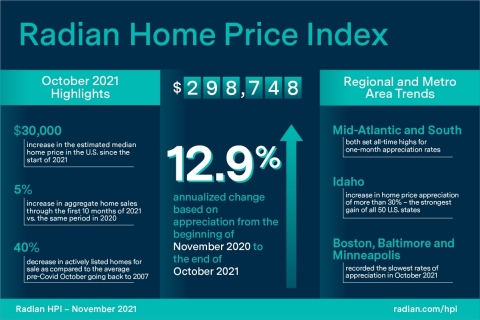
Radian Home Price Index (HPI) Infographic
While the one-month trend was slightly lower, in the twelve months since
“The slowdown in the national appreciation rate in October marks the first month-over-month decline in three quarters. However, the
NATIONAL DATA AND TRENDS
-
Median estimated home price in the
U.S. rose to$298,748 - October records lowest count of active listings for any October, on continued inventory slump
Nationally, the median estimated price for single-family and condominium homes rose to
Nationally, supply and demand remain substantially imbalanced relative to long-term trends. Counts of residential homes listed for sale were significantly lower in October compared to any previous October. In total, the number of actively listed homes for sale was 40 percent lower than the average pre-COVID October going back to 2007, and more than 15 percent lower than October of 2020, the prior low for October listings. On the demand side, closed sales of previously listed properties were down in October marking the fourth consecutive month of falling sales. However, October’s sales counts were the second highest ever for an October month, and absorbed a record 33 percent of the prior month’s aggregate listing counts.
For a calendar year, last year set a record for homes sales volume. Through the first 10 months of 2021, aggregate home sales were 5 percent higher than the same period in 2020, making it likely that 2021 will establish a new record for sales volume in
REGIONAL DATA AND TRENDS
- Most Regions reported lower appreciation rates for house prices in October
- West region records largest decline, while South continues to be strongest
The national experience of slightly slower price appreciation played out similarly across most of the six Regional indices. In October, the annualized price gains from the month prior were lower in four of the six tracked regions. The exceptions to slower rates of appreciation were in the MidAtlantic and South regions which both set all-time highs for one-month appreciation rates. For the remaining four regions, October represented the second strongest appreciation month of the year. Whereas the Midwest region possessed the largest annual increase a year ago, this year the South region holds the title. The South region is the only region to have ever recorded a one-month (annualized) rate of appreciation in excess of 20 percent, and October was the second consecutive month this was achieved.
At the state level, in the last 12 months (
METROPOLITAN AREA DATA AND TRENDS
- Less than half of top cities record faster appreciation in most recent month
- Three of top five cities located in the South region
In October, six of the top 20 metropolitan areas (CBSAs) reported faster appreciation rates than the prior month, with
Looking at the 50 largest cities across the country, 18 of them reported faster appreciation rates in October as compared to a month earlier. Over the past 12 months,
ABOUT THE RADIAN HPI
Additional content on the housing market can also be found on the Radian Insights page located at https://radian.com/news-and-knowledge/insights.
Red Bell offers the Radian HPI data set along with a client access portal for content visualization and data extraction. The engine behind the Radian HPI has created more than 100,000 unique data series, which are updated on a monthly basis.
The Radian HPI Portal is a self-service data and visualization platform that contains a library of thousands of high-value indices based on both geographic dimensions as well as by market, or property attributes. The platform provides monthly updated access to nine different geographic dimensions, from the national level down to zip codes. In addition, the Radian HPI provides unique insights into market changes, conditions and strength across multiple property attributes, including bedroom count and livable square footage. To help enhance customers’ understanding of granular real estate markets, the library is expanded regularly to include more insightful indices.
In addition to the services offered by its Red Bell subsidiary, Radian is ensuring the American dream of homeownership responsibly and sustainably through products and services that include industry-leading mortgage insurance and a comprehensive suite of mortgage, risk, title, valuation, asset management and other real estate services. The company is powered by technology, informed by data and driven to deliver new and better ways to transact and manage risk.
Visit http://www.radian.com to see how Radian is shaping the future of mortgage and real estate services.
View source version on businesswire.com: https://www.businesswire.com/news/home/20211118006245/en/
For Investors
john.damian@radian.com
For the Media
rashi.iyer@radian.com
Source:


