2021 Home Prices Pick Up Right Where 2020 Left Off, Radian Home Price Index Reports
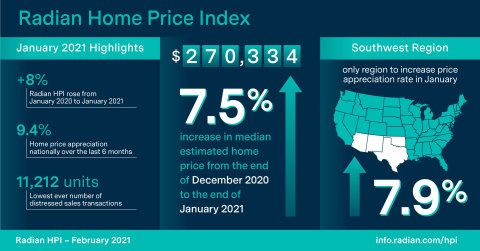
After an historic 2020, the first month of 2021 weakened—albeit just slightly. According to Radian Home Price Index (HPI) data released today by Red Bell Real Estate, LLC, a Radian Group Inc. company (NYSE: RDN), home prices nationally rose from the end of December 2020 to the end of January 2021 at an annualized rate of 7.5 percent. We believe Radian HPI is the most comprehensive and timely measure of U.S. housing market prices and conditions available in the market today.

(Graphic: Business Wire)
For the past twelve months, the Radian HPI rose 8.0 percent (January 2020 to January 2021), unchanged from the prior month’s annualized rate. Over the last six months of the year, home prices nationally appreciated at an annualized rate of 9.4 percent. This represents the fastest rate of 6-month appreciation in more than a year. The Radian HPI is calculated based on the estimated values of more than 70 million unique addresses each month, covering all single-family property types and geographies.
“Home prices picked up in January, about where they left off in December. Home prices across the U.S. were solidly in positive territory once again,” noted Steve Gaenzler, SVP of Data and Analytics. “With elections, inaugurations and the holidays behind us, and vaccinations and modest levels of potential normalcy visible on the horizon, it shouldn’t surprise many that homes prices continue to be a shining star,” added Gaenzler.
NATIONAL DATA AND TRENDS
-
Median home price in the U.S. rose to
$270,334 - Distressed sales and listings at all time low
The national median estimated price for single-family and condominium homes rose to
REGIONAL DATA AND TRENDS
- Southwest was only region to increase price appreciation rate in January
- South region was the strongest last month
While still firmly positive, regionally, five of the six regions had softer home price appreciation in January 2021 compared to the prior month. In January, the Southwest Region (+7.9 percent annualized) was the only region to accelerate price appreciation from December’s strong month. However, it was the South region (+ 8.9 percent annualized) that captured the top position for price growth in January.
A closer look at state level home price appreciation rates in January shows distinct differences by state. States in the West (ID, WA, MT, OR) held four of the top 10 states for positive appreciation, while the South (AL, LA) also fared well. However, these states are smaller components of the housing stock in their respective regions, diminishing their impact on the broader regional indices.
METROPOLITAN AREA DATA AND TRENDS
- Seattle is only large metro to record accelerating price growth in January
- Large metro area’s median price outpaces nation
Across the 20-largest metro areas of the U.S, the start of 2021 resembles the national trend. In 18 of the 20 largest metros, January’s appreciation was the slowest since the third quarter of 2020. In most cases, August was the last time there were similar appreciation rates. This underscores the significant appreciation rates recorded in the fourth quarter as mortgage rates once again fell to all-time lows.
The average median estimated home price of homes in the 20-largest metros ended January at
ABOUT THE RADIAN HPI
Red Bell Real Estate, LLC, a subsidiary of Radian Group Inc., provides national and regional indices for download at info.radian.com/hpi, along with information on how to access the full library of indices.
Additional content on the housing market can also be found on the Radian Insights page located at https://radian.com/news-and-knowledge/insights.
Red Bell offers the Radian HPI data set along with a client access portal for content visualization and data extraction. The engine behind the Radian HPI has created more than 100,000 unique data series, which are updated on a monthly basis.
The Radian HPI Portal is a self-service data and visualization platform that contains a library of thousands of high-value indices based on both geographic dimensions as well as by market, or property attributes. The platform provides monthly updated access to nine different geographic dimensions, from the national level down to zip codes. In addition, the Radian HPI provides unique insights into market changes, conditions and strength across multiple property attributes, including bedroom count and livable square footage. To help enhance customers’ understanding of granular real estate markets, the library is expanded regularly to include more insightful indices.
In addition to the services offered by its Red Bell subsidiary, Radian is ensuring the American dream of homeownership responsibly and sustainably through products and services that include industry-leading mortgage insurance and a comprehensive suite of mortgage, risk, title, valuation, asset management and other real estate services. The company is powered by technology, informed by data and driven to deliver new and better ways to transact and manage risk. Visit www.radian.com to see how Radian is shaping the future of mortgage and real estate services.
View source version on businesswire.com: https://www.businesswire.com/news/home/20210222005857/en/


