OriginClear Continues Revenue and Gross Profit Growth in Q3
Revenue up
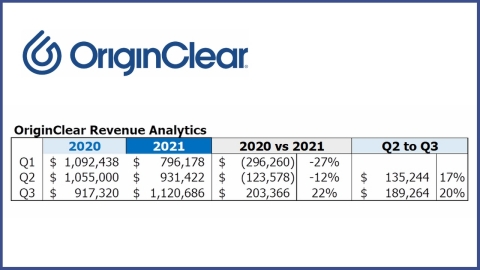
The company reported the following highlights from its recent quarterly report:
- Third Quarter 2021 over Second Quarter 2021:
-
Revenue improved by
20% to$1,120,687 $931,422 -
Gross Profit improved by
87% to$330,351 $176,500 -
Cost of Sales grew by
5% to$790,336 $754,922 -
Operating Losses narrowed to
$(1,323,074) $(1,929,679)
- Third Quarter 2021 over Third Quarter 2020:
-
Revenue improved by
22% to$1,120,687 $917,320 -
Gross Profit improved to
$330,351 $(17,388) -
Cost of Sales improved by
15% to$790,336 $934,708 -
Operating Losses grew to
$(1,323,074) $(1,183,722)
“We are very pleased with the progress of our Progressive Water Treatment and Modular Water Treatment divisions,” said
“The growth of our conventional business is wonderful news,” said
|
||||||||||||||||
CONDENSED CONSOLIDATED STATEMENTS OF OPERATIONS |
||||||||||||||||
FOR THE THREE AND NINE MONTHS ENDED |
||||||||||||||||
(Unaudited) |
||||||||||||||||
|
Three Months Ended |
Nine Months Ended |
||||||||||||||
|
|
|
|
|
||||||||||||
|
|
|
|
|
||||||||||||
Sales |
$ |
1,120,687 |
|
$ |
917,320 |
|
$ |
2,848,287 |
|
$ |
3,064,758 |
|
||||
|
|
|
|
|
||||||||||||
Cost of Goods Sold |
|
790,336 |
|
|
934,708 |
|
|
2,237,282 |
|
|
2,716,582 |
|
||||
|
|
|
|
|
||||||||||||
Gross Profit |
|
330,351 |
|
|
(17,388 |
) |
|
611,005 |
|
|
348,176 |
|
||||
|
|
|
|
|
||||||||||||
Operating Expenses |
|
|
|
|
||||||||||||
Selling and marketing expenses |
|
636,481 |
|
|
339,759 |
|
|
2,201,045 |
|
|
1,053,559 |
|
||||
General and administrative expenses |
|
1,006,041 |
|
|
782,810 |
|
|
2,785,713 |
|
|
1,853,760 |
|
||||
Research and development |
|
- |
|
|
29,334 |
|
|
- |
|
|
83,400 |
|
||||
Depreciation and amortization expense |
|
10,903 |
|
|
14,431 |
|
|
34,034 |
|
|
39,892 |
|
||||
|
|
|
|
|
||||||||||||
Total Operating Expenses |
|
1,653,425 |
|
|
1,166,334 |
|
|
5,020,792 |
|
|
3,030,611 |
|
||||
|
|
|
|
|
||||||||||||
Loss from Operations |
|
(1,323,074 |
) |
|
(1,183,722 |
) |
|
(4,409,787 |
) |
|
(2,682,435 |
) |
||||
|
|
|
|
|
||||||||||||
OTHER INCOME (EXPENSE) |
|
|
|
|
||||||||||||
Other income |
|
356,438 |
|
|
4,001 |
|
|
359,939 |
|
|
12,521 |
|
||||
Impairment of asset for sale |
|
(116,000 |
) |
|
- |
|
|
(116,000 |
) |
|
- |
|
||||
Gain on write off loans payable |
|
151,000 |
|
|
- |
|
|
157,250 |
|
|
- |
|
||||
Gain/(Loss) on conversion of preferred stock |
|
(146,382 |
) |
|
18,066 |
|
|
(1,265,666 |
) |
|
24,129 |
|
||||
Loss on exchange of preferred stock |
|
- |
|
|
- |
|
|
(40,000 |
) |
|
- |
|
||||
Unrealized gain(loss) on investment securities |
|
(8,400 |
) |
|
3,600 |
|
|
32,000 |
|
|
400 |
|
||||
Gain on net change in derivative liability and conversion of debt |
|
19,798,080 |
|
|
6,409,231 |
|
|
(4,146,757 |
) |
|
23,627,793 |
|
||||
Interest expense |
|
(314,547 |
) |
|
(233,010 |
) |
|
(934,942 |
) |
|
(638,077 |
) |
||||
|
|
|
|
|
||||||||||||
TOTAL OTHER (EXPENSE) INCOME |
|
19,720,189 |
|
|
6,201,888 |
|
|
(5,954,176 |
) |
|
23,026,766 |
|
||||
|
|
|
|
|
||||||||||||
NET INCOME (LOSS) |
$ |
18,397,115 |
|
$ |
5,018,166 |
|
$ |
(10,363,963 |
) |
$ |
20,344,331 |
|
||||
|
|
|
|
|
||||||||||||
PREFERRED STOCK DIVIDENDS |
|
- |
|
|
- |
|
|
- |
|
|
- |
|
||||
WARRANTS DEEMED DIVIDENDS |
|
- |
|
|
- |
|
|
(2,037,849 |
) |
|
- |
|
||||
|
|
|
|
|
||||||||||||
NET (LOSS) ATTRIBUTABLE TO SHAREHOLDERS INCOME |
$ |
18,397,115 |
|
$ |
5,018,166 |
|
$ |
(12,401,812 |
) |
$ |
20,344,331 |
|
||||
|
|
|
|
|
||||||||||||
BASIC EARNINGS (LOSS) PER SHARE ATTRIBUTABLE TO SHAREHOLDERS’ |
$ |
0.09 |
|
$ |
0.27 |
|
$ |
(0.08 |
) |
$ |
1.75 |
|
||||
|
|
|
|
|
||||||||||||
DILUTED EARNINGS (LOSS) PER SHARE ATTRIBUTABLE TO SHAREHOLDERS’ |
$ |
0.02 |
|
$ |
0.03 |
|
$ |
(0.08 |
) |
$ |
0.15 |
|
||||
|
|
|
|
|
||||||||||||
WEIGHTED-AVERAGE COMMON SHARES OUTSTANDING, BASIC |
|
197,669,804 |
|
|
18,643,531 |
|
|
147,762,596 |
|
|
11,598,453 |
|
||||
|
|
|
|
|
||||||||||||
DILUTED |
|
795,174,058 |
|
|
146,074,997 |
|
|
147,762,596 |
|
|
139,029,918 |
|
||||
The accompanying notes are an integral part of these unaudited condensed consolidated financial statements.
About
For more information, visit the company’s website: www.OriginClear.com
Follow us on Twitter
Follow us on LinkedIn
Like us on Facebook
Subscribe to us on YouTube
Signup for our Newsletter
OriginClear Safe Harbor Statement:
Matters discussed in this release contain forward-looking statements. When used in this release, the words "anticipate," "believe," "estimate," "may," "intend," "expect" and similar expressions identify such forward-looking statements. Actual results, performance or achievements could differ materially from those contemplated, expressed or implied by the forward-looking statements contained herein.
These forward-looking statements are based largely on the expectations of the Company and are subject to a number of risks and uncertainties. These include, but are not limited to, risks and uncertainties associated with our history of losses and our need to raise additional financing, the acceptance of our products and technology in the marketplace, our ability to demonstrate the commercial viability of our products and technology and our need to increase the size of our organization, and if or when the Company will receive and/or fulfill its obligations under any purchaser orders. Further information on the Company's risk factors is contained in the Company's quarterly and annual reports as filed with the
View source version on businesswire.com: https://www.businesswire.com/news/home/20211118006433/en/
Media Contact
lais@thepontesgroup.com
www.thepontesgroup.com
Investor Relations and Press Contact:
Toll-free: 877-999-OOIL (6645) Ext. 3
International: +1-323-939-6645 Ext. 3
Fax: 323-315-2301
ir@OriginClear.com
www.OriginClear.com
Source: