MAC Copper Limited Announces December 2024 Quarterly Report
Record Quarterly Production and Record Low Cash Cost
ST. HELIER, Jersey--(BUSINESS WIRE)-- MAC Copper Limited (NYSE: MTAL; ASX:MAC)
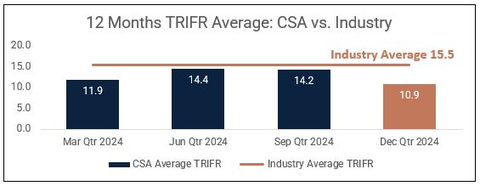
Figure 1 - CSA Copper Mine Recordable Injuries by Quarter (Graphic: Business Wire)
MAC Copper Limited ARBN 671 963 198 (NYSE: MTAL; ASX: MAC), a private limited company incorporated under the laws of Jersey, Channel Islands (“MAC” or the “Company”) is pleased to release its December 2024 quarterly activities report (“Q4 2024” or “December quarter”).
HIGHLIGHTS
Record quarterly production of 11,320 tonnes at a
- Material improvement in TRIFR to 10.9 in Q4 2024 from a TRIFR of 14.2 recorded in Q3 2024
- Strongest quarterly production under MAC’s ownership beating the previous record set in Q2 2024
-
11,320 tonnes of copper produced for Q4 2024 (an
11% increase QoQ) at a grade of4.1% Cu -
C1 of
US /lb1 for Q4 2024 decreased by$1.66 12% (US /lb in Q3 2024), driven by increased production, continued improved cost management and operational efficiencies$1.90 -
41,128 tonnes of copper produced in 2024 (above the mid-point of 2024 production guidance) and an increase of
14% compared to 20232 with an average grade of3.9% and a C1 ofUS /lb for the year$1.92 -
2025 C1 forecast to be positively impacted by3:
-
a circa
70% reduction in TC/RC benchmarks (~US /lb impact) and$0.16 -
operational costs benefits due to the lower A$:US$ exchange rate (+/
-1 US$ cent =US /lb)$0.03
-
a circa
Targeting copper production of >50ktpa by 2026
-
Growing copper production by ~
23% by 20264 with key projects delivering the further step change - Ventilation project – work well underway, advancing with completion targeted by Q3 2026
- QTS South Upper – development commenced in Q4 2024, ore mining expected to commence from Q4 2025
Generating material operational free cash flow
-
Operational free cash flow for Q4 2024 of
~US ($30M ~A ) including sustaining capex$48M -
Sustaining capital expenditure of
~US for Q4 2024 and$12M ~US for 2024$50M
Increased liquidity and balance sheet strength
-
Raised
US ($103M A 5) (before costs) at$150M A per CDI as announced on 9 October 2024$18.00 -
Cash and cash equivalents of
~US ($172M ~A ) after repayment of$276M ~US in senior debt principal$8.3M -
Liquidity of
US ($213M ~A ) includes$340M ~US of outstanding QP receipts,$6.5M ~US of unsold concentrate and the Polymetals (“POL”) investment as at 31 December 2024$5.6M -
POL announced it secured financing to fund it’s mine restart by mid-2025 – the value of MAC’s investment in POL has increased to
A , up more than$6.4M 125% since its initial investment. - Reached agreement with Sprott to repay Mezzanine debt early at MAC’s option from 1 January 2025
ESG UPDATE
Safety
Achieved a Total Recordable Injury Frequency Rate (TRIFR) of 10.9 in Q4 2024 which is a material improvement from an average TRIFR of 14.2 in Q3 2024. This was a positive end to 2024 with no recordable injuries recorded for the quarter.
Total incidents recorded have also reduced significantly during the quarter with increased awareness from extensive training and coaching as well as increased leadership field safety interactions which is having a beneficial effect on safety.
Figure 1 - CSA Copper Mine Recordable Injuries by Quarter6
Sustainability Report
MAC recognizes the importance of our environmental, social and governance responsibilities and that sustainability strategies more broadly is integral to the way we operate and essential to the accomplishment of our goals.
As a result, in 2024 MAC completed a materiality assessment and stakeholder analysis to identify the key environmental, social and governance issues material to the business and important to our stakeholders.
To this end, we will be publishing our inaugural annual sustainability report at the same time as our annual report in Q1 2025 which will provide an overview of our material ESG topics, a summary of current performance and an outline of future activities and initiatives to improve our reporting and disclosures over time. The contents of the sustainability report are not intended to be incorporated by reference into our annual report or in any other report or document we file or furnish with the Securities and Exchange Commission, and any reference to the sustainability report is intended to be an inactive textual reference only.
Regulatory
Progress continues toward submission of the CSA Annual Rehabilitation Report due in April 2025. There have been no reportable environmental incidents during the December 2024 quarter and no reportable environmental incidents for 2024.
Construction activities on the Stage 10 embankment raise have been ongoing in the December 2024 quarter. Works on foundation preparation and development of the key trench within the West Mound have begun. West Mound works are planned for completion in Q1 2025 prior to progressing to the East Mound construction.
PRODUCTION AND COST SUMMARY
Table 1 – Production and cost summary (unaudited)
|
Units |
Q1 2024 |
Q2 2024 |
Q3 2024 |
Q4 2024 |
QoQ
|
Full year
|
Copper Production |
Tonnes |
8,786 |
10,864 |
10,159 |
11,320 |
|
41,128 |
Sustaining capital |
US$ million |
|
|
|
|
( |
|
Cash cost (C1)1 |
US$/lb |
|
|
|
|
( |
|
Total cash cost3 |
US$/lb |
|
|
|
|
( |
|
Group Net Debt4 |
US$ million |
|
|
|
|
( |
|
MAC Copper Limited’s CEO, Mick McMullen, said:
“As a result of our team’s focus on safety, it gives me great pleasure to be able to report that we closed the financial year with a TRIFR of 10.9. This is a material improvement on the previous quarter and represents the heightened awareness and focus of our people benefiting from extensive training and coaching with increased field safety leadership interactions as well. Nothing is more important than the health and well-being of our people, and the communities we are proud to be a part of; safety culture takes time to take effect, and we are now seeing this show up in our TRIFR.
Our CSA Copper Mine operational team delivered another record quarterly production volume for the December quarter, achieving copper production of 11,320 tonnes which is an increase of
This also marks an excellent end to the 2024 year with the CSA Copper mine producing 41,128 tonnes of copper at a low C1 cost of
Furthermore, we have established the platform to grow our Copper production by a further ~
We will provide updated production guidance when we report our revised R+R at the end of February 2025.
As announced on 9 October 2024, MAC raised approximately
The operational performance delivered to date confirms the CSA Copper Mine as a high-quality, free cash flow generating, long life copper asset with capital growth projects unlocking further significant growth in production by 2026. The performance of the site team throughout 2024 has showcased just what this mine can do when operations perform the way we know it can, and the Board and I would like to express our thanks to the entire team for yet another strong performance.
MAC is positioned for growth and further operational improvements to drive costs down from what is already a highly competitive cost position. We have some exciting growth opportunities in the upper parts of the mine and as our drilling continues to expand the mineralized footprint we are pushing the Capital Vent Project hard to unlock our mining potential at the lower levels of the mine.”
OPERATIONAL AND COST UPDATE
Table 2 - Quarterly Operational Performance of the CSA Copper Mine (unaudited)
CSA Copper Mine Metrics (unaudited) |
Units |
Q1 2024 |
Q2 2024 |
Q3 2024 |
Q4 2024 |
QoQ % variance |
2024 |
U/g development – Capital |
Metres |
466 |
449 |
735 |
464 |
( |
2,114 |
U/g development – Operating |
Metres |
703 |
611 |
359 |
449 |
|
2,121 |
Rehab |
Metres |
246 |
113 |
145 |
246 |
|
751 |
Total development |
Metres |
1,415 |
1,173 |
1,239 |
1,159 |
( |
4,986 |
Ore Mined |
Tonnes |
256,031 |
271,469 |
238,937 |
285,613 |
|
1,052,050 |
Tonnes Milled |
Tonnes |
260,297 |
266,936 |
260,953 |
284,490 |
|
1,072,676 |
Copper grade processed |
% |
|
|
|
|
|
|
Copper Recovery |
% |
|
|
|
|
|
|
Copper Produced |
Tonnes |
8,786 |
10,864 |
10,159 |
11,320 |
|
41,128 |
Silver Produced |
Ounces |
102,182 |
134,072 |
112,299 |
114,019 |
|
462,572 |
Copper Sold |
Tonnes |
8,112 |
12,984 |
10,244 |
8,987 |
( |
40,326 |
Achieved Copper price11 |
US$/lb |
3.87 |
4.41 |
4.18 |
4.18 |
|
4.19 |
Achieved Copper price (including hedging) |
US$/lb |
3.81 |
4.24 |
4.04 |
4.02 |
( |
4.06 |
Mining Cost |
US$/t Mined |
|
|
|
|
( |
86.9 |
Processing Cost |
US$/t Milled |
|
|
|
|
( |
27.4 |
G+A Cost |
US$/t Milled |
|
|
|
|
( |
27.7 |
Total Operating Cost |
US$/t milled |
|
|
|
|
( |
142.0 |
Development Cost |
US$/metre |
|
|
|
|
( |
12,625 |
Capital Expenditure12 |
US$ million |
|
|
|
|
( |
50.6 |
Tonnes Milled per employee |
t/employee |
184 |
186 |
174 |
191 |
|
187 |
Mining |
US$/lb prod |
1.27 |
1.04 |
0.92 |
0.86 |
( |
1.01 |
Processing |
US$/lb prod |
0.35 |
0.36 |
0.31 |
0.29 |
( |
0.32 |
General and Admin |
US$/lb prod |
0.44 |
0.28 |
0.32 |
0.28 |
( |
0.33 |
Treatment and refining |
US$/lb prod |
0.17 |
0.26 |
0.23 |
0.19 |
( |
0.22 |
Work in Progress inventory |
US$/lb prod |
(0.14) |
0.03 |
0.02 |
0.00 |
( |
(0.02) |
Freight and other costs |
US$/lb prod |
0.17 |
0.21 |
0.24 |
0.15 |
( |
0.19 |
Silver Credits |
US$/lb prod |
(0.10) |
(0.16) |
(0.14) |
(0.11) |
( |
(0.13) |
C1 Cash Cost |
US$/lb prod |
2.15 |
2.0213 |
1.90 |
1.66 |
( |
1.92 |
Leases |
US$/lb prod |
0.08 |
0.07 |
0.07 |
0.06 |
( |
0.07 |
Inventory WIP |
US$/lb prod |
0.14 |
(0.03) |
(0.02) |
0.00 |
( |
0.02 |
Royalties |
US$/lb prod |
0.13 |
0.13 |
0.20 |
0.08 |
( |
0.14 |
Sustaining capital |
US$/lb prod |
0.67 |
0.53 |
0.56 |
0.50 |
( |
0.56 |
Total Cash Cost |
US$/lb prod |
3.17 |
2.72 |
2.71 |
2.31 |
( |
2.70 |
Total Revenue |
US$ millions |
66.0 |
120.0 |
87.5 |
74.9 |
( |
348.4 |
Unless stated otherwise all references to dollar or $ are in USD.
Q4 2024 demonstrated consistent mining processes that delivered above 10kt of copper production for three consecutive quarters. Production further benefited from a grade of
The double lift stope extraction method was again successfully deployed during Q4 2024 after being implemented in the previous quarters, resulting in less mining dilution achieved with stronger grades and less total ore tonnes for the same metal. Total ore mined of ~286kt is around a
Figure 2 - CSA Copper Mine Quarterly Copper Production (tonnes)
The average received copper price after hedge settlements was slightly lower compared with the prior quarter with Q4 2024 at
In addition, the average A$:US$ exchange rate of
C1 cash costs decreased by ~
Figure 3 - CSA Copper Mine C1 Cash Costs14 - US$/lb produced
MAC management continues to implement additional productivity measures to further reduce C1 costs as is evident in the declining C1 achieved over the course of 2024, as depicted above. Q4 2024 reflects a
Figure 4 provides an illustration of tonnes milled per employee which increased ~
Figure 4 - CSA Mine Tonnes Milled per Employee
Figure 5 - CSA Mine Mining Unit Rate US$/t
Apart from copper production, the largest driver of C1 costs is the mining unit rate as mining accounts for approximately
Mining unit rates are trending down with better cost control initiatives implemented combined with additional tonnes mined in Q4 2024. Capital metres decreased as focus shifted to extracting ore for Q4 2024.
Figure 6 - CSA Copper Mining Development Costs US$/metre
Figure 7 - CSA Copper Mine Capital Development metres
Processing costs per tonne milled decreased slightly in December 2024 quarter. Tonnes processed for the quarter were 285kt (a
G&A unit rates decreased in the current quarter predominately driven by the increase in ore processed.
Figure 8 - CSA Copper Mine Processing Unit Rate US$/t
Figure 9 - CSA Copper Mine Site G+A Unit Rate US$/t
As seen in Figure 10, sustaining capital spend (including capitalized development) decreased slightly over the quarter. Sustaining Capital costs during the quarter included diamond drilling, stage 10 TSF works and primary vent rises.
Figure 10 - CSA Copper Mine Site Sustaining Capital US$M
TREASURY UPDATE
Cash position, liquidity and debt facilities
The Company’s unaudited cash holding at the end of Q4 2024 was
The increase in cash position at quarter end is largely driven by the cash generated by operations of
There were
The unaudited cash position also reflects another
As of 31 December 2024, the pro-forma liquidity was
Sprott Mezzanine Facility Early Repayment
As announced on 17 December 2024, MAC Copper Limited has agreed amendments with Sprott Private Resource Lending || (Collector-2), LP (“Sprott”) to permit early repayment of its Mezzanine facility. This amendment underscores our commitment to the ongoing simplification and de-leveraging of our balance sheet.
The agreement allows MAC Copper to repay the Mezzanine from 1 January 2025 onwards instead of 15 June 2025 onwards.
MAC Copper will make a decision regarding earlier repayments based on its cash balance and financial forecasts in H1 2025 which will be communicated to the market once determined.
FX Impact on OPEX
Given MAC is dual listed in
Results provided over 2024 were compiled at an average A$:US$ exchange rate of
As an estimate, utilising 2024 unaudited results as a baseline, the impact of a
TC/RC renegotiated pricing
Benchmark Treatment Charge and Refining Charge (“TC/RC”) pricing has been renegotiated and a new benchmark set for 2025, as such, from 1 January 2025 Copper refining charges will decrease by >
Using 2024 unaudited results as a base, the impact of this reduction amounts to
The impact of this change on the proforma 2024 results would be to reduce the 2024 C1 to
Figure 11 – Q4 2024 Cash flow waterfall (US$M)
Hedging
In adherence to our Debt Facility Agreement, MAC Copper previously implemented a hedging program covering the period to June 2026. During the quarter, the Company delivered 3,105 tonnes of copper into the hedge book at a price of
Table 3 – Hedge position
|
Copper |
||
|
2025 |
2026 |
Total |
Future Sales (t) |
12,420 |
5,175 |
18,595 |
Future Sales ($/t) |
3.72 |
3.72 |
3.72 |
PROJECTS AND EXPLORATION UPDATE
Pathway to >50,000 tonne per annum of copper production
The CSA mine is already benefiting from productivity improvements initiated under MAC ownership such as double stope lifts and other operational efficiencies noted in previous announcements aimed at reducing waste and ensuring efficient delivery of ore. To further progress towards becoming a 50ktpa+ producer two key projects have been identified as detailed below. Both projects are designed to deliver on our strategic goal of uplifting production to 50kpta+ and unlock the full potential of the CSA mine.
Projects updates
Ventilation project update
The Capital Vent Upgrade Project is designed to support increased mining activity to 1.7Mtpa, improving access to lower mine levels and ensuring operational longevity beyond the current reserve life. The project remains a key enabler for sustained production growth at CSA.
Total spend in Q4 was
The project is progressing well, with development successfully integrated into existing operations. Early works in high-activity mining areas have supported a structured ramp-up, ensuring alignment with operational priorities. The slowest development rates are in the early stages of the project as development interacts with existing mining, and as development moves out away from the operations development rates are picking up as planned.
Development is progressing well across multiple levels, with stripping, rehabilitation, and fan installations underway to enhance infrastructure and support operational efficiency. Key design enhancements and coordinated planning have optimised integration with active mining zones. Work will continue in 2025 to finalise critical infrastructure and further expand ventilation capacity in alignment with the long-term mine plan.
QTS South Upper update
The QTSSU deposit presents an opportunity for incremental copper production at CSA Mine, representing an additional mining area not currently connected to the mine, located approximately 150m below the surface. Drilling to upgrade this deposit from resource to reserve has been completed, with ore mining expected to commence by Q4 2025.
Total spend in Q4 was
The first development cut was taken in the December quarter, marking a significant milestone in the project's progression.
All key project team members are now in place, and the installation of new services from the surface has been completed.
The underground substation has been installed, and back-stripping activities are underway in preparation for the secondary fan installation.
Development will continue throughout Q1 2025 as the project ramps up.
CONFERENCE CALL DETAILS
The Company will host a conference call and webcast to discuss the Company’s fourth quarter 2024 results on Tuesday, January 28, 2025 at 5:00 pm (
Details for the conference call and webcast are included below.
Webcast
Participants can access the webcast at the following link https://event.choruscall.com/mediaframe/webcast.html?webcastid=D8OmknEn
Conference Call
For expedited access to the call, participants should register at https://dpregister.com/sreg/10195707/fe3e823b2f and avoid the call queue. Alternatively, if you prefer to speak with an operator, dial one of the numbers below and request the operator connect to the MAC Copper Limited call.
Toll Free Dial In: |
1-833-816-1269 |
||||
|
+1-800-822-994 |
Replay
A replay of the webcast will be available for three months via the webcast link above and or by visiting the Events section of the company’s website.
This report is authorised for release by the Board of Directors.
ABOUT MAC COPPER LIMITED
MAC Copper Limited (NYSE: MTAL) is a company focused on operating and acquiring metals and mining businesses in high quality, stable jurisdictions that are critical in the electrification and decarbonization of the global economy.
Estimates of Mineral Resources and Ore Reserves and Production Target
This release contains estimates of Ore Reserves and Mineral Resources as well as a Production Target. The Ore Reserves, Mineral Resources and Production Target are reported in MAC’s ASX Announcement dated 23 April 2024 titled ‘Updated Resource and Reserve Statement and Production Guidance’ (the R&R Announcement). The Company is not aware of any new information or data that materially affects the information included in the R&R Announcement, and that all material assumptions and technical parameters underpinning the estimates or Ore Reserves and Mineral Resources in the R&R Announcement continue to apply and have not materially changed. The material assumptions underpinning the Production Target in the R&R Announcement continue to apply and have not materially changed. It is a requirement of the ASX Listing Rules that the reporting of ore reserves and mineral resources in
Forward Looking Statements
This release includes “forward-looking statements.” The forward-looking information is based on the Company’s expectations, estimates, projections and opinions of management made in light of its experience and its perception of trends, current conditions and expected developments, as well as other factors that management of the Company believes to be relevant and reasonable in the circumstances at the date that such statements are made, but which may prove to be incorrect. Assumptions have been made by the Company regarding, among other things: the price of copper, continuing commercial production at the CSA Copper Mine without any major disruption, the receipt of required governmental approvals, the accuracy of capital and operating cost estimates, the ability of the Company to operate in a safe, efficient and effective manner and the ability of the Company to obtain financing as and when required and on reasonable terms. Readers are cautioned that the foregoing list is not exhaustive of all factors and assumptions which may have been used by the Company. Although management believes that the assumptions made by the Company and the expectations represented by such information are reasonable, there can be no assurance that the forward-looking information will prove to be accurate.
MAC’s actual results may differ from expectations, estimates, and projections and, consequently, you should not rely on these forward-looking statements as predictions of future events. Words such as “expect,” “estimate,” “project,” “budget,” “forecast,” “anticipate,” “intend,” “plan,” “may,” “will,” “could,” “should,” “believes,” “predicts,” “potential,” “continue,” and similar expressions (or the negative versions of such words or expressions) are intended to identify such forward- looking statements. These forward-looking statements include, without limitation, MAC’s expectations with respect to future performance of the CSA Copper Mine. These forward-looking statements involve significant risks and uncertainties that could cause the actual results to differ materially from those discussed in the forward-looking statements. Most of these factors are outside MAC’s control and are difficult to predict. Factors that may cause such differences include, but are not limited to: the supply and demand for copper; the future price of copper; the timing and amount of estimated future production, costs of production, capital expenditures and requirements for additional capital; cash flow provided by operating activities; unanticipated reclamation expenses; claims and limitations on insurance coverage; the uncertainty in Mineral Resource estimates; the uncertainty in geological, metallurgical and geotechnical studies and opinions; infrastructure risks; and other risks and uncertainties indicated from time to time in MAC’s other filings with the SEC and the ASX. MAC cautions that the foregoing list of factors is not exclusive. MAC cautions readers not to place undue reliance upon any forward-looking statements, which speak only as of the date made. MAC does not undertake or accept any obligation or undertaking to release publicly any updates or revisions to any forward-looking statements to reflect any change in its expectations or any change in events, conditions, or circumstances on which any such statement is based.
More information on potential factors that could affect MAC’s or CSA Copper Mine’s financial results is included from time to time in MAC’s public reports filed with the SEC and the ASX. If any of these risks materialize or MAC’s assumptions prove incorrect, actual results could differ materially from the results implied by these forward-looking statements. There may be additional risks that MAC does not presently know, or that MAC currently believes are immaterial, that could also cause actual results to differ from those contained in the forward-looking statements. In addition, forward-looking statements reflect MAC’s expectations, plans or forecasts of future events and views as of the date of this communication. MAC anticipates that subsequent events and developments will cause its assessments to change. However, while MAC may elect to update these forward-looking statements at some point in the future, MAC specifically disclaims any obligation to do so, except as required by law. These forward-looking statements should not be relied upon as representing MAC’s assessment as of any date subsequent to the date of this communication. Accordingly, undue reliance should not be placed upon the forward-looking statements.
Non-IFRS financial information
MAC’s results are reported under International Financial Reporting Standards (IFRS), noting the results in this report have not been audited or reviewed. This release may also include certain non-IFRS measures including C1, Total Cash costs and Free Cash Flow. These C1, Total Cash cost and Free Cash Flow measures are used internally by management to assess the performance of our business, make decisions on the allocation of our resources and assess operational management. Non-IFRS measures have not been subject to audit or review and should not be considered as an indication of or alternative to an IFRS measure of financial performance.
C1 Cash Cost
C1 costs are defined as the costs incurred to produce copper at an operational level. This includes costs incurred in mining, processing and general and administration as well freight and realisation and selling costs. By-product revenue is credited against these costs to calculate a dollar per pound metric. This metric is used as a measure operational efficiency to illustrate the cost of production per pound of copper produced.
Total Cash Cost
Total cash costs include C1 cash costs plus royalties and sustaining capital less inventory WIP movements. This metric is used as a measure operational efficiency to further illustrate the cost of production per pound of copper produced whilst incurring government-based royalties and capital to sustain operations.
Free Cash Flow
Free cash flow is defined as net cash provided by operating activities less additions to property, plant, equipment and mineral interests. This measure, which is used internally to evaluate our underlying cash generation performance and the ability to repay creditors and return cash to shareholders, provides investors with the ability to evaluate our underlying performance.
____________________________________________
1 See “Non-IFRS financial information” and refer to table 2 for reconciliation of C1 Cash Cost
2 Comparing 2024 CSA Copper Mine production to the total 2023 production (including production pre-MAC ownership)
3 Using 2024 unaudited results as a base, the impact of this reduction amounts is noted as an impact if these TC/RC and exchange rate movements were to be applied to these unaudited 2024 results
4 Comparing 2024 actuals and mid-point of current 2026 production guidance range
5 Placement proceeds converted into US$ based on an A$:US$ exchange rate of 0.6869, representing the average exchange rate for the week from 30 September to 4 October 2024 (inclusive)
6 Industry TRIFR source: Mine Safety performance report 2022-2023, Resource regulator Department of Regional NSW
7 See “Non-IFRS Information” and refer to table 2 for reconciliation of C1 Cash Cost
8 Q2 2024 adjusted post finalisation of half year accounts with additional freight and TC/RCs included accrued for recognition of June pre-sales
9 Excludes corporate costs from parent entity. See “Non-IFRS financial information” and refer to table 2 for reconciliation of Total Cash Cost.
10 Senior Debt + Mezzanine Facility – Cash and cash equivalents (excluding streams)
11 Realised provisional sales price excluding hedging impact
12 Sustainable capex
13 Q2 2024 adjusted post finalisation of half year accounts with additional freight and TCRCs included accrued for recognition of June pre-sales
14 See “Non-IFRS Information” and refer to table 2 for reconciliation of C1 Cash Cost
View source version on businesswire.com: https://www.businesswire.com/news/home/20250128823702/en/
Mick McMullen
Chief Executive Officer
MAC Copper Limited
investors@metalsacqcorp.com
Morné Engelbrecht
Chief Financial Officer
MAC Copper Limited
Source: MAC Copper Limited