CORRECTION FROM SOURCE: Luvu Brands Reports Fiscal 2023 Second Quarter and Six Month Results and Announces Conference Call
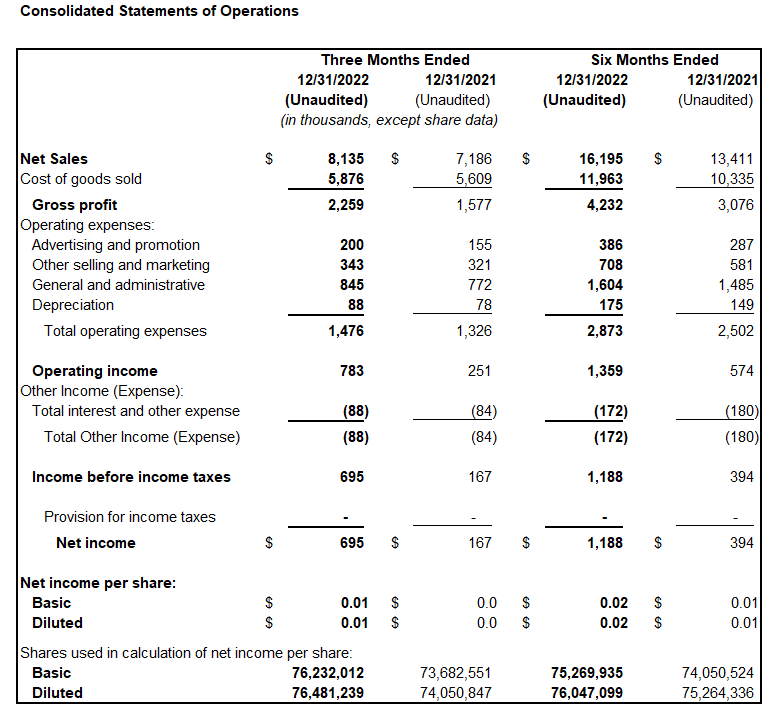
Luvu Brands (OTCQB:LUVU) reported record Q2 net sales of $8.1 million, a 13.2% increase year-over-year, for the fiscal second quarter ending December 31, 2022. Total gross profit rose to $2.3 million, up 43% from the previous year, with a gross profit margin of 27.8%. Net income was $0.7 million or $0.01 per share, compared to $0.2 million or $0.00 in the prior year. Despite increased operating expenses of $1.5 million, Adjusted EBITDA improved to $877,000, contrasting with $332,000 in the same period last year. The company anticipates challenges for future quarters.
- Record Q2 net sales of $8.1 million, a 13.2% increase from the previous year.
- Total gross profit increased to $2.3 million, a 43% rise year-over-year.
- Gross profit margin improved to 27.8%, compared to 21.9% last year.
- Net income increased to $0.7 million, or $0.01 per share, from $0.2 million in the prior year.
- Adjusted EBITDA rose to $877,000, significantly up from $332,000.
- Operating expenses increased to $1.5 million compared to $1.3 million in fiscal 2022.
- Sales of Jaxx products decreased by 11% and Avana sales decreased by 31%.
Insights
Analyzing...
(This release corrects the release that was posted at 3:40 PM EST on February 17, 2023 to clarify company information)
Reports Record Q2 Net Sales of
ATLANTA, GA / ACCESSWIRE / February 17, 2023 / Luvu Brands, Inc. (OTCQB:LUVU), a designer, manufacturer and marketer of a portfolio of consumer lifestyle brands, today reported financial results for its fiscal second quarter, which ended December 31, 2022.
Fiscal Second Quarter 2023 Highlights
Three months ended December 31, 2022 as compared to the three months ended December 31, 2021
- Net sales increased
13.2% to a record$8.1 million . - Total gross profit of
$2.3 million , an increase from prior year's$1.6 million . - Gross profit as a percentage of net sales of
27.8% compared to21.9% in the prior year. - Operating expenses were
$1.5 million compared to$1.3 million in fiscal 2022. - Net income was
$0.7 million , or$0.01 per share, compared to net income of$0.2 million , or$0.00 per share, in fiscal 2022. - Adjusted EBITDA of
$877,000 compared to$332,000 in the prior fiscal year second quarter.
First Six Months of Fiscal 2023 Highlights
Six months ended December 31, 2022 as compared to the six months ended December 31, 2021
- Net sales increased
20.8% to a record$16.2 million . - Total gross profit of
$4.2 million , an increase from prior year's$3.1 million . - Gross profit as a percentage of net sales of
26.1% compared to22.9% in the prior year. - Operating expenses were
$2.8 million compared to$2.5 million in fiscal 2022. - Net income was
$1.2 million , or$0.02 per share, compared to net income of$0.4 million , or$0.01 per share, in fiscal 2022. - Adjusted EBITDA of
$1,557,000 compared to$733,000 in the prior fiscal year second quarter.
Louis Friedman, Chairman and Chief Executive Officer, commented, "We are pleased to report better-than-expected results for the second quarter with net revenues of
Despite the dramatic slowdown in the housing market and the widespread discounting in mass market and Amazon we still delivered a
While economic and world-events remain uncertain, we expect the next several quarters to pose a short-term challenge in continuing this accelerated business trend."
Fiscal Second Quarter 2023 Results
Net sales increased
Total gross profit for the second quarter was
Operating expenses were approximately
Net income for the quarter was
Adjusted EBITDA for the three months ended December 31, 2022, was
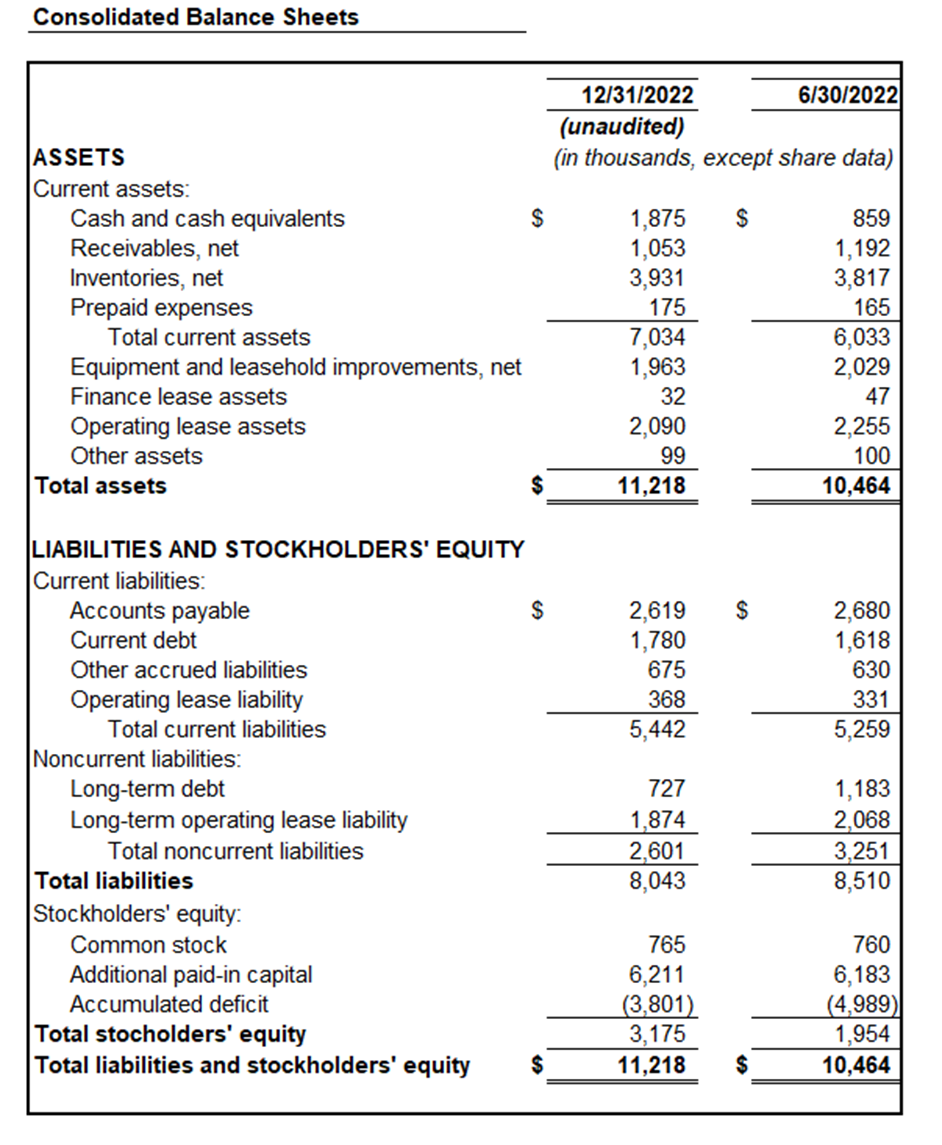
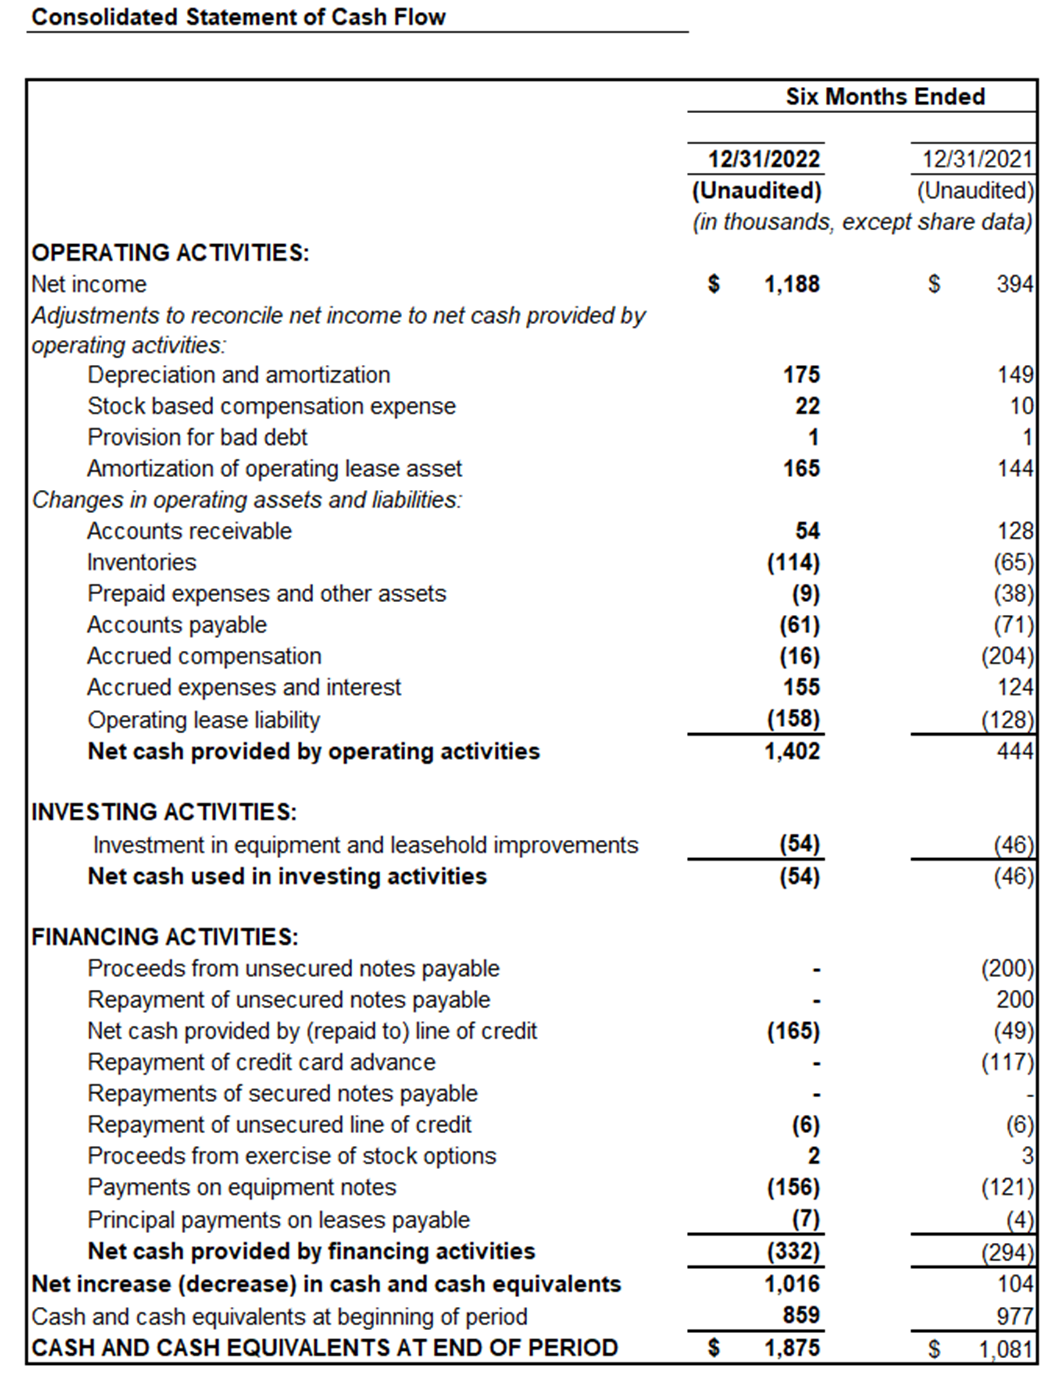
Cash and cash equivalents on December 31, 2022 totaled
Conference Call
Management will host a conference call at 11:00 a.m. EST (10:00 a.m. CST; 8:00 a.m. PST) on Tuesday, February 21, 2023. To listen and participate in the call, please register on this weblink: https://www.webcaster4.com/Webcast/Page/2527/47739
A Q&A session will take place after the formal presentation, which shareholders and other interested parties can partake in through the aforementioned weblink or by dialing 877-545-0523 (international: 973-528-0016) using the participant access code 623547.
Forward-Looking Statements
Certain matters discussed in this press release may be forward-looking statements. Such forward-looking statements can be identified by the use of words such as ''should,'' ''may,'' ''intends,'' ''anticipates,'' ''believes,'' ''estimates,'' ''projects,'' ''forecasts,'' ''expects,'' ''plans,'' and ''proposes.'' These forward-looking statements are not guarantees of future performance and are subject to risks, uncertainties, and other factors, some of which are beyond our control and difficult to predict and could cause actual results to differ materially from those expressed or forecasted in the forward-looking statements. You are urged to carefully review and consider any cautionary statements and other disclosures in our Annual Report on Form 10-K for the fiscal year ended June 30, 2022 as filed with the Securities and Exchange Commission (the "SEC") on October 12, 2022 and our other filings with the SEC. All forward-looking statements involve significant risks and uncertainties that could cause actual results to differ materially from those in the forward-looking statements, many of which are generally outside the control of Luvu Brands, Inc. and are difficult to predict. Luvu Brands, Inc. does not undertake any duty to update any forward-looking statements except as may be required by law. The information which appears on our websites and our social media platforms is not part of this press release.
Use of Non-GAAP Financial Measures
Luvu Brands' management evaluates and makes operating decisions using various financial metrics. In addition to the Company's GAAP results, management also considers the non-GAAP measure of Adjusted EBITDA and Non-GAAP Operating Margin. As used herein, Adjusted EBITDA represents net income before interest income, interest expense, income taxes, depreciation, amortization, and stock-based compensation expense, and Non-GAAP Operating Margin means Adjusted EBITDA divided by net sales. Management believes that these non-GAAP measures provide useful information about the Company's operating results. Neither Adjusted EBITDA nor Non-GAAP Operating Margin have been prepared in accordance with GAAP. These non-GAAP financial measures should not be considered as alternatives to, or more meaningful than, gross profit and net income as indicators of the Company's operating performance. Further, these non-GAAP financial measures, as presented by the Company, may not be comparable to similarly titled measures reported by other companies. The Company has attached to this press release a reconciliation of these non-GAAP financial measures to their most directly comparable GAAP financial measures.
About Luvu Brands
LUVU BRANDS (OTCQB:LUVU) is a manufacturer, designer and curator in the sexual wellness, bedroom comfort and casual furniture space. The Company is headquartered in Atlanta, Georgia in a 140,000 square foot facility employing over 225 people. Product collections are offered through its wholesale retailers, mass market e-tailers, Amazon, own factory showroom and online at www.liberator.com, www.jaxxbeanbags.com, www.avanacomfort.com. For additional information see www.luvubrands.com.
Company Contact:
Luvu Brands, Inc.
Alexander A. Sannikov
Chief Financial Officer
770-246-6426
IR@LuvuBrands.com
Second Quarter 2023 Results


SUPPLEMENTAL FINANCIAL INFORMATION
RECONCILIATION OF NON-GAAP FINANCIAL MEASURES

SOURCE: Luvu Brands, Inc.
View source version on accesswire.com:
https://www.accesswire.com/739915/CORRECTION-FROM-SOURCE-Luvu-Brands-Reports-Fiscal-2023-Second-Quarter-and-Six-Month-Results-and-Announces-Conference-Call


