K92 Mining Announces Significant Improvement to Economics With Updated Kainantu Gold Mine Integrated Development Plan
K92 Mining has released an Updated Integrated Development Plan (IDP) for its Kainantu Gold Mine, effective January 1, 2024. The plan includes two scenarios: the Stage 3 Expansion (DFS Case) and the Stage 4 Expansion (PEA Case). The DFS Case projects a 100% throughput increase to 1.2 mtpa, with an after-tax NPV5% of $680 million at $1,900/oz gold, extending mine life to 2030. The PEA Case envisions a 200% throughput increase to 1.8 mtpa, with an after-tax NPV5% of $2.3 billion at $1,900/oz gold, extending mine life to 2037.
The updated IDP integrates a significant increase in mineral resources, improved off-take agreements, and higher commodity prices. The DFS Case estimates an average annual production of 303,288 oz AuEq, with average cash costs of $380 per gold ounce. The PEA Case estimates 413,593 oz AuEq annually, with cash costs of $174 per gold ounce.
The project is fully funded through existing cash balances and credit facilities. As of September 30, 2024, 68% of the total growth capital for expansions has been spent or committed.
K92 Mining ha pubblicato un Piano di Sviluppo Integrato Aggiornato (IDP) per la sua Miniera d'Oro Kainantu, efficace dal 1 gennaio 2024. Il piano include due scenari: l'Espansione Fase 3 (Caso DFS) e l'Espansione Fase 4 (Caso PEA). Il Caso DFS prevede un aumento del 100% della capacità di trattamento a 1,2 mtpa, con un NPV5% post-tasse di 680 milioni di dollari a 1.900 dollari/oz di oro, estendendo la vita della miniera fino al 2030. Il Caso PEA prevede un aumento del 200% della capacità di trattamento a 1,8 mtpa, con un NPV5% post-tasse di 2,3 miliardi di dollari a 1.900 dollari/oz di oro, estendendo la vita della miniera fino al 2037.
L'IDP aggiornato integra un significativo aumento delle risorse minerarie, migliori contratti di vendita e prezzi delle materie prime più elevati. Il Caso DFS stima una produzione annuale media di 303.288 oz AuEq, con costi medi di cassa di 380 dollari per oncia d'oro. Il Caso PEA stima 413.593 oz AuEq annualmente, con costi di cassa di 174 dollari per oncia d'oro.
Il progetto è interamente finanziato attraverso saldi di cassa esistenti e linee di credito. A partire dalla data del 30 settembre 2024, il 68% del capitale totale per le espansioni è stato speso o impegnato.
K92 Mining ha publicado un Plan de Desarrollo Integrado Actualizado (IDP) para su Minería de Oro Kainantu, vigente a partir del 1 de enero de 2024. El plan incluye dos escenarios: la Expansión Etapa 3 (Caso DFS) y la Expansión Etapa 4 (Caso PEA). El Caso DFS prevé un incremento del 100% en el procesamiento a 1,2 mtpa, con un NPV5% post-impuestos de 680 millones de dólares a 1.900 dólares/oz de oro, extendiendo la vida de la mina hasta 2030. El Caso PEA anticipa un aumento del 200% en el procesamiento a 1,8 mtpa, con un NPV5% post-impuestos de 2,3 mil millones de dólares a 1.900 dólares/oz de oro, extendiendo la vida de la mina hasta 2037.
El IDP actualizado integra un aumento significativo en los recursos minerales, mejores acuerdos de venta y precios de materias primas más altos. El Caso DFS estima una producción anual promedio de 303,288 oz AuEq, con costos de caja promedio de 380 dólares por onza de oro. El Caso PEA estima 413,593 oz AuEq anualmente, con costos de caja de 174 dólares por onza de oro.
El proyecto está completamente financiado a través de saldos de efectivo existentes y líneas de crédito. A partir del 30 de septiembre de 2024, se ha gastado o comprometido el 68% del capital total para las expansiones.
K92 Mining는 Kainantu 금광을 위한 업데이트된 통합 개발 계획(IDP)을 발표했으며, 이는 2024년 1월 1일부터 유효합니다. 이 계획에는 두 가지 시나리오가 포함되어 있습니다: 3단계 확장(DFS 사례)와 4단계 확장(PEA 사례). DFS 사례는 1.2 mtpa로 100% 처리량 증가를 예측하며, 1,900달러/온스 금 기준에서 세후 NPV5%는 6억8천만 달러로, 광산 수명이 2030년까지 연장됩니다. PEA 사례는 1.8 mtpa로 200% 처리량 증가를 구상하며, 1,900달러/온스 금 기준에서 세후 NPV5%는 23억 달러로, 광산 수명이 2037년까지 연장됩니다.
업데이트된 IDP는 광물 자원의 상당한 증가, 향상된 판매 계약, 높은 원자재 가격을 통합합니다. DFS 사례는 평균 연간 생산량 303,288 oz AuEq와 평균 현금 비용을 금 1온스당 380달러로 추정합니다. PEA 사례는 연간 413,593 oz AuEq를 추정하며, 금 1온스당 현금 비용은 174달러입니다.
이 프로젝트는 기존 현금 잔액과 신용 시설을 통해 완전히 자금이 지원됩니다. 2024년 9월 30일 기준으로, 확장을 위한 총 성장 자본의 68%가 지출되었거나 약정되었습니다.
K92 Mining a publié un Plan de Développement Intégré Mis à Jour (IDP) pour sa Mine d'Or Kainantu, entrant en vigueur le 1er janvier 2024. Le plan inclut deux scénarios : l'Expansion Étape 3 (Cas DFS) et l'Expansion Étape 4 (Cas PEA). Le Cas DFS prévoit une augmentation de 100% du taux de traitement à 1,2 mtpa, avec une VAN5% après impôts de 680 millions de dollars à 1.900 dollars/oz d'or, prolongeant la durée de vie de la mine jusqu'en 2030. Le Cas PEA envisage une augmentation de 200% du taux de traitement à 1,8 mtpa, avec une VAN5% après impôts de 2,3 milliards de dollars à 1.900 dollars/oz d'or, prolongeant la durée de vie de la mine jusqu'en 2037.
L'IDP mis à jour intègre une augmentation significative des ressources minérales, de meilleures conventions de vente et des prix des matières premières plus élevés. Le Cas DFS estime une production annuelle moyenne de 303.288 oz AuEq, avec des coûts en espèces moyens de 380 dollars par once d'or. Le Cas PEA estime 413.593 oz AuEq par an, avec des coûts en espèces de 174 dollars par once d'or.
Le projet est entièrement financé par des soldes de trésorerie existants et des lignes de crédit. Au 30 septembre 2024, 68% du capital total de croissance pour les extensions a été dépensé ou engagé.
K92 Mining hat einen Aktualisierten Integrierten Entwicklungsplan (IDP) für seine Kainantu Goldmine veröffentlicht, der ab dem 1. Januar 2024 gültig ist. Der Plan umfasst zwei Szenarien: die Phase-3-Erweiterung (DFS-Fall) und die Phase-4-Erweiterung (PEA-Fall). Der DFS-Fall prognostiziert eine 100%ige Steigerung des Durchsatzes auf 1,2 mtpa, mit einem NPV5%-Wert nach Steuern von 680 Millionen Dollar bei 1.900 Dollar/oz Gold, wodurch die Lebensdauer der Mine bis 2030 verlängert wird. Der PEA-Fall sieht eine 200%ige Steigerung des Durchsatzes auf 1,8 mtpa vor, mit einem NPV5%-Wert nach Steuern von 2,3 Milliarden Dollar bei 1.900 Dollar/oz Gold, wodurch die Lebensdauer der Mine bis 2037 verlängert wird.
Der aktualisierte IDP integriert einen signifikanten Anstieg der mineralischen Ressourcen, verbesserte Abnahmevereinbarungen und höhere Rohstoffpreise. Der DFS-Fall schätzt eine durchschnittliche Jahresproduktion von 303.288 Oz AuEq, mit durchschnittlichen Barausgaben von 380 Dollar pro Unze Gold. Der PEA-Fall schätzt jährlich 413.593 Oz AuEq, mit Barausgaben von 174 Dollar pro Unze Gold.
Das Projekt ist vollständig durch bestehende Bargeldbestände und Kreditfazilitäten finanziert. Zum 30. September 2024 wurden 68% des gesamten Wachstumsinvestitionskapitals für die Erweiterungen ausgegeben oder verpflichtet.
- DFS Case projects a 100% throughput increase to 1.2 mtpa.
- PEA Case envisions a 200% throughput increase to 1.8 mtpa.
- After-tax NPV5% of $680 million for DFS Case at $1,900/oz gold.
- After-tax NPV5% of $2.3 billion for PEA Case at $1,900/oz gold.
- Average annual production of 303,288 oz AuEq for DFS Case.
- Average annual production of 413,593 oz AuEq for PEA Case.
- Project fully funded through existing cash balances and credit facilities.
- 68% of total growth capital for expansions spent or committed.
- Growth capital cost of $194 million for DFS Case.
- Life-of-mine sustaining capital cost of $337 million for DFS Case.
- Growth capital cost of $201 million for PEA Case.
- Life-of-mine sustaining capital cost of $900 million for PEA Case.
Updated Integrated Development Plan (“IDP”) Highlights (effective date January 1, 2024):
- The DFS Case evaluates the Stage 3 Expansion to 1.2 million tonnes per annum (“mtpa”), consistent with the 2022 IDP, representing a
100% throughput increase from the 600,000 tpa Stage 2A Expansion design throughput (upgraded from 500,000 tpa in the 2022 IDP). Stage 3 involves a new standalone 1.2 mtpa process plant and supporting infrastructure, which is currently under construction, with mining focused on the Kora Central Zone within the Kora Deposit and Judd Deposit, utilizing a cut-off grade of 3.5 grams per tonne (“g/t”) gold equivalent (“AuEq”).
- After-tax NPV5% US
$680 million at US$1,900 per ounce gold and at around current spot prices, at US$2,600 per ounce gold, After-tax NPV5% is US$1.2 billion . - Average annual run-rate production of 303,288 ounces AuEq per annum, run-rate achieved in 2027 and a peak annual production of 319,360 ounces AuEq in 2027.
- Life of Mine average cash costs of US
$380 per gold ounce or US$694 per AuEq ounce and all-in sustaining cost (“AISC”)(2) of US$665 per gold ounce or US$920 per AuEq ounce over a 7-year mine life. The mine life is now extended to 2030, previously 2028 in the 2022 IDP. - Growth capital cost of US
$194 million and life-of-mine sustaining capital cost of US$337 million .
- After-tax NPV5% US
- The alternate PEA Case evaluates two-stages of expansions to a run-rate throughput of 1.8 mtpa, representing a
200% throughput increase from the 600,000 tpa Stage 2A Expansion design throughput (upgraded from 500,000 tpa). The ultimate run-rate throughput of the second expansion is referred to as Kainantu Stage 4 Expansion, operating two standalone process plants, larger surface infrastructure and mining throughputs achieved by mining Kora Upper, Lower, and Central Zones within the Kora Deposit, and the Judd Deposit, utilizing a cut-off grade of 4.0 g/t AuEq.
- After-tax NPV5% of US
$2.3 billion at US$1,900 per ounce gold and at around current spot prices, at US$2,600 per ounce gold, After-tax NPV5% is US$3.5 billion . - Average annual run-rate production of 413,593 ounces AuEq per annum, run-rate achieved in 2028 and a peak annual production of 484,692 ounces AuEq in 2034.
- Life of Mine average cash costs of US
$174 per gold ounce or US$633 per AuEq ounce and all-in sustaining cost (“AISC”)(2) of US$432 per gold ounce or US$822 per AuEq ounce over a 14-year mine life. The mine life is now extended to 2037, previously 2032 in the 2022 IDP. - Growth capital cost of US
$201 million and life of mine sustaining capital cost of US$900 million .
- After-tax NPV5% of US
- Prior to the January 1, 2024 Updated IDP effective date,
$15 million of expansion growth capital was spent. The total growth capital for the project, remains closely aligned with the operational guidance announced on February 22, 2024 of US$210 million . As at September 30, 2024, approximately63% of the total growth capital for the Stage 3 and 4 Expansions is either spent or committed, and subsequent to quarter end, following the award of the river crossing construction contract in October, approximately68% of total growth capital has either been spent or committed. - A major driver for the improvement in economics is the significant increase to the Mineral Resource estimate at Kora and Judd reported in Q4 2023 and incorporated into the Updated IDP, with Measured and Indicated Resources increasing by
14% to 2.6 million ounces at 10.0 g/t AuEq and Inferred Resources increasing by73% to 4.5 million ounces at 8.5 g/t AuEq. - Both the DFS and PEA Cases are fully funded from existing cash balances, mine cash flow and available liquidity through credit facilities. K92 is in a strong financial position having, as at June 30, 2024, a cash balance of US
$71 million and up to US$110 million in remaining undrawn liquidity from the Trafigura Credit Facilities. K92 recently announced record Q3 2024 AuEq production of 44,304 oz which has resulted in an increase to its cash balance, even with significant capital expenditures for the expansion (see October 9, 2024 press release). - Both the DFS and PEA Cases have a low environmental impact, being supplied with clean hydroelectricity, mining high grades outlining a low footprint, no-cyanide operation, and a majority of tailings reporting underground as pastefill. K92 plans to upgrade the grid infrastructure, which is expected to significantly reduce greenhouse gas emission intensity per ounce produced near-term.
- AuEq – calculated on the following metal prices: Au – US
$1,900 /oz, Ag – US$25.00 /oz, Cu – US$4.50 /lb. Note that gold equivalent factors for the production estimates are different to those used for reporting the Mineral Resource estimate. - AISC – All-In Sustaining Costs include cash costs plus estimated corporate general and administrative (“G&A”) costs, sustaining costs and accretion.
VANCOUVER, British Columbia, Oct. 16, 2024 (GLOBE NEWSWIRE) -- K92 Mining Inc. (“K92” or the “Company”) (TSX: KNT; OTCQX: KNTNF) is pleased to announce the results of its Updated Integrated Development Plan (“Updated IDP”) for its Kainantu Gold Mine Project (the “Kainantu Project”) in Papua New Guinea. The Updated IDP comprises two scenarios: 1) Kainantu Stage 3 Expansion Definitive Feasibility Study Case (“DFS” or “DFS Case”); and 2) Kainantu Stage 4 Expansion Preliminary Economic Assessment Case (“PEA” or “PEA Case”). The results of the Updated IDP will be set forth in an independent technical report prepared in accordance with National Instrument 43-101 - Standards for Disclosure of Mineral Projects (“NI 43-101”) within forty-five days from now.
The Updated IDP supersedes the January 1, 2022 effective date Integrated Development Plan (“2022 IDP”) and has delivered a significant improvement in economics in both the DFS Case and the PEA Case, and particularly the PEA Case, driven by the following key changes:
- A significant increase to the Mineral Resource estimate at Kora and Judd reported in Q4 2023 (see December 5, 2023 press release), with Measured and Indicated Resources increasing by
14% to 2.6 million ounces at 10.0 g/t AuEq and Inferred Resources increasing by73% to 4.5 million ounces at 8.5 g/t AuEq. This has extended the mine life for the DFS Case to 2030 from 2028 and the PEA Case to 2037 from 2032 from the 2022 Integrated Development Plan (see September 12, 2022 press release). - The new off-take agreement with Trafigura, commencing January 1, 2026, which has improved metals’ payabilities for deliveries of concentrates, in addition to amending penalties, treatment and refining charges, and transport charges, all of which are better than the assumptions used in the 2022 IDP.
- Significant margin expansion forecasted, as cash costs and all-in sustaining costs in the Updated IDP have only moderately increased from the 2022 IDP, while the economic evaluation gold price has increased from
$1,600 /oz to$1,900 /oz to be closer aligned to recent peer studies and the current commodity price environment. Cut-off grades were slightly modified in the Updated IDP to achieve the optimal mine plan, with the cut-off grade for the PEA Case reduced from 4.5 g/t AuEq in the 2022 IDP to 4.0 g/t AuEq and the cut-off grade for the DFS Case increasing from 3.0 g/t AuEq in the 2022 IDP to 3.5 g/t AuEq. The updated IDP has made only limited changes to the mining method and recovery method from the 2022 IDP, with changes made to improve the pastefill plant and delivery design. - Limited forecasted Updated IDP growth capital cost inflation in a rising commodity price environment. This has been demonstrated to date from the construction activities well underway at the Kainantu Gold Mine for the Stage 3 and 4 Expansions. Importantly, the total growth capital for the project, remains closely aligned with the Operational Guidance announced in February 2024 of
$210 million (see February 22, 2024 press release), that incorporated design and scope changes, including improving the expandability of the process plant and redesigning the pastefill plant to mitigate transport and delivery risk (trucking filter cake to an underground pastefill plant – previously involved extensive pumping and piping). Prior to the January 1, 2024 Updated IDP effective date,$15 million of expansion growth capital was spent. As at September 30, 2024, approximately63% of the total growth capital for the Stage 3 and 4 Expansions has either been spent or committed, and subsequent to quarter end, following the award of the river crossing construction contract in October, approximately68% of total growth capital is either spent or committed. - Throughput increase for the PEA Case to 1.8 mtpa from 1.7 mtpa driven by the Stage 2A Plant design throughput being upgraded from 500,000 tpa to 600,000 tpa as demonstrated from recent planted performance.
The Updated IDP, which includes the Kainantu Stage 3 Expansion DFS Case and the alternative Kainantu Stage 4 Expansion PEA Case, was independently prepared by Entech Pty Ltd of Perth, Australia (“Entech”); ATC Williams Pty Ltd (“ATC Williams”) of Brisbane, Australia; WSP Canada Inc. (“WSP”) of Ontario, Canada; Metallurgical Management Services Pty Ltd (“MMS”) of Perth, Australia, EMM Consulting Pty Ltd (“EMM”) of Queensland, Australia, H & S Consultants Pty. Ltd (“H&SC”) of Sydney, Australia, and; GR Engineering Services Limited (“GR”) of Brisbane, Australia, with some cost information provided by K92.
The PEA is preliminary in nature and includes Inferred Mineral Resources that are considered too speculative geologically to have the economic considerations applied to them that would enable them to be categorized as Mineral Reserves, and there is no certainty that the PEA will be realized. Mineral Resources that are not Mineral Reserves do not have demonstrated economic viability. Mineral Reserves are defined by the Definitive Feasibility Study and are not predicated on the Preliminary Economic Assessment in any way.
John Lewins, K92 Chief Executive Officer and Director, stated, “The Updated Integrated Development Plan is a major milestone for K92, marking a significant improvement to mine economics by incorporating a larger updated Mineral Resource estimate, a new off-take agreement with Trafigura, more robust engineering designs and information from our ongoing construction activities, along with margin expansion from improved commodity prices.
This has resulted in the DFS Case NPV5% increasing from US
Importantly, the realization of strong cash flow and the economic benefits of the Updated IDP are expected near-term. In less than nine months, the commissioning of the Stage 3 Plant Expansion is planned to begin, marking the start of K92’s transformation into a Tier 1 Mid-Tier Producer. Concurrent with advancing the Stage 3 and 4 Expansions, we remain very active in improving upon the outcomes of the study, particularly through exploration. There are currently 11 drill rigs on site of which 6 are operating underground and 5 on the surface, focused on upgrading and expanding resources both near-mine and across our highly prospective gold-copper district.
Later this month, we are excited to host a large group of analysts and investors on-site to showcase our progress to date in multiple areas and also the mining-friendly jurisdiction of Papua New Guinea.”
1 – Kainantu Updated IDP - Definitive Feasibility Study Case
1.1 - DFS Overview
The DFS evaluates an expansion of mining and processing to a run-rate throughput of 1.2 mtpa, representing a
The DFS and Mineral Reserve statement is derived from the global Kora and Judd Mineral Resource Estimate (September 12, 2023 effective date), net of post-resource mining depletion from September 12, 2023 to December 31, 2023, and does not incorporate post-resource-estimate drilling results.
Table 1.1: DFS Highlights
| US Dollars unless otherwise stated | Updated IDP | |
| Life of Mine (starting January 2024) | Stage 3 Run-Rate(1) (2027-2029) | |
| Production | ||
| Mine life (years) | 7 years | |
| Total mill feed (000s tonnes) | 6,176 | 3,600 |
| Average mill throughput (000s tonnes per annum) | 882 | 1,200 |
| Total Metal Production | ||
| AuEq (000s ounces) | 1,561 | 910 |
| Gold (000s ounces) | 1,223 | 666 |
| Copper (million lbs) | 126 | 92 |
| Silver (000s ounces) | 2,910 | 1,986 |
| Peak Annual Production | ||
| Year | 2027 | |
| AuEq (000s ounces per annum) | 319 | |
| Average Annual Metal Production | ||
| AuEq (000s ounces per annum) | 223 | 303 |
| Gold (000s ounces per annum) | 175 | 222 |
| Copper (mlbs per annum) | 18 | 31 |
| Silver (000s ounces per annum) | 416 | 662 |
| Average Grade | ||
| AuEq grade (g/t) | 8.5 g/t | |
| Gold grade (g/t) | 6.7 g/t | |
| Copper grade (%) | ||
| Silver grade (g/t) | 19 g/t | |
| Average Recovery | ||
| Gold recovery (%) | ||
| Copper recovery (%) | ||
| Silver recovery (%) | ||
| Costs | ||
| Mining cost (US$/t ore mined) | ||
| Processing cost (US$/t processed) | ||
| G&A cost (US$/t processed) | ||
| Paste plant cost ($/t processed) | ||
| TSF cost ($/t processed) | ||
| Transport and Insurance cost ($/t processed) | ||
| Total operating cost per tonne processed (US$/t) | $145.40 | $134.56 |
| Royalties ($/t processed) | ||
| Sustaining capital per tonne processed (US$/t) | ||
| Total cost per tonne processed (US$/t) | $210.88 | $179.96 |
| Growth capital expenditure ($m) | ||
| Sustaining capital expenditure ($m) | ||
| Total capital expenditure with closure costs ($m) | $541 | |
| Cash cost per ounce AuEq ($/oz)(2) | ||
| All-in sustaining cost per ounce AuEq ($/oz)(3) | ||
| Cash cost per ounce gold ($/oz)(2) | ||
| All-in sustaining cost per ounce gold ($/oz)(3) | ||
| Base Case Economic Analysis at US | ||
| After-tax NPV0% | ||
| After-tax NPV5%(4) | ||
| Economic Analysis at | ||
| After-tax NPV0% | ||
| After-tax NPV5%(4) | ||
- Run-rate is calculated based on 2027-2029.
- Cash costs are net of by-product credits and are inclusive of mining costs, processing costs, site G&A and refining charges and royalties.
- AISC includes cash costs plus estimated corporate general and administration costs, sustaining costs, and accretion.
- Net present value is calculated utilizing monthly discounting.
1.2 - Kainantu Mineral Reserve Statement
The Mineral Reserve estimate outlined in the DFS was prepared by Daniel Donald FAusIMM MSME of Entech, in accordance with the classification criteria set out in the 2014 CIM Definition Standards for Mineral Resources and Mineral Reserves prepared by the CIM Standing Committee on Reserve Definitions. Daniel Donald is an independent consultant of the Company and is a Qualified Persons as defined by NI 43-101. The total Mineral Reserve for the Kainantu Project is shown in Table 1.2. The Mineral Reserve estimate is based on the Global Kora and Judd Mineral Resource estimate (September 12, 2023 effective date – refer to Table 1.3), net of post-resource mining depletion from September 12, 2023 to December 31, 2023, of 183,768 tonnes at 8.1 g/t Au, 0.9 % Cu and 15 g/t Ag.
Table 1.2 – Kainantu Mineral Reserve Statement (Effective Date January 1, 2024)
| Kora and Judd Deposit Reserve Summary (January/2024) | |||||||||
| Tonnes | Gold | Silver | Copper | Gold Equivalent | |||||
| mt | g/t | moz | g/t | moz | % | kt | g/t | moz | |
| Kora Deposit | |||||||||
| Proven | 2.95 | 7.4 | 0.70 | 19 | 1.9 | 1.1 | 31 | 9.4 | 0.89 |
| Probable | 2.52 | 5.7 | 0.46 | 19 | 1.6 | 1.0 | 26 | 7.6 | 0.61 |
| Proven & Probable | 5.47 | 6.6 | 1.16 | 19 | 3.4 | 1.1 | 57 | 8.6 | 1.50 |
| Judd Deposit | |||||||||
| Proven | 0.24 | 8.3 | 0.06 | 17 | 0.1 | 0.6 | 1 | 9.4 | 0.07 |
| Probable | 0.47 | 6.5 | 0.10 | 13 | 0.2 | 0.5 | 2 | 7.5 | 0.11 |
| Proven & Probable | 0.71 | 7.1 | 0.16 | 14 | 0.3 | 0.5 | 4 | 8.1 | 0.18 |
| Consolidated | |||||||||
| Total Proven | 3.19 | 7.5 | 0.77 | 19 | 2.0 | 1.0 | 33 | 9.4 | 0.96 |
| Total Probable | 2.99 | 5.8 | 0.56 | 18 | 1.8 | 1.0 | 28 | 7.6 | 0.73 |
| Total Proven & Probable | 6.18 | 6.7 | 1.32 | 19 | 3.7 | 1.0 | 61 | 8.5 | 1.69 |
- The long-term metal prices used for calculating the financial analysis is US
$1,900 /oz gold, US$4.50 /lb copper, US$25 /oz silver. - Gold Equivalents are calculated as AuEq = Au g/t + Cu % *1.62406 + Ag g/t*0.01316. Metal payabilities and recoveries are not incorporated into this formula.
- A minimum mining width of 3.0 m has been applied for stoping, inclusive of a 1.0 m dilution skin.
- In addition to the 1.0 m dilution skin, additional dilution of
5% has been added for Avoca mined stopes and2.5% for long hole stoping with pastefill. Where a stope is within 5.0m proximity of the HW or FW of the fault gouge, an additional 1.0m of dilution was added at a grade averaging 1.42g/t AuEq. This results in a total average dilution of27.8% . - Mining recoveries of
90% have been applied to Avoca mined stopes, and95% for long hole stoping with pastefill. - A cut-off grade of 3.5 g/t AuEq was used to define stoping blocks. Stope shapes with uneconomic development were excluded. The cut-off grade takes into account site operating costs, G&A costs, sustaining capital costs and relevant processing and revenue inputs.
- Measured Mineral Resources were used to report Proven Mineral Reserves.
- Indicated Mineral Resources were used to report Probable Mineral Reserves.
- Tonnage and grade estimates include dilution and recovery allowance.
- The Mineral Reserves reported are not added to Mineral Resources.
1.3 - Kainantu Mineral Resource Estimate
The Company’s current Mineral Resource estimate for Kora and Judd (effective date of September 12, 2023) was completed by H & S Consultants Pty. Ltd. (Table 1.3). The Irumafimpa deposit was not incorporated into the Updated IDP and will be reviewed at a later date.
Table 1.3 – Global Kora and Judd Mineral Resource Estimate, (3.0 g/t AuEq cut-off)
| Kora Deposit Resource Summary (September 12/2023) | |||||||||
| Tonnes | Gold | Silver | Copper | Gold Equivalent | |||||
| mt | g/t | moz | g/t | moz | % | kt | g/t | moz | |
| Kora Deposit | |||||||||
| Measured | 3.7 | 8.7 | 1.0 | 21 | 2.5 | 1.2 | 45 | 11.0 | 1.3 |
| Indicated | 3.1 | 7.0 | 0.7 | 22 | 2.2 | 1.3 | 41 | 9.4 | 1.0 |
| Measured & Indicated | 6.9 | 7.9 | 1.8 | 21 | 4.7 | 1.3 | 86 | 10.2 | 2.3 |
| Inferred | 14.3 | 5.6 | 2.6 | 29 | 13.2 | 1.6 | 231 | 8.6 | 3.9 |
| Judd Deposit Resource Summary (September 12/2023) | |||||||||
| Tonnes | Gold | Silver | Copper | Gold Equivalent | |||||
| mt | g/t | moz | g/t | moz | % | kt | g/t | moz | |
| Judd Deposit | |||||||||
| Measured | 0.4 | 9.1 | 0.12 | 19 | 0.2 | 0.8 | 3 | 10.6 | 0.14 |
| Indicated | 0.8 | 6.4 | 0.17 | 16 | 0.4 | 0.7 | 6 | 7.8 | 0.21 |
| Measured & Indicated | 1.2 | 7.2 | 0.29 | 17 | 0.7 | 0.8 | 9 | 8.7 | 0.35 |
| Inferred | 2.3 | 6.3 | 0.45 | 16 | 1.1 | 0.8 | 17 | 7.7 | 0.56 |
| Consolidated | |||||||||
| Total Measured | 4.1 | 8.8 | 1.2 | 20 | 2.7 | 1.2 | 48 | 10.9 | 1.5 |
| Total Indicated | 4.0 | 6.9 | 0.9 | 21 | 2.6 | 1.2 | 47 | 9.1 | 1.2 |
| Total Measured & Indicated | 8.1 | 7.8 | 2.0 | 20 | 5.3 | 1.2 | 96 | 10.0 | 2.6 |
| Total Inferred | 16.5 | 5.7 | 3.0 | 27 | 14.3 | 1.5 | 248 | 8.5 | 4.5 |
- The Independent and Qualified Person responsible for the Mineral Resource estimate is Simon Tear, P.Geo. of H & S Consultants Pty. Ltd., Sydney, Australia, and the effective date of the estimate is September 12, 2023.
- Mineral Resources are not Mineral Reserves and do not have demonstrated economic viability.
- Geological interpretation has generated a series of narrow, sub-vertical vein structures based on delineated wireframes on 10 m, 20 m and 25 m spaced cross sections. The design of the lode wireframes is based on a combination of logged geology, Au, Cu & Ag assay grades and locally on a nominal minimum mining width of 5.2 m, all coupled with geological sense.
- Resources were compiled at 3.0 g/t gold equivalent cut-off grades for Kora and Judd.
- Density (t/m3) was modelled using Ordinary Kriging on 2,778 sample measurements. Areas within the mineral wireframes where no density grades were interpolated had average default values inserted at appropriate levels.
- Reported tonnage and grade figures are rounded from raw estimates to reflect the order of accuracy of the estimate.
- Minor variations may occur during the addition of rounded numbers.
- Estimations used metric units (metres, tonnes and g/t).
- Gold equivalents are calculated as AuEq = Au g/t + Cu%*1.6481+ Ag g/t*0.0114. Gold price US
$1,700 /oz; Silver US$22.5 /oz; Copper US$4.00 /lb. Metal payabilities and recoveries are incorporated into the AuEq formula. Recoveries of95% for copper and80% for silver were used.
1.4 - DFS Mining Operations
K92 engaged Entech to undertake the DFS for the Kainantu Project, which involved:
- Applying financial and processing parameters to determine appropriate cut-off grades for stope design.
- Generating three-dimensional stope shapes and mining inventory using the Datamine Mineable Shape Optimiser (MSO) program.
- Creating a development layout to suit the MSO inventory.
- Geotechnical assessment and generating the stoping parameters.
- Ventilation design and ventilation tradeoff studies.
- Mining capital and operating costings.
The Stage 3 Expansion mine plan considered in the DFS is designed as an incline access operation with a series of ore passes for efficient material movement between sublevels and the twin incline for material transport to surface. The DFS mine plan initially employs a long hole open stoping mining method utilizing Avoca and Modified Avoca mining methods, which are currently employed at the mine. Upon construction of the pastefill plant, the mining method transitions to long hole open stoping with pastefill in Q3 2025.
Long hole open stoping has been successfully executed at both the Kora and Judd deposits, with the first long hole stope mined in Q1 2020 at Kora, and Q4 2021 at Judd. The Avoca mining method involves backfilling from the overcut sublevel while the long hole stope is advanced from the undercut sublevel to limit the strike length of the open stope. By limiting the strike length of the open stope, the method is designed to provide sufficient stability to the stope walls and backs, increasing the ultimate strike length extracted. The application of cemented pastefill provides improved geotechnical conditions for less dilution and higher mining recovery factors, greater operating flexibility through the ability to mine above and below pastefill and a reduction in surface tailings storage requirement.
Stopes were identified for the mine plan contained in the DFS based on the Datamine Mineable Shape Optimizer (MSO) program at a cut-off grade of 3.5 g/t AuEq. Stope shapes with uneconomic development access requirements were excluded. Dilution was estimated based on a 0.5 m dilution skin for both the footwall and hanging wall using the MSO program for a minimum stope width of 3.0 m. Additional dilution factor of
The DFS Case operates at the Stage 2A Expansion 600,000 tpa throughput rate until mid-2025, where the operation commences ramp up to the Stage 3 Expansion run-rate of 1.2 mtpa in late Q2 2025. Mining is predominately from the Kora Central Zone within the Kora deposit and the Judd deposit. See Table 1.6 for a material movement summary as part of the simplified economic model.
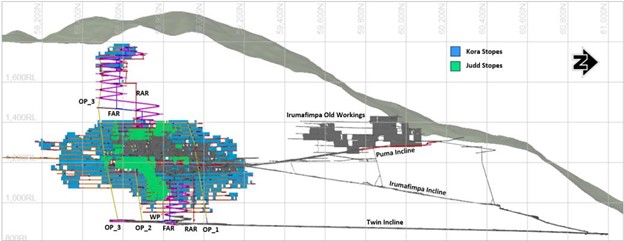
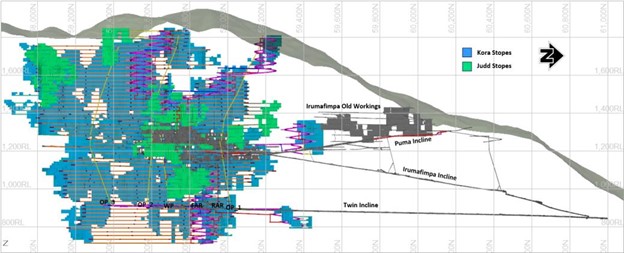
Figure 1.1 – DFS Life of Mine Plan – Lateral, Vertical Development and Stope Shapes at 3.5 g/t AuEq cut-off grade (looking West)
1.4 - DFS Mineral Processing, Tailings and Infrastructure
K92 engaged GR Engineering Services, WSP, and ATCW to complete and update the DFS Stage 3 Expansion process plant, pastefill plant, tailing facility and integration of surface infrastructure design. The DFS involves the construction of a standalone 1.2 mtpa processing plant and supporting infrastructure. The new plant is adjacent to the existing process plant, which is undergoing a Stage 2A Plant Expansion with an upgraded design throughput of 600,000 tpa (previously 500,000 tpa). The existing plant will be placed on care and maintenance in Q4 2025 upon the commissioning and ramp-up of the Stage 3 Expansion Process Plant commencing in late Q2 2025.
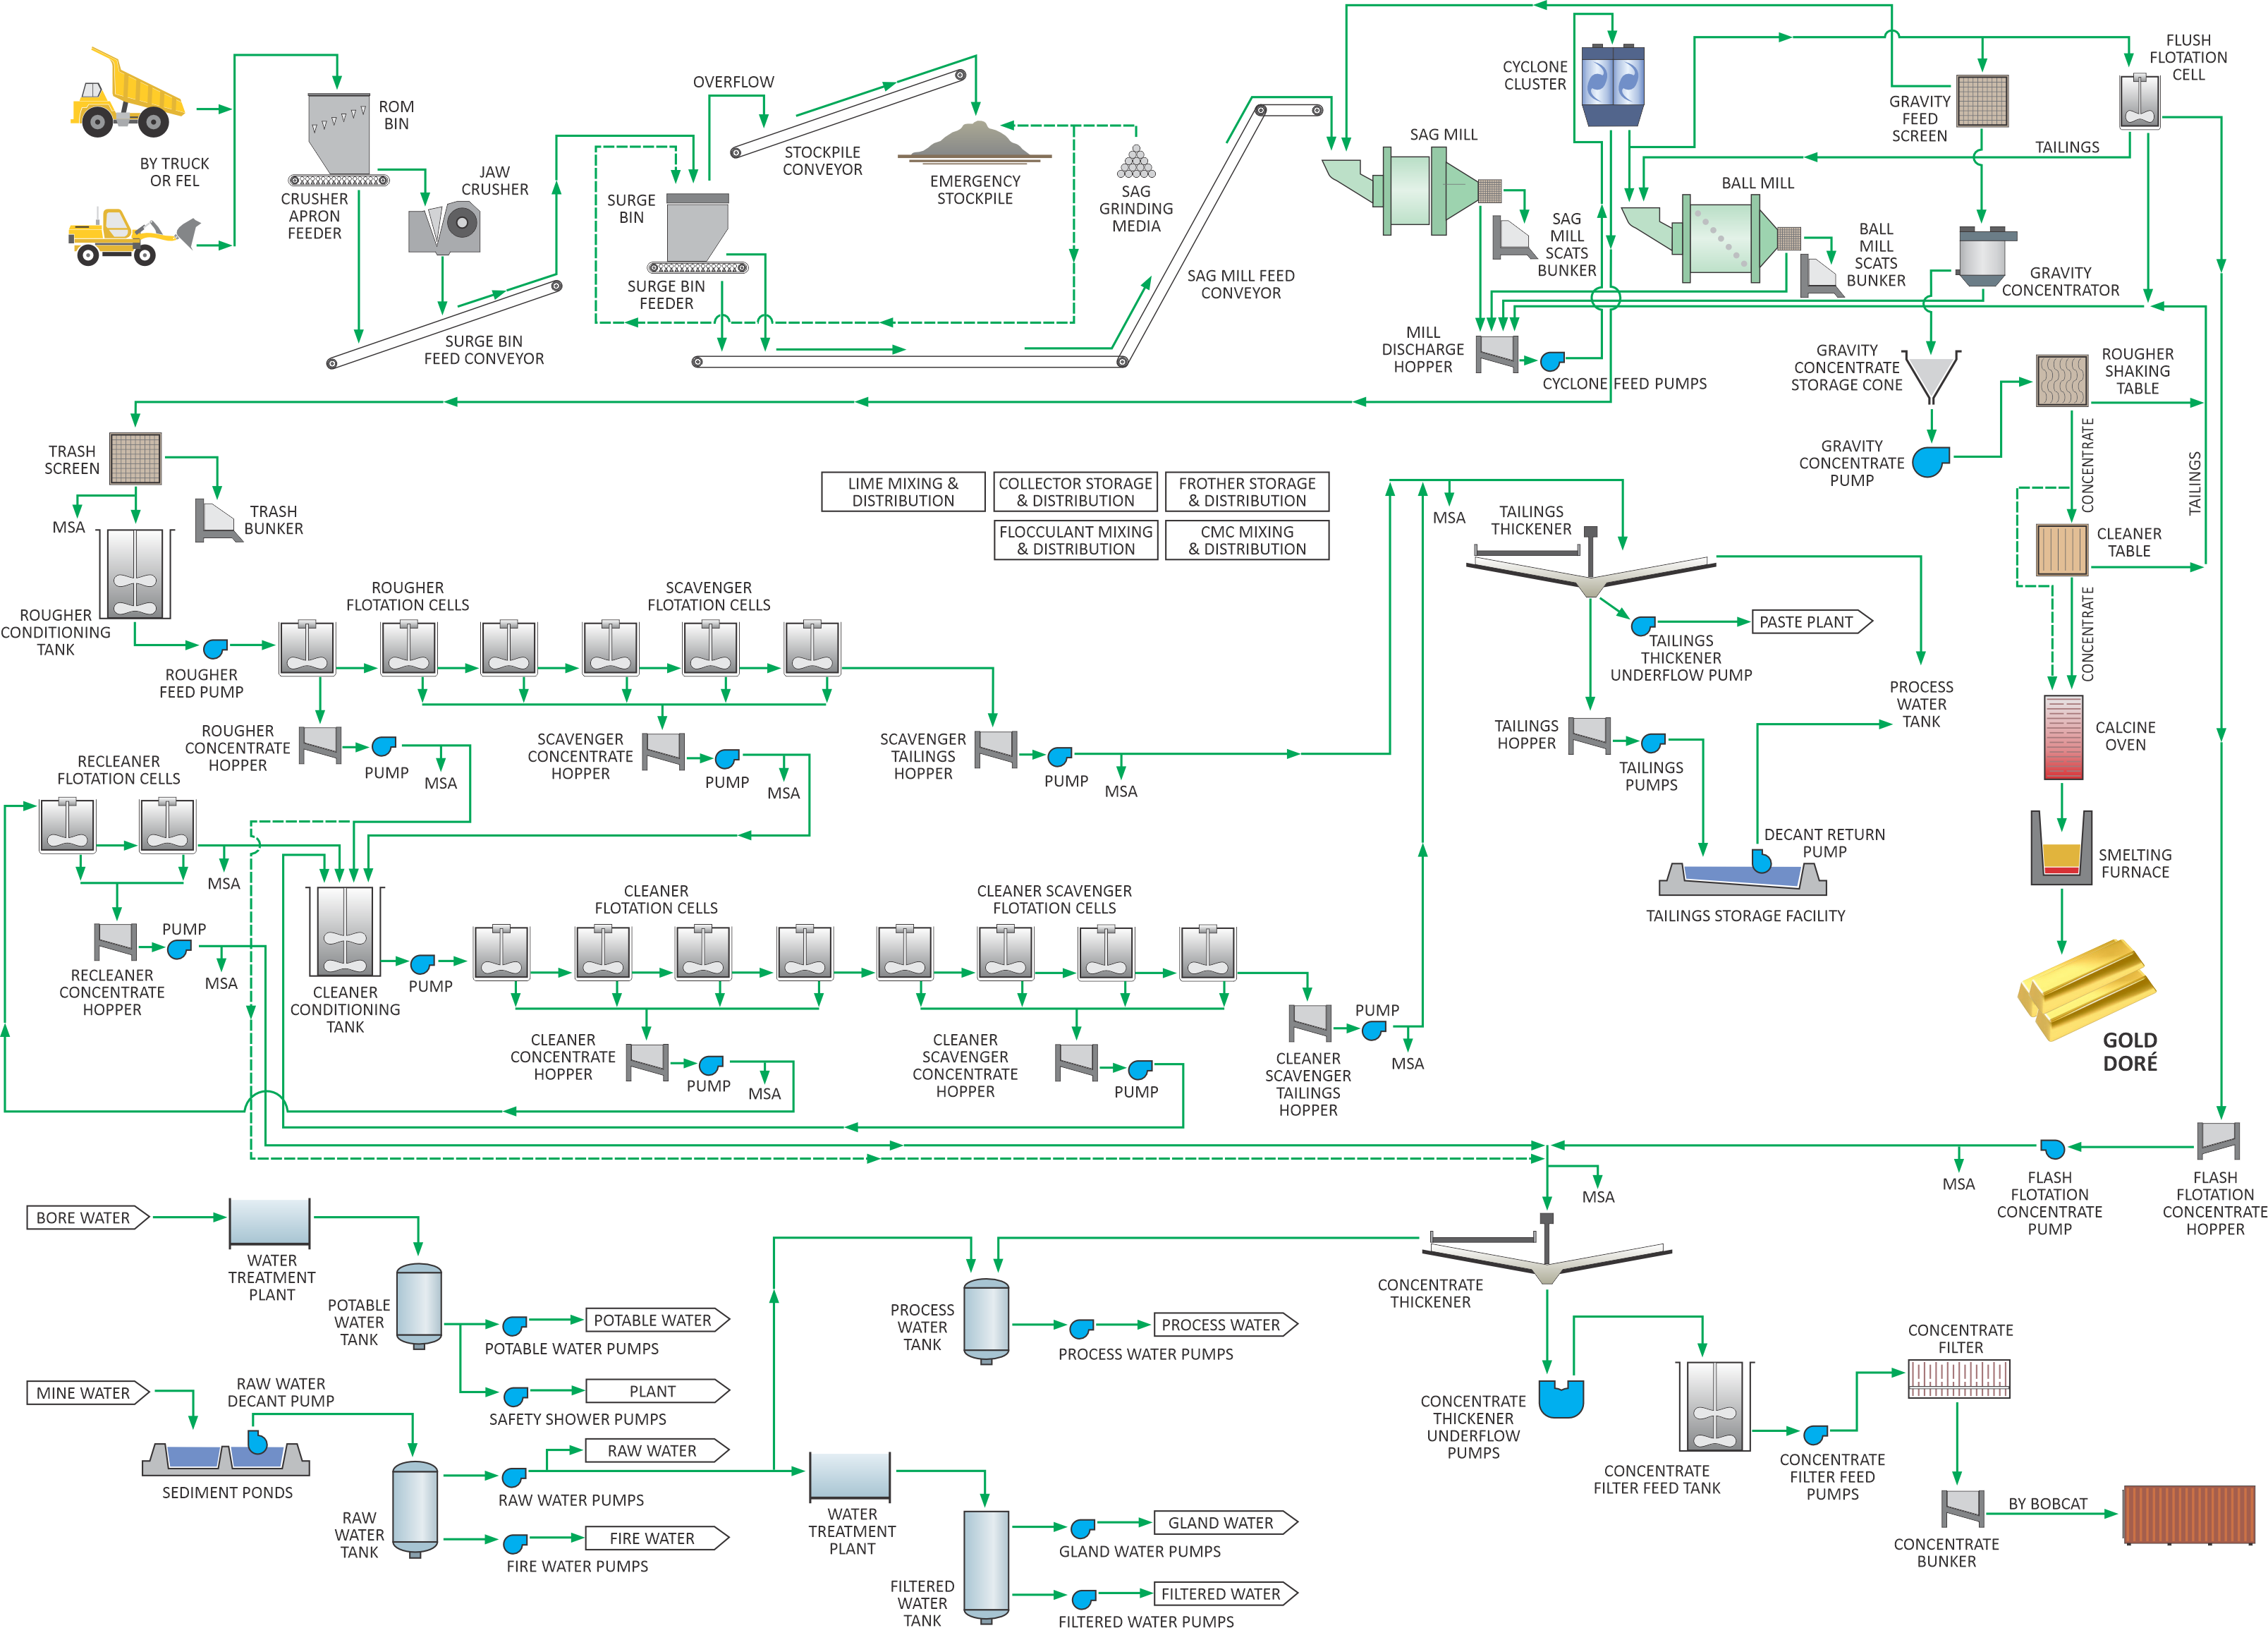
Run-of-mine (ROM) material is trucked ~6 km from the 800 Portal to the Kainantu process plant, where it is either stockpiled or direct tipped into the crusher. The 1.2 mtpa processing plant design flowsheet incorporates a conventional single stage jaw crusher (200 tph) reporting to a crushed ore overflow surge bin and dead stockpile which provides 12 hours of stockpile capacity. The primary crushed ore supplies a SAB milling circuit (150 tph) that includes an open circuit SAG mill and closed circuit ball mill. The ball mill product reports to hydrocyclones, with cyclone overflow reporting to the flotation circuit and the cyclone underflow stream being split between the gravity circuit, flash flotation circuit and ball mill for grinding.
The gravity circuit involves one batch centrifugal concentrator followed by two stages of gravity separation using shaking tables to upgrade the gravity concentrate, which is then calcined and smelted to produce gold doré. The flotation circuit includes flash flotation and conventional sulphide flotation, followed by thickening and filtering to produce a gold-copper-silver concentrate. The circuit is based on simple conventional technology with the flowsheet largely similar but optimized from the existing Kainantu processing plant. The key difference between the existing plant and the proposed Stage 3 Expansion process plant is the implementation of a one stage crushing circuit (vs two stage crushing) and two stages of milling with a SAG and ball mill (vs one stage of ball milling).
Tailings management upgrades would be part of the Stage 3 Expansion, through the construction of a pastefill plant to provide improved underground support and reduce surface tailings deposition needs. Thickened tailings at the process plant are designed to be dewatered in filter presses and trucked to the underground pastefill plant, with the final pastefill product pumped to stope voids as fill. Remaining thickened tailings report to the tailings impoundment on the surface. To support the increased processing capacity, implementation of the pastefill plant and increased underground mining activity, the standby diesel generator capacity is expanded.
Papua New Guinea Power Limited (“PNG Power”) have completed engineering information which has been used in the DFS and involves an upgrade of the local electrical grid to facilitate improved availability and distribution of clean hydroelectricity to the mine. This is expected to considerably reduce the mine’s Scope 1 and Scope 2 greenhouse gas emission intensity per ounce produced - the amount of diesel fuel consumed for backup generators. K92 has already engaged with PNG Power to commence this project and the Company expects it to have a notable improvement on our greenhouse gas emission intensity over the next 6 to 12 months. In June 2023, the Company announces its 2030 greenhouse reduction target, as part of its ongoing overall sustainability commitments to reduce Scope 1 and Scope 2 emissions by
The tailings storage facility (“TSF”) design was completed by ATC Williams. With the application of pastefill significantly reducing the amount of tailings reporting to surface, the current storage facility approved has sufficient capacity (constructed as staged development) for the DFS mine plan. The TSF is constructed as a downstream type, utilizing Australian and International guidelines and standards.
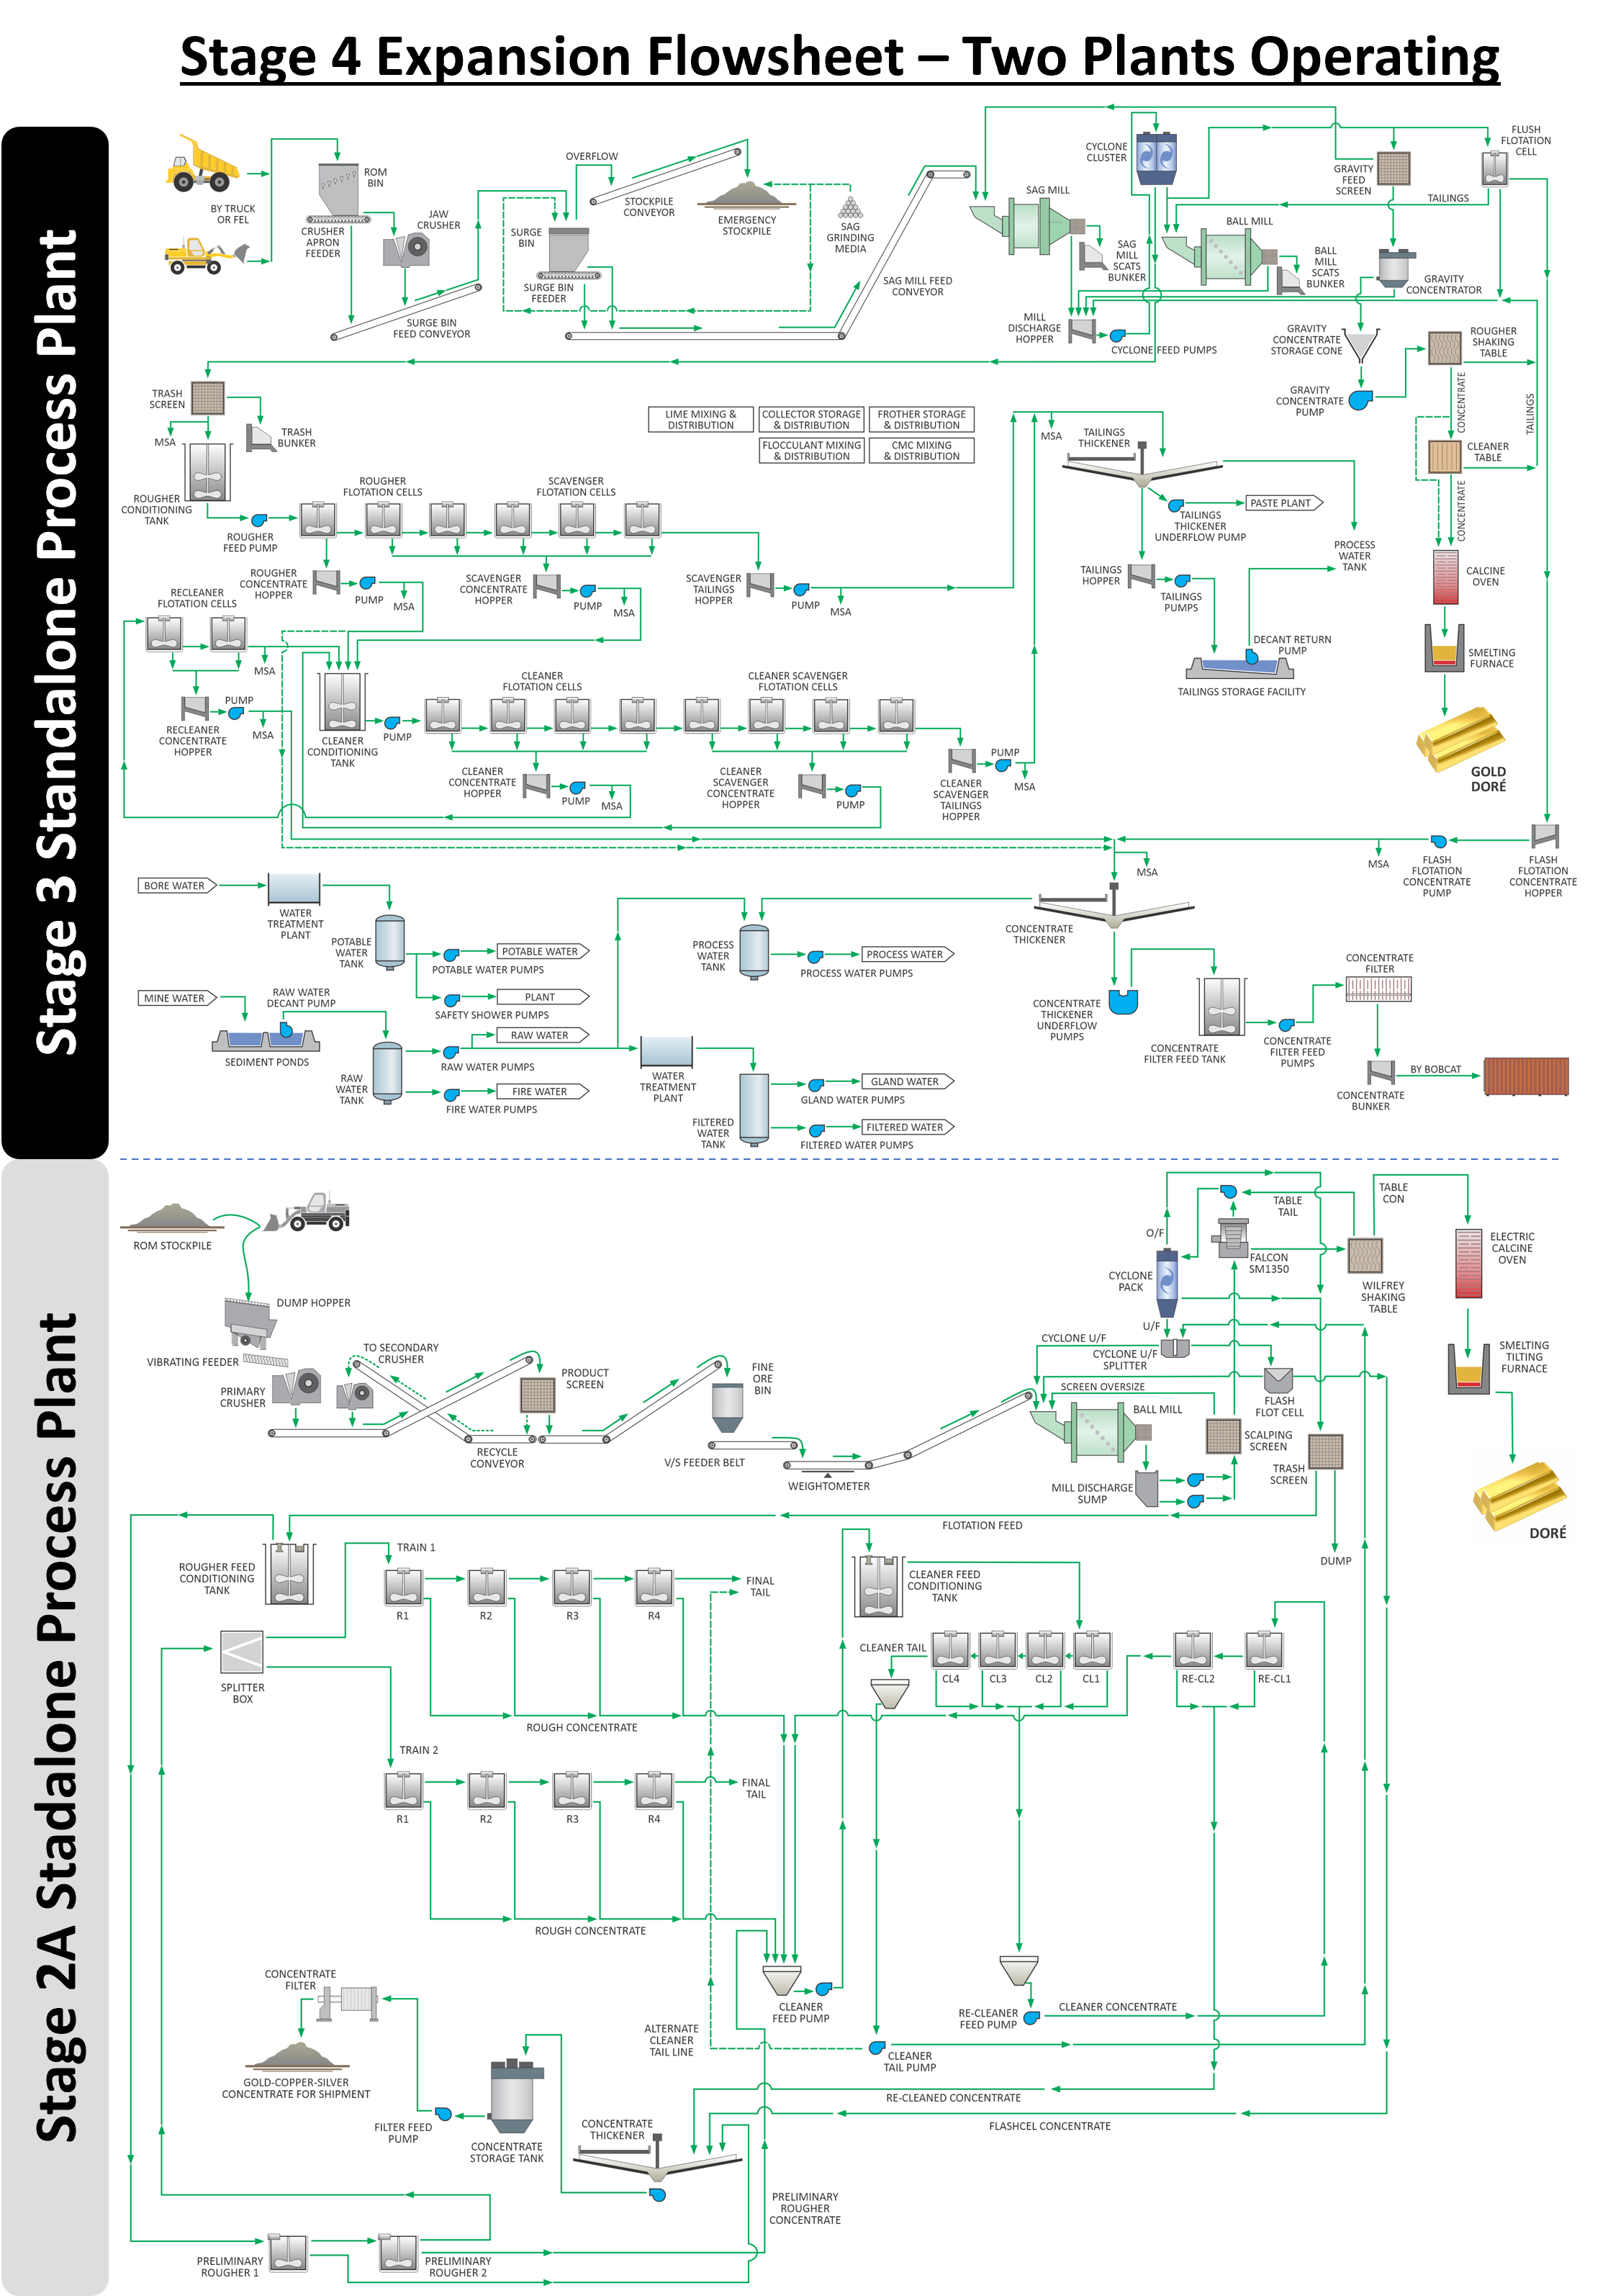
Figure 1.2 – DFS 1.2 mtpa Process Plant Flowsheet
1.6 - DFS Capital and Operating Costs
The initial capital cost estimate in the DFS includes contingency ranging from
Table 1.4: DFS - Capital Cost Estimates
| US Dollars unless otherwise stated | |
| Process Plant | |
| Paste Plant | |
| River Crossing | |
| Power Station | |
| Electrical Infrastructure | |
| OHPL | |
| Maintenance Facilities | |
| Warehouse | |
| Owner’s Team, Approvals, Indirects | |
| Camp Upgrade | |
| Growth Capital | |
| Total Life of Mine Sustaining Capital |
Totals may differ due to rounding
Table 1.5: DFS - Operating Cost Estimates (Life of Mine Average)
| US Dollars unless otherwise stated | ||
| Mining Cost ($/t) | ||
| Processing Cost ($/t) | ||
| General & Administrative Cost ($/t) | ||
| Paste Plant Cost ($/t processed) | ||
| TSF ($/t processed) | ||
| Transport and Insurance ($/t processed) | ||
| Royalties ($/t processed) | ||
| Total Cost Per Tonne Processed ($/t) | $156.30 | |
| Sustaining Capital per Tonne of Processed ($/t) | ||
| Total Cost Per Tonne Processed ($/t) | $210.88 | |
Totals may differ due to rounding
1.7 DFS – Economic Analysis
Entech prepared a conceptual cashflow and discounted cashflow derived from the life-of-mine schedule. Tax calculations for the after-tax cashflow and discounted cashflow were prepared by K92. A summary of the cashflow analyses is shown in Table 1.6 and a sensitivity analysis to gold price is shown in Table 1.7.
Table 1.6: DFS - Simplified Financial Model at US
| Year | 2024 | 2025 | 2026 | 2027 | 2028 | 2029 | 2030 |
| Mill Throughput (ktpa) | 473 | 800 | 1,001 | 1,200 | 1,200 | 1,200 | 302 |
| Gold Grade (g/t) | 7.59 | 6.54 | 6.43 | 6.86 | 5.26 | 6.48 | 11.66 |
| Copper Grade (%) | |||||||
| Silver Grade (g/t) | 11.48 | 12.04 | 14.37 | 22.44 | 25.07 | 18.50 | 24.39 |
| AuEq Grade (g/t) | 8.72 | 7.59 | 7.63 | 8.95 | 8.00 | 8.52 | 13.72 |
| Gold Produced (000s oz) | 107 | 154 | 190 | 245 | 190 | 231 | 106 |
| Silver Produced (000s oz) | 136 | 241 | 361 | 675 | 754 | 557 | 185 |
| Copper Produced (m lbs) | 5.9 | 9.1 | 12.7 | 27.5 | 37.1 | 27.4 | 6.8 |
| AuEq Produced (000s oz) | 122 | 179 | 225 | 319 | 287 | 303 | 125 |
| Net Revenue (US$m)(1) | |||||||
| Total OPEX (US$m)(1) | |||||||
| Growth Capital (US$m) | - | - | - | - | - | ||
| Sustaining Capital (US$m) | |||||||
| After-tax CF (US$m) | ( | ( | |||||
| Cumulative After-tax CF (US$m) | ( | ( |
- Net revenue in summary model excludes the impact of royalty payments and transport costs. These are included within operating costs.
Figure 1.3 – DFS Material Movement Schedule
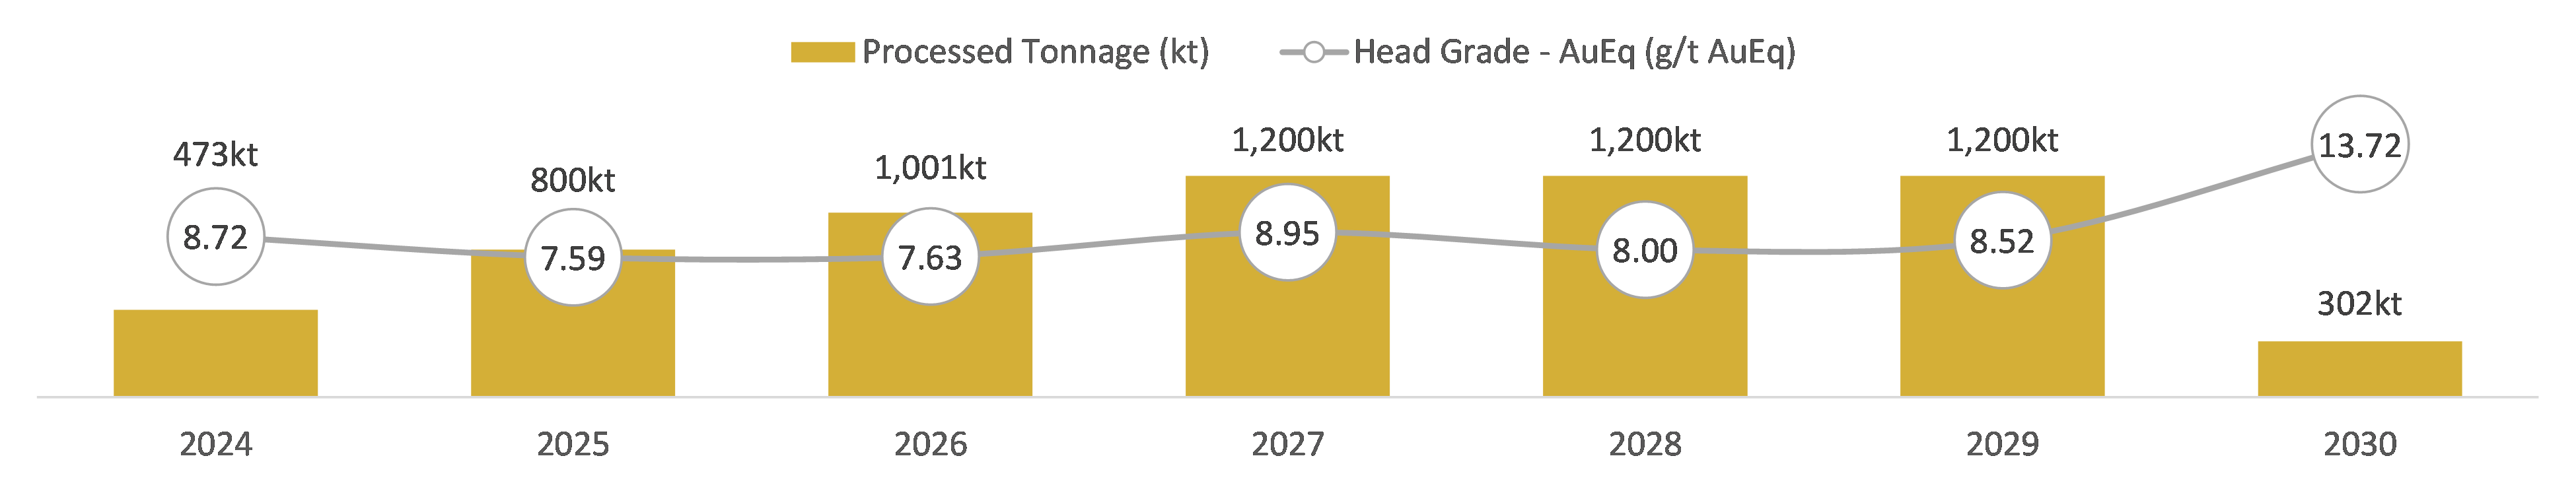
Figure 1.4 – DFS Production and All-in Sustaining Cost (Co-Product) Schedule
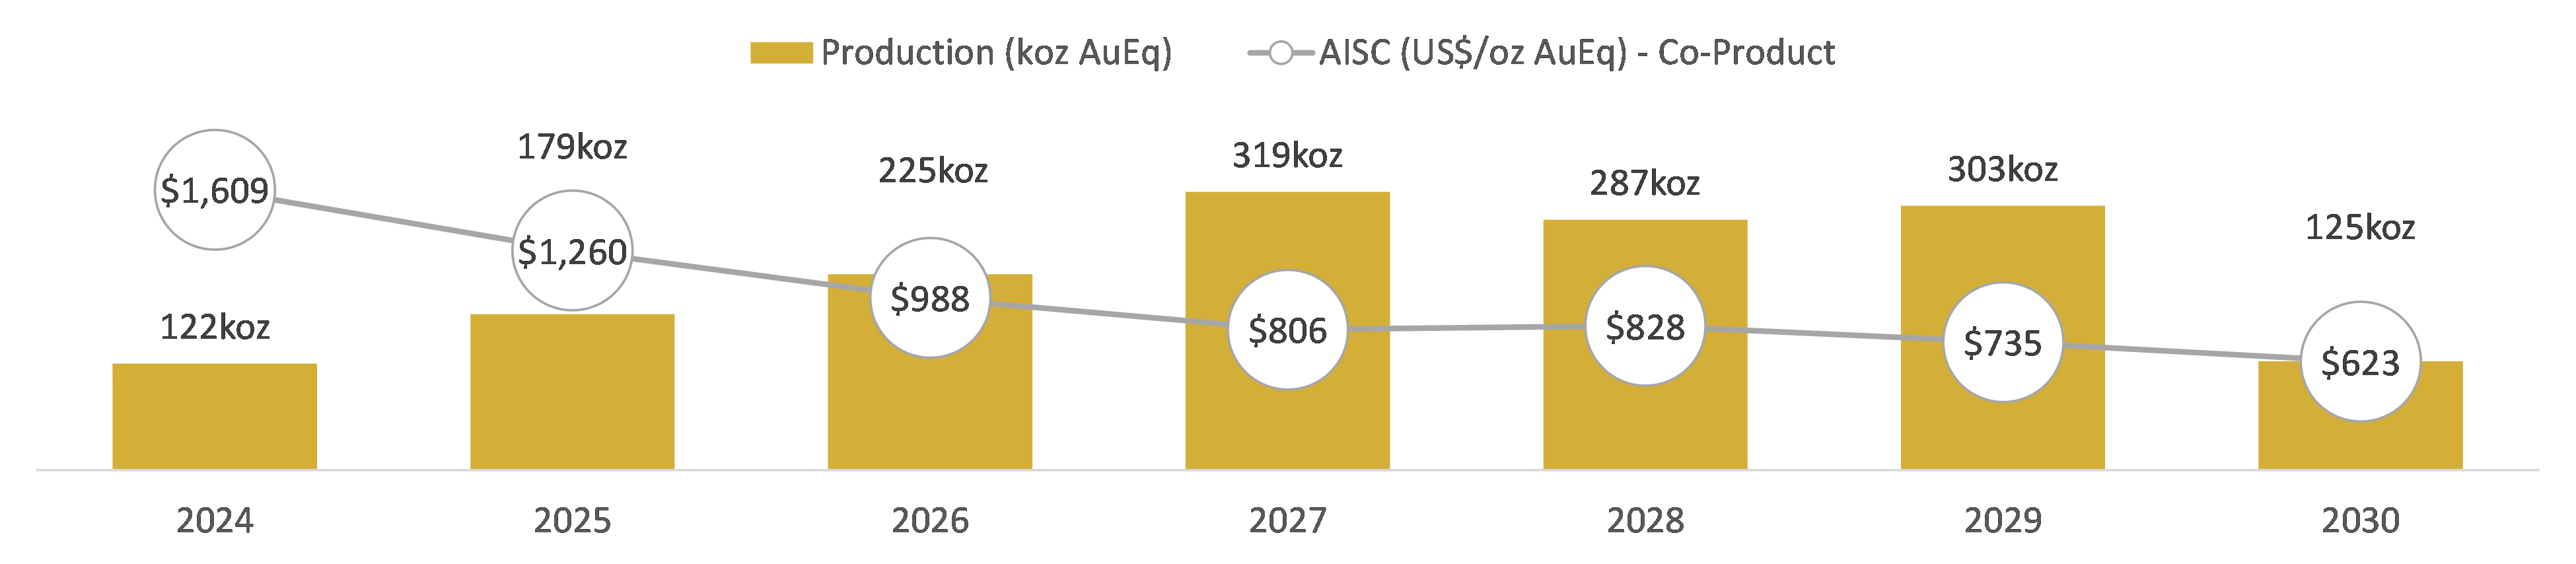
Figure 1.5 – DFS Cash Flow Projects at US
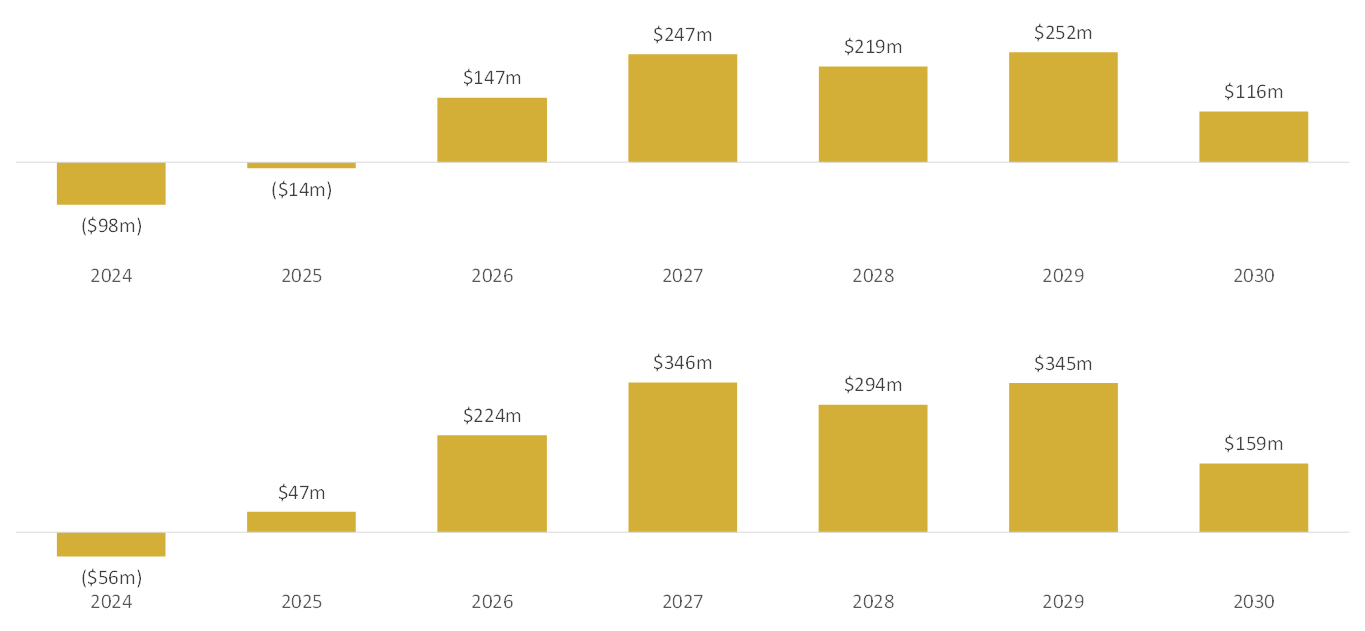
Table 1.7: DFS - After-Tax NPV5% Sensitivity to Gold Price
| Gold Price | After-Tax NPV5% (US$M) | ||
| $1,900 | $680 | ||
2 – Kainantu Updated IDP - Preliminary Economic Assessment Case
2.1 – PEA Overview
The alternative PEA Case conceptualizes a multi-expansion plan to an ultimate plant run-rate of 1.8 mtpa, representing a
To support the higher throughput rate, the underground mining fleet is significantly increased to support expanded mining operations operating multiple mining fronts concurrently: Kora Upper, Lower and Central Zones within the Kora deposit, and the Judd deposit. Site infrastructure is also expanded, including power, camp facilities and the pastefill plant. Several capital items, such as the pastefill system, are configured during the construction of Stage 3 to be amenable to the larger ultimate Stage 4 Expansion run-rate.
The PEA uses the conclusions of the Company’s Mineral Resource estimate for Kora and Judd (effective date of September 12, 2023) and does not incorporate post resource drilling results. The effective date of the PEA life of mine plan is January 1, 2024; therefore, Kora is net of post-resource mining depletion from September 12, 2023 to December 31, 2023 of 183,768 tonnes at 8.1 g/t Au, 0.9 % Cu and 15 g/t Ag.
The PEA is preliminary in nature and includes Inferred Mineral Resources that are considered too speculative geologically to have the economic considerations applied to them that would enable them to be categorized as Mineral Reserves, and there is no certainty that the PEA will be realized. Mineral Resources that are not Mineral Reserves do not have demonstrated economic viability.
Table 2.1: PEA Highlights
| US Dollars unless otherwise stated | Life of Mine (starting January 2024) | Stage 4 Run-Rate(1) (2028 - 2034) |
| Production | ||
| Mine life (years) | 14 years | |
| Total mill feed (000s tonnes) | 20,396 | 12,600 |
| Average mill throughput (000s tonnes per annum) | 1,457 | 1,800 |
| Total Metal Production | ||
| AuEq (000s ounces) | 4,977 | 2,895 |
| Gold (000s ounces) | 3,620 | 2,011 |
| Copper (mlbs) | 508 | 332 |
| Silver (000s ounces) | 11,799 | 7,399 |
| Peak Annual Production | ||
| Year | 2034 | |
| AuEq (000s ounces per annum) | 485 | |
| Average Annual Metal Production | ||
| AuEq (000s ounces per annum) | 356 | 414 |
| Gold (000s ounces per annum) | 259 | 287 |
| Copper (mlbs per annum) | 36 | 47 |
| Silver (000s ounces per annum) | 843 | 1,057 |
| Average Grade | ||
| AuEq grade (g/t) | 8.2 g/t | |
| Gold grade (g/t) | 6.0 g/t | |
| Copper grade (%) | ||
| Silver grade (g/t) | 23 g/t | |
| Average Recovery | ||
| Gold recovery (%) | ||
| Copper recovery (%) | ||
| Silver recovery (%) | ||
| Costs | ||
| Mining cost ($/t ore mined) | ||
| Processing cost ($/t processed) | ||
| General & Administrative cost ($/t processed) | ||
| Paste plant cost ($/t processed) | ||
| TSF cost ($/t processed) | ||
| Transport and Insurance cost ($/t processed) | ||
| Total operating cost per tonne processed (US$/t) | $126.12 | $120.59 |
| Royalties ($/t processed) | ||
| Sustaining capital per tonne of processed (US$/t) | ||
| Total cost per tonne of processed (US$/t) | $181.02 | $166.06 |
| Growth capital expenditure ($m) | ||
| Sustaining capital expenditure ($m) | ||
| Total capital expenditure with closure costs ($m) | $1,122 | |
| Cash cost per ounce AuEq ($/oz)(2) | ||
| All-in sustaining cost per ounce AuEq ($/oz)(3) | ||
| Cash cost per ounce gold ($/oz)(2) | ||
| All-in sustaining cost per ounce gold ($/oz)(3) | ||
| Base Case Economic Analysis at US | ||
| After-tax NPV0% | ||
| After-tax NPV5%(4) | ||
| Economic Analysis at | ||
| After-tax NPV0% | ||
| After-tax NPV5%(4) | ||
- Run-rate calculated based on 2028-2034.
- Cash costs are net of by-product credits and are inclusive of mining costs, processing costs, site G&A and refining charges and royalties.
- AISC includes cash costs plus estimated corporate G&A, sustaining costs and accretion.
- Net present value is calculated utilizing monthly discounting.
2.2 - PEA Mining Operations
The Company engaged Entech to undertake the PEA Case for the Kainantu Project, which involved:
- Applying financial and processing parameters to determine cut-off grades for stope design.
- Generating three-dimensional stope shapes and mining inventory using the Datamine Mineable Shape Optimizer (MSO) program.
- Creating a conceptual development layout to suit the MSO inventory.
- Geotechnical assessment and generating the stoping parameters.
- Ventilation design and ventilation tradeoff studies.
- Mining capital and operating costings.
The mine plan considered in the PEA is designed as an incline access operation with a series of ore passes for efficient material movement between sublevels and the twin incline for material transport to surface. Initially, the mine plan employs a long hole open stoping mining method utilizing Avoca and modified Avoca, with waste rockfill. This mining method has been successfully employed at the mine since Q1 2020 at Kora and Q4 2021 at Judd. The mining method will then transition to long hole open stoping with pastefill in Q2 2025, upon the construction of the pastefill plant. Cemented pastefill provides improved geotechnical conditions for less dilution, higher mining recovery factors, and greater operating flexibility through the ability to mine above and below pastefill, plus a reduction in surface tailings.
Stopes were identified for the PEA mine plan based on the MSO program at a cut-off grade of 4.0 g/t AuEq. Stope shapes with uneconomic development access requirements were excluded from the assessment. Dilution was estimated based on a 0.5 m dilution skin for both the footwall and hanging wall using the MSO program for a minimum stope width of 3.0 m. Additional dilution factor of
The mine plan operates at the Stage 2A Expansion 600,000-tpa throughput until mid-2025, with the operation commencing ramp up to the Stage 3 Expansion run-rate of 1.2 mtpa in late Q2 2025, sequentially ramping-up to the Stage 4 Expansion run-rate of 1.8 mtpa at the beginning of 2028. To support the Stage 4 mining rate, multiple mining fronts are mined concurrently: Kora Central, Kora Upper and Kora Lower within the Kora deposit, and the Judd deposit. See Table 2.6 for a material movement summary as part of the simplified economic model.
Figure 2.1 – PEA Life of Mine Plan – Lateral, Vertical Development and Stope Shapes at 4.0 g/t AuEq cut-off grade (looking West)
2.4 - PEA Mineral Processing, Tailings and Infrastructure
K92 engaged GR Engineering Services, WSP, and ATCW to complete an update to the PEA Stage 4 Expansion process plant, pastefill plant, tailing facility and integration of surface infrastructure design. The PEA conceptualizes constructing a new standalone processing plant for the Stage 3 Expansion adjacent to the existing Stage 2A Expansion process plant. The existing Stage 2A Expansion process plant operates until mid-2025, where it is idled as the Stage 3 Expansion ramps-up (starting in late Q2 2025). The process plants are fed from run-of-mine (ROM) material that is trucked ~6km from the 800 Portal to the Kainantu process plant, where it is either stockpiled or direct tipped into the crusher.
The Stage 3 Expansion process plant design flowsheet incorporates a conventional comminution circuit, utilizing a single stage of jaw crushing (200 tph) reporting to a crushed ore overflow surge bin, followed by a SAB milling circuit (150 tph) with an open circuit SAG mill and close circuit ball mill. The ball mill product reports to cyclone classification, where the cyclone overflow reports to the flotation circuit and the cyclone underflow stream being split between the gravity circuit, flash flotation circuit and ball mill for grinding. The gravity circuit involves one batch centrifugal concentrator followed by two stages of gravity separation using shaking tables. The upgraded gravity concentrate is then calcined and smelted to produce gold doré. The flotation circuit consists of flash flotation and conventional sulphide flotation, followed by thickening and filtering to produce a gold-copper-silver concentrate.
Processing performance estimates were based on a combination of test work and operating results. Over the period, January 2018 to August 2024, six stages of processing plant upgrades allowed increased throughput and improved recovery performance. The plant has operated in its current configuration (Stage 2A expansion) since June 2023. Metal recovery factors for the PEA were based on an analysis of processing results from June 2023 until August 2024, plus a consideration of economic factors associated with metals offtake agreements and concentrate transport costs.
The PEA incorporates tailings management upgrades, with underground pastefill commencing in Q3 2025 upon the completion of construction of the pastefill plant. The delivery of pastefill involves pumping thickened tailings from the process plant, then dewatered in filter presses and trucked to the underground pastefill plant. This is followed by pumping the final pastefill product into stope voids. Remaining tailings are pumped to the tailings impoundment as thickened tailings. The significant increase to processing capacity, mining rates and underground infrastructure requires additions to the standby diesel generating capacity on site. The PEA also involves an upgrade to the local electrical grid to facilitate improved availability and distribution of clean hydroelectricity to the mine. This upgrade is expected to materially reduce overall Scope 1 and Scope 2 greenhouse gas emission intensity per ounce produced. In June 2023, the Company announced its 2030 greenhouse reduction target, as part of its ongoing overall sustainability commitments to reduce Scope 1 and Scope 2 emissions by
The implementation of pastefill significantly reduces the amount of tailings reporting to the TSF. The existing TSF has sufficient tailings capacity until 2029, after which tailings then report to the new TSF. The development of the new tailings facility is situated less than 2 km from the existing TSF with a number of suitable sites identified. The new tailings facility design has significant capacity beyond the material movements in the PEA. The existing and proposed new TSF is by downstream construction methods, suitable for the climate and geotechnical environment of mine site with Australian and international guidelines and Standards being met or exceeded. The TSF design work was completed by ATC Williams.
Figure 2.2 – PEA 1.8 mtpa Process Plant Flowsheet
2.5 - PEA Capital and Operating Costs
The growth capital cost estimate includes a contingency ranging from
Table 2.4: PEA - Capital Cost Estimates
| US Dollars unless otherwise stated | |
| Process Plant | |
| Paste Plant | |
| River Crossing | |
| Power Station | |
| Electrical Infrastructure | |
| OHPL | |
| Maintenance Facilities | |
| Warehouse | |
| Owner’s Team, Approvals, Indirects | |
| Camp Upgrade | |
| Growth Capital | |
| Total Life of Mine Sustaining Capital |
Totals may differ due to rounding
Table 2.5: PEA - Operating Cost Estimates (Life of Mine Average)
| US Dollars unless otherwise stated | ||
| Mining Cost ($/t ore mined) | ||
| Processing Cost ($/t processed) | ||
| General & Administrative Cost ($/t processed) | ||
| Paste Plant Cost ($/t processed) | ||
| TSF ($/t processed) | ||
| Transport and Insurance ($/t processed) | ||
| Royalties ($/t processed) | ||
| Total Cost Per Tonne Processed ($/t) | $136.87 | |
| Sustaining Capital per Tonne of Processed ($/t) | ||
| Total Cost Per Tonne Processed ($/t) | $181.02 | |
Totals may differ due to rounding
2.6 PEA - Economic Analysis
Entech prepared a conceptual cashflow and discounted cashflow derived from the life-of-mine schedule. Tax calculations for the after-tax cashflow and discounted cashflow were prepared by K92. A summary is shown in Table 2.6 and a sensitivity analysis to gold price is shown in Table 2.7.
Table 2.6: PEA - Simplified Financial Model at US
| Year | 2024 | 2025 | 2026 | 2027 | 2028 | 2029 | 2030 | 2031 | 2032 | 2033 | 2034 | 2035 | 2036 | 2037 |
| Mill Throughput (ktpa) | 469 | 802 | 1,059 | 1,440 | 1,800 | 1,800 | 1,800 | 1,800 | 1,800 | 1,800 | 1,800 | 1,742 | 1,566 | 718 |
| Gold Grade (g/t) | 7.45 | 6.34 | 6.12 | 6.55 | 5.98 | 4.58 | 3.59 | 4.77 | 6.59 | 4.73 | 7.29 | 6.03 | 7.53 | 10.08 |
| Copper Grade (%) | 0.75 | 0.73 | 0.69 | 0.86 | 1.21 | 1.35 | 1.57 | 1.45 | 1.11 | 1.25 | 0.93 | 1.36 | 1.45 | 1.30 |
| Silver Grade (g/t) | 13.93 | 13.91 | 12.89 | 16.04 | 19.76 | 24.87 | 27.90 | 26.54 | 21.20 | 22.31 | 21.35 | 27.65 | 32.09 | 31.48 |
| AuEq Grade (g/t) | 8.86 | 7.71 | 7.41 | 8.16 | 8.21 | 7.10 | 6.50 | 7.48 | 8.66 | 7.06 | 9.09 | 8.59 | 10.30 | 12.60 |
| Gold Produced (000s oz) | 104 | 150 | 191 | 279 | 321 | 246 | 194 | 256 | 352 | 253 | 390 | 313 | 354 | 218 |
| Silver Produced (000s oz) | 164 | 280 | 342 | 579 | 892 | 1,123 | 1,259 | 1,198 | 957 | 1,007 | 964 | 1,208 | 1,260 | 567 |
| Copper Produced (m lbs) | 7 | 12 | 15 | 25 | 45 | 51 | 59 | 55 | 41 | 47 | 35 | 49 | 47 | 20 |
| AuEq Produced (000s oz) | 123 | 182 | 231 | 347 | 440 | 380 | 350 | 401 | 462 | 377 | 485 | 445 | 482 | 272 |
| Net Revenue (US$m)(1) | ||||||||||||||
| Total OPEX (US$m)(1) | ||||||||||||||
| Growth Capital (US$m) | - | - | - | - | - | - | - | - | - | - | - | - | ||
| Sustaining Capital (US$m) | ||||||||||||||
| After-tax Net CF (US$m) | ( | ( | ||||||||||||
| Cumulative After-tax Net CF (US$m) | ( | ( | ( |
- Net revenue in summary model excludes the impact of royalty payments and transport costs. These are included within total operating costs.
Figure 2.3 – PEA Material Movement Schedule
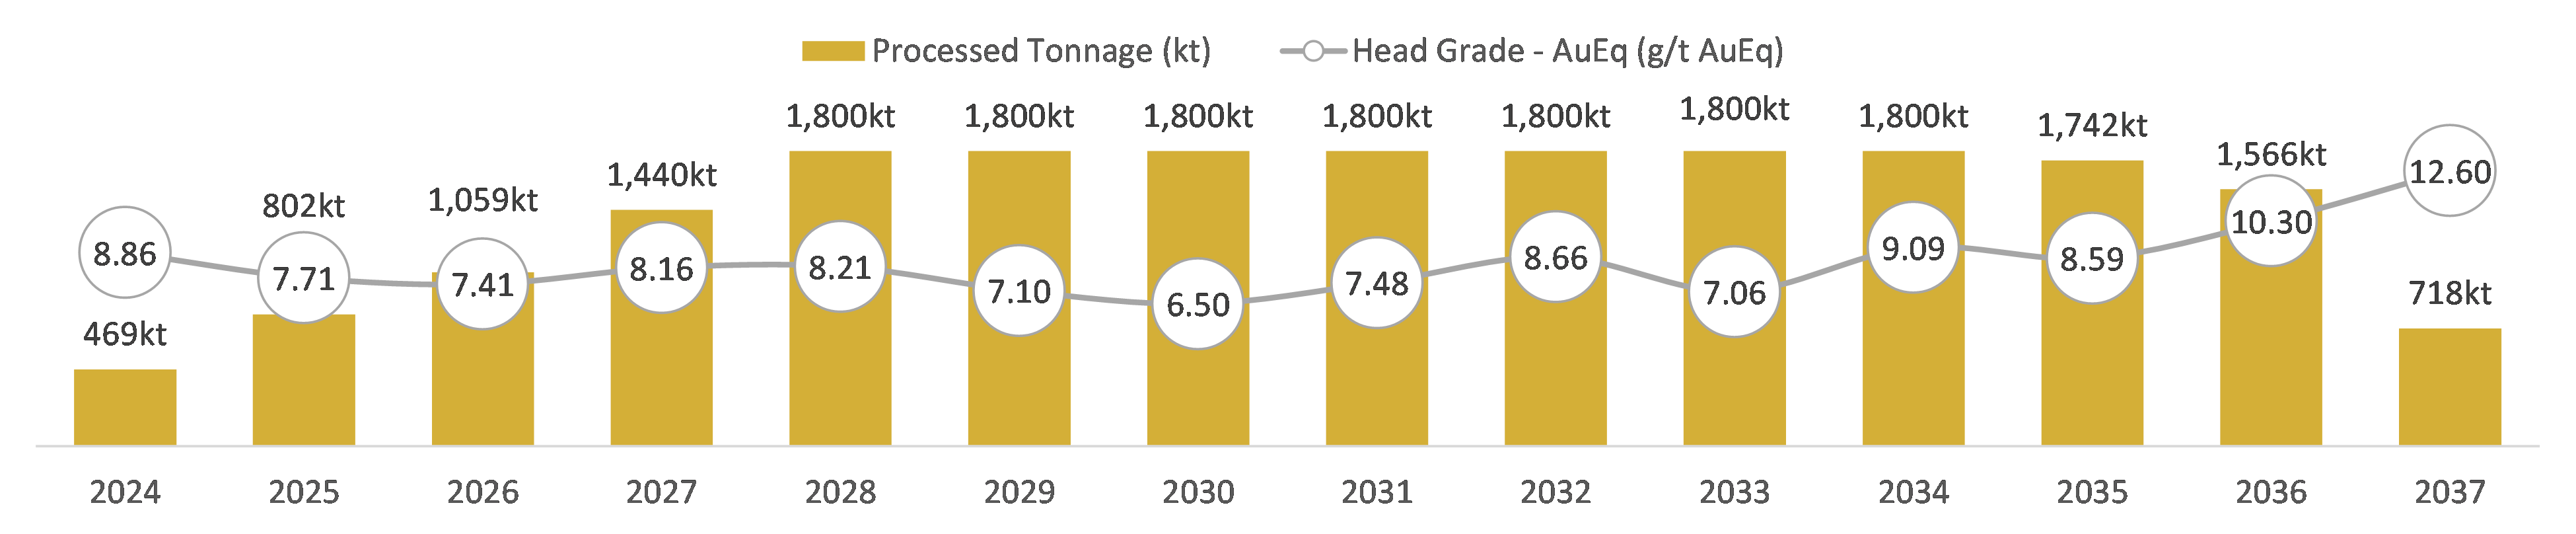
Figure 2.4 – PEA Production and All-in Sustaining Cost (Co-Product) Schedule
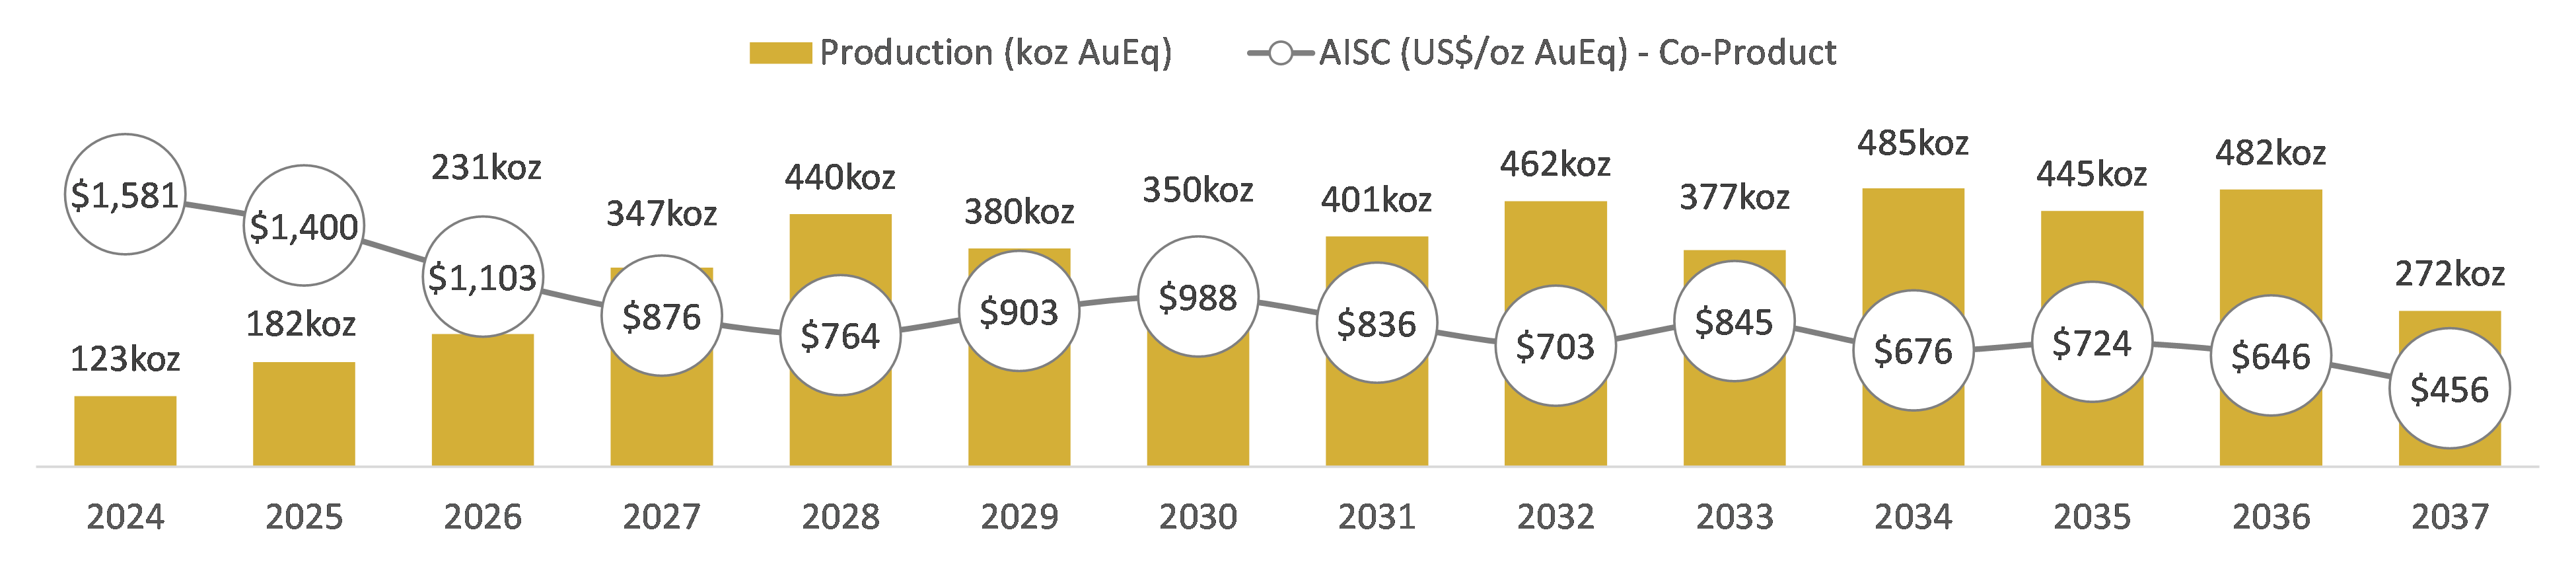
Figure 2.5 – PEA Cash Flow Projects at US
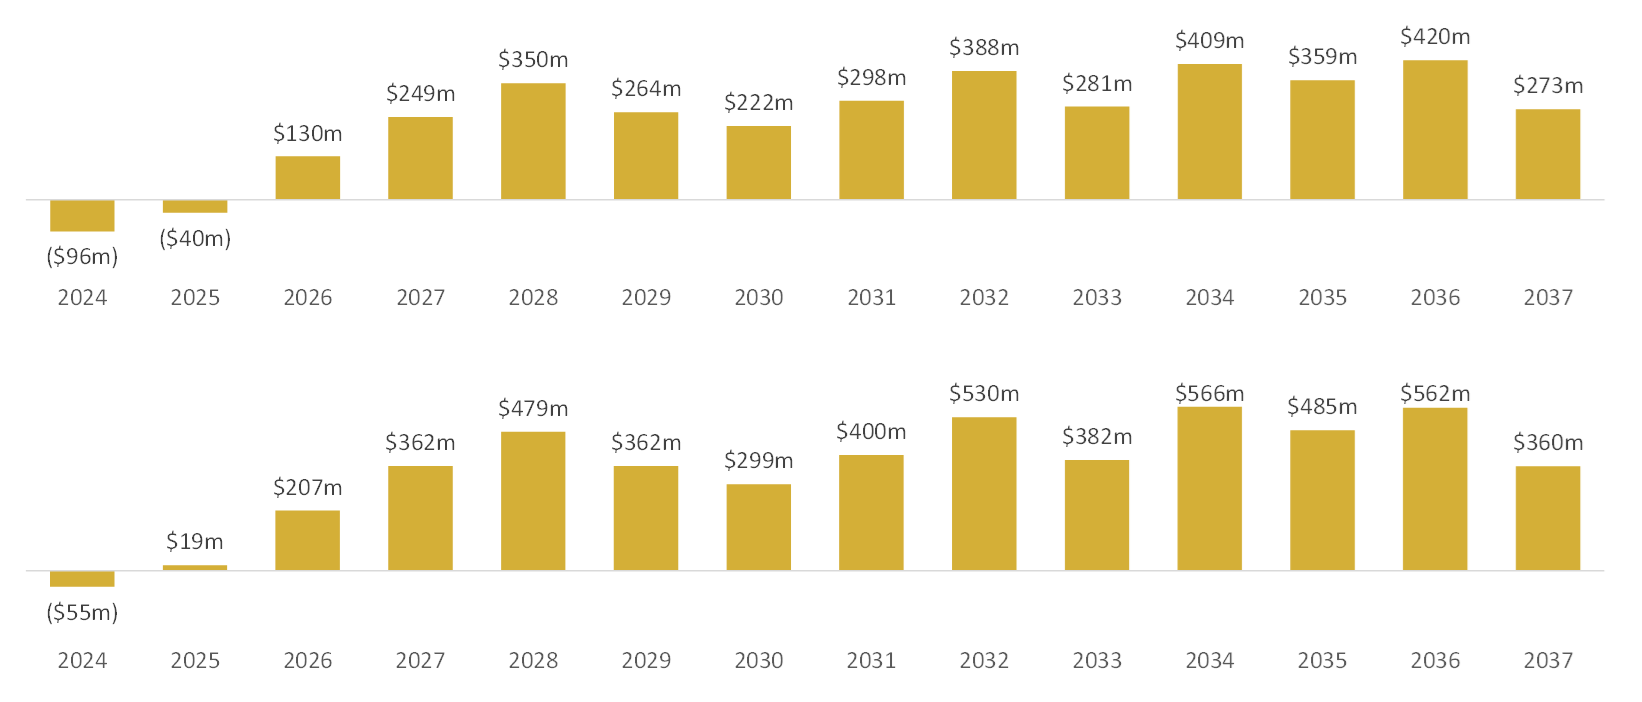
Table 2.7: PEA - After-Tax NPV5% Sensitivity to Gold Price
| Gold Price | After-Tax NPV5% (US$M) | |||
| $1,900 | $2,295 | |||
Diamond Drill and Face Sampling Methodology, Data Verification and QA / QC
Diamond drill holes are first logged to determine the sampling intervals, which range from a minimum of 0.1 m to generally 1.0 m. The drill core is sawn half core cut along a reference line, with the remainder of the core returned to the core tray. Core samples are then placed in numbered calico and plastic bags, with a numbered sample ticket for dispatch to the assay laboratory. Samples are separately assayed for gold, copper and silver. K92’s procedure includes the insertion standards, blanks and duplicates. Gold assays are by the fire assay method. Copper and silver assays are by three-acid-digestion method (nitric, perchloric & hydrochloric mix).
Face channel samples under geological control, were taken across the full face of both the exposed lode system and any waste rock, with sample intervals ranging from 0.1 m to 1 m in width depending on the geologist’s interpretation. Two samples were taken per interval at waist and knee height and the corresponding widths recorded. Samples are approximately 3.5 kg in size. Samples were separately assayed for gold, copper and silver, and the results averaged out using length weighting and channel orientation before entry into the database. K92’s procedure includes the insertion standards, blanks and duplicates for the face sampling. Gold assays are by the fire assay method. Copper and silver assays are by three-acid-digestion method (nitric, perchloric & hydrochloric mix).
K92 maintains an industry-standard analytical quality assurance and quality control (QA/QC) and data verification program to monitor laboratory performance and ensure high quality assays. Results from this program confirm reliability of the assay results. All sampling and analytical work for the mine exploration program is performed by Intertek Testing Services (PNG) LTD, an independent accredited laboratory that is located on site. External check assays for QA/QC purposes are performed at SGS Australia Pty Ltd in Townsville, Queensland, Australia.
The analytical QA/QC program is currently overseen by Andrew Kohler, PGeo, Mine Geology Manager and Mine Exploration Manager for K92. Andrew Kohler, a qualified person under the meaning of Canadian National Instrument 43-101 – Standards of Disclosure for Mineral Projects.
Conference Call and Webcast to Present Results
K92 will host a conference call and webcast to present the Updated Kainantu Gold Mine Integrated Development Plan at 5:30 pm (EDT) on Wednesday, October 16, 2024.
- Listeners may access the conference call by dialing toll-free to 1-844-763-8274 within North America or +1-647-484-8814 from international locations.
The conference call will also be broadcast live (webcast) and may be accessed via the following link: https://event.choruscall.com/mediaframe/webcast.html?webcastid=XJgneEhG
Qualified Person
K92 Mine Chief Geologist, Mr. Andrew Kohler, P.Geo, a Qualified Person under the meaning of NI 43-101 has reviewed and approved the technical content of this news release. The Company strictly adheres to CIM Best Practices Guidelines in conducting, documenting, and reporting the exploration activities on its projects.
Simon Tear, P.Geo of H & S Consultants Pty Ltd of Sydney, Australia is a Qualified Person as defined under NI 43-101 and has reviewed and approved the contents of this press release. Mr. Tear is an independent consultant and is responsible for the 2023 Mineral Resource estimate for Kora and Judd.
Brendan Mulvihill, MAusIMM (CP Met), RPEQ of GR Engineering Services Limited of Brisbane, Australia is a Qualified Person as defined under NI 43-101 and has reviewed and approved the contents of this press release. Mr. Mulvihill is an independent consultant and is responsible for the process plant design.
Daniel Donald, B.Eng Hons (Mining) MBA FAusIMM MSME of Entech Pty Ltd of Perth, Australia is a Qualified Person as defined under NI 43-101 and has reviewed and approved the contents of this press release. Mr. Donald is an independent mining consultant and is responsible for mine planning and cost modelling. Mr. Donald completed a site visit from May 29th to 31st 2024.
Dr. Evan Kirby, of Metallurgical Management Services Pty Ltd of Perth, Australia is a Qualified Person as defined under NI 43-101 and has reviewed and approved the contents of this press release. Dr. Kirby is an independent consultant responsible for minerals processing test work, analysis of plant operating results and estimating metals recovery factors.
Isaac Ahmed, P.Eng of WSP Canada Inc. of Ontario, Canada is a Qualified Person as defined under NI 43-101 and has reviewed and approved the contents of this press release. Mr. Ahmed is an independent consultant and is responsible for the pastefill delivery and pastefill plant design.
Ralph Holding, FIEAust, CPEng, IEPNG of ATC Williams Pty Ltd of Brisbane, Australia is a Qualified Person as defined under NI 43-101 and has reviewed and approved the contents of this press release. Mr. Holding is an independent consultant and is responsible for the tailing storage facility design.
Nicholas Currey, MAusIMM of EMM Consulting Pty Ltd of Queensland, Australia is a Qualified Person as defined under NI 43-101 and has reviewed and approved the contents of this press release. Mr. Currey is an independent consultant and is responsible for environmental studies and community impact.
On Behalf of the Company,
John Lewins, Chief Executive Officer and Director
For further information, please contact David Medilek, P.Eng., CFA at +1-604-416-4445.
About K92
K92 Mining Inc. is engaged in the production of gold, copper and silver at the Kainantu Gold Mine in the Eastern Highlands province of Papua New Guinea, as well as exploration and development of mineral deposits in the immediate vicinity of the mine. The Company declared commercial production from Kainantu in February 2018, is in a strong financial position, and is working to become a Tier 1 mid-tier producer through ongoing plant expansions. K92 is operated by a team of mining company professionals with extensive international mine-building and operational experience.
Non-GAAP Financial Measures
In this press release, we use the terms “cash costs" and "all-in sustaining costs ". These should be considered as non-GAAP financial measures as defined in applicable Canadian securities laws and should not be considered in isolation or as a substitute for measures of performance prepared in accordance with GAAP.
Cash costs per ounce is a non-GAAP term typically used by gold mining companies to assess the level of gross margin available to the Company by subtracting these costs from the unit price realized during the period. This non-GAAP term is also used to assess the ability of a mining company to generate cash flow from operations. Cash costs per ounce includes mining and processing costs plus applicable royalties, and net of by-product revenue and net realizable value adjustments. Total cash costs per ounce is exclusive of exploration costs.
Cash costs per ounce is intended to provide additional information only and does not have any standardized meaning under IFRS and may not be comparable to similar measures presented by other mining companies. It should not be considered in isolation or as a substitute for measures of performance prepared in accordance with IFRS. The measure is not necessarily indicative of cash flow from operations under IFRS or operating costs presented under IFRS.
The Company adopted an "all-in sustaining costs per ounce" non-GAAP performance measure in accordance with the World Gold Council published in June 2013. The Company believes the measure more fully defines the total costs associated with producing gold; however, this performance measure has no standardized meaning. Accordingly, there may be some variation in the method of computation of "all-in sustaining costs " as determined by the Company compared with other mining companies. In this context, "all-in sustaining costs" for the consolidated Company reflects total mining and processing costs, corporate and administrative costs, exploration costs, sustaining capital, and other operating costs.
All-in sustaining costs per gold ounce is intended to provide additional information only and does not have any standardized meaning under IFRS and may not be comparable to similar measures presented by other mining companies. It should not be considered in isolation or as a substitute for measures of performance prepared in accordance with IFRS.
CAUTIONARY STATEMENT REGARDING FORWARD-LOOKING INFORMATION: This news release includes certain “forward-looking statements” under applicable Canadian securities legislation. Such forward-looking statements include, without limitation: (i) the results of the Kainantu Project DFS, and the Kainantu 2022 PEA, including the Stage 3 Expansion, a new standalone 1.2 mtpa process plant and supporting infrastructure; (ii) statements regarding the expansion of the mine and development of any of the deposits; and (iii) the Kainantu Stage 4 Expansion, operating two standalone process plants, larger surface infrastructure and mining throughputs.
All statements in this news release that address events or developments that we expect to occur in the future are forward-looking statements. Forward-looking statements are statements that are not historical facts and are generally, although not always, identified by words such as “expect”, “plan”, “anticipate”, “project”, “target”, “potential”, “schedule”, “forecast”, “budget”, “estimate”, “intend” or “believe” and similar expressions or their negative connotations, or that events or conditions “will”, “would”, “may”, “could”, “should” or “might” occur. All such forward-looking statements are based on the opinions and estimates of management as of the date such statements are made. Forward-looking statements are necessarily based on estimates and assumptions that are inherently subject to known and unknown risks, uncertainties and other factors, many of which are beyond our ability to control, that may cause our actual results, level of activity, performance or achievements to be materially different from those expressed or implied by such forward-looking information. Such factors include, without limitation, Public Health Crises, including the COVID-19 Pandemic; changes in the price of gold, silver, copper and other metals in the world markets; fluctuations in the price and availability of infrastructure and energy and other commodities; fluctuations in foreign currency exchange rates; volatility in price of our common shares; inherent risks associated with the mining industry, including problems related to weather and climate in remote areas in which certain of the Company’s operations are located; failure to achieve production, cost and other estimates; risks and uncertainties associated with exploration and development; uncertainties relating to estimates of mineral resources including uncertainty that mineral resources may never be converted into mineral reserves; the Company’s ability to carry on current and future operations, including development and exploration activities; the timing, extent, duration and economic viability of such operations, including any mineral resources or reserves identified thereby; the accuracy and reliability of estimates, projections, forecasts, studies and assessments; the Company’s ability to meet or achieve estimates, projections and forecasts; the availability and cost of inputs; the price and market for outputs, including gold, silver and copper; inability of the Company to identify appropriate acquisition targets or complete desirable acquisitions; failures of information systems or information security threats; political, economic and other risks associated with the Company’s foreign operations; geopolitical events and other uncertainties, such as the conflict in Ukraine; compliance with various laws and regulatory requirements to which the Company is subject to, including taxation; the ability to obtain timely financing on reasonable terms when required; the current and future social, economic and political conditions, including relationship with the communities in jurisdictions it operates; other assumptions and factors generally associated with the mining industry; and the risks, uncertainties and other factors referred to in the Company’s Annual Information Form under the heading “Risk Factors”.
Estimates of mineral resources are also forward-looking statements because they constitute projections, based on certain estimates and assumptions, regarding the amount of minerals that may be encountered in the future and/or the anticipated economics of production. The estimation of mineral resources and mineral reserves is inherently uncertain and involves subjective judgments about many relevant factors. Mineral resources that are not mineral reserves do not have demonstrated economic viability. The accuracy of any such estimates is a function of the quantity and quality of available data, and of the assumptions made and judgments used in engineering and geological interpretation, Forward-looking statements are not a guarantee of future performance, and actual results and future events could materially differ from those anticipated in such statements. Although we have attempted to identify important factors that could cause actual results to differ materially from those contained in the forward-looking statements, there may be other factors that cause actual results to differ materially from those that are anticipated, estimated, or intended. There can be no assurance that such statements will prove to be accurate, as actual results and future events could differ materially from those anticipated in such statements. Accordingly, readers should not place undue reliance on forward-looking statements. The Company disclaims any intention or obligation to update or revise any forward-looking statements, whether as a result of new information, future events or otherwise, except as required by law.
Photos accompanying this announcement are available at
https://www.globenewswire.com/NewsRoom/AttachmentNg/1d52c6d1-c4c4-4a77-85c8-76a1ea0d32c4
https://www.globenewswire.com/NewsRoom/AttachmentNg/f5a1bddd-958e-4df6-b113-11cda96fd6f9
https://www.globenewswire.com/NewsRoom/AttachmentNg/3132eec9-25a6-4651-8506-a7500652aaa7
https://www.globenewswire.com/NewsRoom/AttachmentNg/e5a2207a-e3be-4fbd-ace8-67b5bcfd2b38
https://www.globenewswire.com/NewsRoom/AttachmentNg/27524311-0084-45ad-a10d-ddd0d8563792
https://www.globenewswire.com/NewsRoom/AttachmentNg/0814f527-064d-425f-98ea-50b306f0a97f
https://www.globenewswire.com/NewsRoom/AttachmentNg/138237ae-5eb4-4c17-99c7-035d7efb13ed
https://www.globenewswire.com/NewsRoom/AttachmentNg/a184377c-a16f-4d79-ae3c-0ad781b17dff
https://www.globenewswire.com/NewsRoom/AttachmentNg/cc6d6275-6f94-4d11-b10a-f654cdf8a030
https://www.globenewswire.com/NewsRoom/AttachmentNg/a7ff1957-1e8b-4431-a3a7-70c44a808de6
