Ivanhoe Mines Issues 2024 Fourth Quarter and Annual Financial Results, Overview of Construction and Exploration Activities
Ivanhoe Mines reported strong financial results for 2024, with a $193M net profit and $386M normalized profit. The company achieved record $625M adjusted EBITDA, up from $604M in 2023. The Kamoa-Kakula Copper Complex delivered record production of 437,061 tonnes of copper in 2024, including 133,819 tonnes in Q4.
Key financial highlights include Kamoa-Kakula's record $3.11B revenue and $1.81B EBITDA in 2024. The operation maintained competitive costs with $1.71/lb Cost of Sales and $1.65/lb cash cost (C1). Africa's largest copper smelter construction is complete, expected to boost margins in H2 2025.
The Kipushi zinc-copper-silver mine achieved commercial production in Q4 2024, while the Platreef platinum-palladium-rhodium-nickel-gold-copper mine expects Phase 1 production in Q4 2025. The company announced Phase 2 & 3 expansion studies for Platreef.
Ivanhoe Mines ha riportato risultati finanziari solidi per il 2024, con un utile netto di 193 milioni di dollari e un utile normalizzato di 386 milioni di dollari. L'azienda ha raggiunto un record di 625 milioni di dollari di EBITDA rettificato, in aumento rispetto ai 604 milioni di dollari del 2023. Il Complesso di Rame Kamoa-Kakula ha conseguito una produzione record di 437.061 tonnellate di rame nel 2024, comprese 133.819 tonnellate nel quarto trimestre.
I principali punti salienti finanziari includono un fatturato record di 3,11 miliardi di dollari e un EBITDA di 1,81 miliardi di dollari per Kamoa-Kakula nel 2024. L'operazione ha mantenuto costi competitivi con un costo di vendita di 1,71 dollari/lb e un costo in contante (C1) di 1,65 dollari/lb. La costruzione della più grande fonderia di rame in Africa è completata, con aspettative di aumento dei margini nel secondo semestre del 2025.
La miniera di zinco-rame-argento Kipushi ha raggiunto la produzione commerciale nel quarto trimestre del 2024, mentre la miniera di platino-palladio-rodio-nichel-oro-rame Platreef prevede la produzione della Fase 1 nel quarto trimestre del 2025. L'azienda ha annunciato studi di espansione per le Fasi 2 e 3 di Platreef.
Ivanhoe Mines reportó resultados financieros sólidos para 2024, con un beneficio neto de 193 millones de dólares y un beneficio normalizado de 386 millones de dólares. La compañía logró un récord de 625 millones de dólares en EBITDA ajustado, un aumento con respecto a los 604 millones de dólares en 2023. El Complejo de Cobre Kamoa-Kakula entregó una producción récord de 437,061 toneladas de cobre en 2024, incluyendo 133,819 toneladas en el cuarto trimestre.
Los aspectos financieros clave incluyen un ingreso récord de 3.11 mil millones de dólares y un EBITDA de 1.81 mil millones de dólares en 2024 para Kamoa-Kakula. La operación mantuvo costos competitivos con un costo de ventas de 1.71 dólares/lb y un costo en efectivo (C1) de 1.65 dólares/lb. La construcción de la mayor fundición de cobre de África está completa, y se espera que aumente los márgenes en el segundo semestre de 2025.
La mina de zinc-cobre-plata Kipushi logró producción comercial en el cuarto trimestre de 2024, mientras que la mina de platino-paladino-rodio-níquel-oro-cobre Platreef espera iniciar la producción de la Fase 1 en el cuarto trimestre de 2025. La compañía anunció estudios de expansión para las Fases 2 y 3 de Platreef.
Ivanhoe Mines는 2024년 강력한 재무 실적을 보고했으며, 1억 9,300만 달러의 순이익과 3억 8,600만 달러의 정상화된 이익을 기록했습니다. 이 회사는 6억 2,500만 달러의 조정된 EBITDA로, 2023년의 6억 4백만 달러에서 증가했습니다. 카모아-카쿨라 구리 복합체는 2024년 437,061톤의 구리를 기록적인 생산량으로 제공했으며, 4분기에는 133,819톤을 포함했습니다.
주요 재무 하이라이트로는 카모아-카쿨라의 31억 1,000만 달러 수익과 18억 1,000만 달러 EBITDA가 있습니다. 이 운영은 판매 비용이 1.71달러/파운드, 현금 비용(C1)이 1.65달러/파운드로 경쟁력 있는 비용을 유지했습니다. 아프리카 최대의 구리 제련소 건설이 완료되어 2025년 하반기에 마진을 증가시킬 것으로 예상됩니다.
키푸시 아연-구리-은 광산은 2024년 4분기에 상업 생산을 달성했으며, 플라트리프 백금-팔라듐-로듐-니켈-금-구리 광산은 2025년 4분기에 1단계 생산을 예상하고 있습니다. 이 회사는 플라트리프에 대한 2단계 및 3단계 확장 연구를 발표했습니다.
Ivanhoe Mines a annoncé des résultats financiers solides pour 2024, avec un bénéfice net de 193 millions de dollars et un bénéfice normalisé de 386 millions de dollars. L'entreprise a atteint un record de 625 millions de dollars d'EBITDA ajusté, en hausse par rapport à 604 millions de dollars en 2023. Le complexe de cuivre Kamoa-Kakula a réalisé une production record de 437 061 tonnes de cuivre en 2024, dont 133 819 tonnes au quatrième trimestre.
Les points financiers clés incluent des revenus records de 3,11 milliards de dollars et un EBITDA de 1,81 milliard de dollars pour Kamoa-Kakula en 2024. L'opération a maintenu des coûts compétitifs avec un coût des ventes de 1,71 dollar/lb et un coût en espèces (C1) de 1,65 dollar/lb. La construction de la plus grande fonderie de cuivre d'Afrique est achevée, ce qui devrait augmenter les marges au second semestre 2025.
La mine de zinc-cuivre-argent Kipushi a atteint une production commerciale au quatrième trimestre 2024, tandis que la mine de platine-palladium-rhodium-nickel-or-cuivre Platreef s'attend à une production de la phase 1 au quatrième trimestre 2025. L'entreprise a annoncé des études d'expansion pour les phases 2 et 3 de Platreef.
Ivanhoe Mines berichtete von starken finanziellen Ergebnissen für 2024, mit einem Netto Gewinn von 193 Millionen Dollar und einem normalisierten Gewinn von 386 Millionen Dollar. Das Unternehmen erzielte ein Rekord-EBITDA von 625 Millionen Dollar, ein Anstieg von 604 Millionen Dollar im Jahr 2023. Der Kamoa-Kakula Kupferkomplex lieferte eine Rekordproduktion von 437.061 Tonnen Kupfer im Jahr 2024, einschließlich 133.819 Tonnen im 4. Quartal.
Wichtige finanzielle Höhepunkte sind die Rekord-Einnahmen von 3,11 Milliarden Dollar und EBITDA von 1,81 Milliarden Dollar für Kamoa-Kakula im Jahr 2024. Der Betrieb hielt wettbewerbsfähige Kosten mit 1,71 Dollar/lb Verkaufs- und 1,65 Dollar/lb Barausgaben (C1). Der Bau der größten Kupferhütte Afrikas ist abgeschlossen und wird voraussichtlich die Margen in der zweiten Hälfte von 2025 erhöhen.
Die Kipushi Zink-Kupfer-Silbermine erreichte im 4. Quartal 2024 die kommerzielle Produktion, während die Platreef Platin-Palladium-Rhodium-Nickel-Gold-Kupfermine die Produktionsphase 1 im 4. Quartal 2025 erwartet. Das Unternehmen kündigte Erweiterungsstudien für die Phasen 2 und 3 von Platreef an.
- Record copper production of 437,061 tonnes in 2024, up 11% YoY
- Kamoa-Kakula achieved record $3.11B revenue and $1.81B EBITDA
- Completion of Africa's largest copper smelter
- Kipushi mine achieved commercial production in Q4 2024
- $625M adjusted EBITDA, up from $604M in 2023
- Increased cash costs due to higher power expenses and lower-grade ore processing
- Higher 2025 cash cost guidance of $1.65-1.85/lb vs 2024
- Smelter ramp-up delayed by up to three months due to power availability
- 30,000 tonnes of unsold copper inventory at year-end
Ivanhoe Mines posts
Ivanhoe Mines reports record
Kamoa-Kakula delivers record copper production of 437,061 tonnes in 2024, including 133,819 tonnes in Q4
Kamoa-Kakula achieves record
Kamoa-Kakula maintains competitive cost structure:
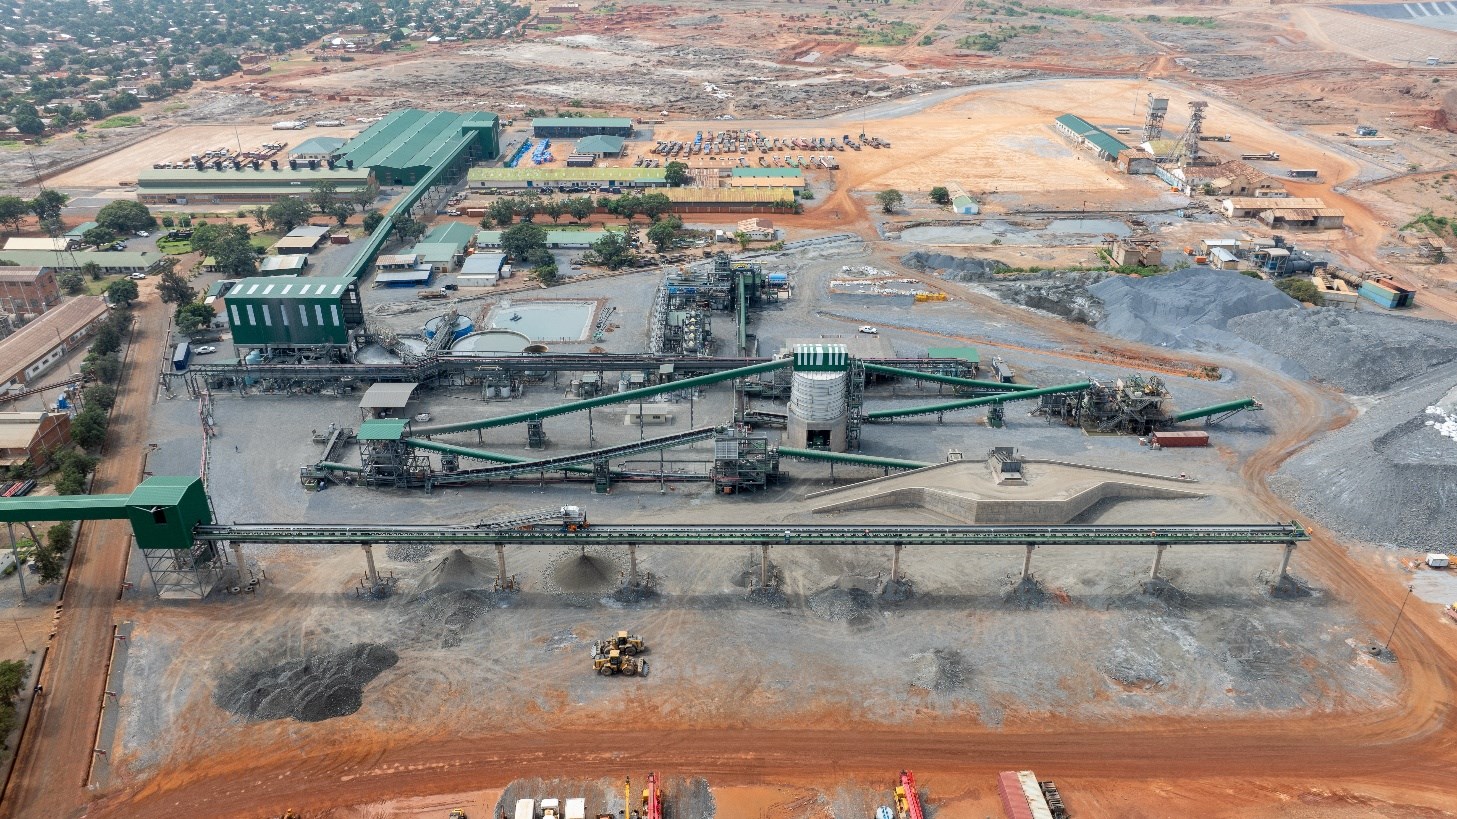
Africa's largest and greenest copper smelter construction complete, set to boost margins in H2 2025
Kipushi zinc-copper-silver mine achieved commercial production in Q4 2024; advancing to nameplate milling rate in Q1 2025
Ivanhoe announces Phase 2 & 3 expansion studies for Platreef platinum-palladium-rhodium-nickel-gold-copper mine; Phase 1 production expected in Q4 2025
Exploration update set for February 24, 2025, at BMO Global Metals & Mining Conference
Johannesburg, South Africa--(Newsfile Corp. - February 19, 2025) - Ivanhoe Mines' (TSX: IVN) (OTCQX: IVPAF) President Marna Cloete and Chief Financial Officer David van Heerden are pleased to present today the company's financial results for the fourth quarter and year ended December 31, 2024, and provide an operations and project development update.
Ivanhoe Mines is a leading Canadian mining company developing and operating its four principal mining and exploration projects in Southern Africa: expanding production at the world-class Kamoa-Kakula Copper Complex in the Democratic Republic of the Congo (DRC); ramping up the ultra-high-grade Kipushi zinc-copper-lead-germanium mine in the DRC; building the tier-one Platreef platinum, palladium, rhodium, nickel, gold, and copper mine in South Africa; as well as and advancing exploring for new copper discoveries across the expansive exploration licenses of Ivanhoe’s Western Forelands Exploration Project, which hosts the Makoko, Kitoko, and Kiala copper discoveries near Kamoa-Kakula. All figures are in U.S. dollars unless otherwise stated.
Watch a February 2025 video highlighting Ivanhoe Mines' financial results, as well as construction and exploration activities: https://vimeo.com/1057866017/026367c9cd?share=copy 
To view an enhanced version of this graphic, please visit:
https://images.newsfilecorp.com/files/3396/241566_d2e17de8b41aa889_002full.jpg
Founder and Co-Chairman Robert Friedland commented:
"In 2024, Ivanhoe Mines achieved remarkable milestones, solidifying our position as a global leader in the copper mining sector and reinforcing our commitment to sustainable development and production growth. The extraordinary performance at Kamoa-Kakula, highlighted by record-breaking copper production levels and industry-leading operational efficiency, reflects our dedication to innovation and excellence in every aspect of our operations. The completion of Africa's largest and greenest copper smelter marks a pivotal moment, unlocking new potential for enhanced profitability, reduced costs, and streamlined efficiencies.
"Beyond our achievements at Kamoa-Kakula, the steady progress on the Phase 2 and Phase 3 development plans at the Platreef Project further underscores Ivanhoe Mines' unwavering commitment to long-term value creation. Platreef stands as a world-class operation poised to produce a diversified suite of critical metals vital to the global energy transition, advancing our goal of driving sustainable production growth. These advancements align with our ambition to become a pre-eminent supplier of responsibly sourced metals while creating lasting economic benefits for the communities in which we operate.
"With peak capital expenditures now behind us at Kamoa-Kakula, Ivanhoe Mines is entering an era of exceptional free cash flow generation. Our disciplined approach to capital allocation will enable us to expand exploration programs across our high-potential, diversified portfolio and pursue strategic opportunities that align with our core values. The success we have achieved to date is reflective of the dedication, resilience, and expertise of our global team. It is their contributions that empower us to rise above challenges and deliver consistent value to our shareholders and stakeholders alike. Our vision for the future is clear-to responsibly grow, innovate, and lead in the critical metals sector as we continue to build a legacy of excellence."
FINANCIAL HIGHLIGHTS
- Ivanhoe Mines recorded a profit of
$193 million in 2024, equivalent to a basic profit of$0.17 per share, and normalized profit of$386 million , equivalent to$0.32 per share. This compares with profit of$303 million in 2023, equivalent to$0.26 per share, and normalized profit of$388 million , equivalent to$0.33 per share. The normalized profit in 2024 excludes a$164 million loss on fair value on the convertible notes following the40% appreciation in the share price from C$12.85 on December 31, 2023, to a weighted average of C$17.95 during the redemption period as well as$28 million in finance costs associated with the early redemption of the notes.
- Ivanhoe's profit for the year includes Ivanhoe Mines' share of profit and finance income from the Kamoa-Kakula joint venture of
$516 million for 2024, up from$482 million in 2023.
- Ivanhoe Mines' record adjusted EBITDA was
$625 million in 2024, up from$604 million in 2023, which includes an attributable share of EBITDA from Kamoa-Kakula of$712 million .
- Kamoa-Kakula recognized record revenue of
$3.11 billion , operating profit of$1.43 billion , and EBITDA of$1.81 billion for 2024, equivalent to a margin of58% .
- Kamoa-Kakula recognized EBITDA of
$432 million for the fourth quarter of 2024, compared with$470 million in the third quarter, in part impacted by a negative remeasurement of contract receivables of$52 million due to a fall in the copper price from$4.41 /lb. at the beginning of the quarter to$4.01 /lb. at the end of the quarter.
- Kamoa-Kakula sold 396,972 tonnes of copper (net of payability) in 2024 at an average realized copper price of
$4.09 /lb., compared with 375,779 tonnes in 2023 at an average realized copper price of$3.84 /lb. Concentrate produced from Phase 3 is being toll-treated into blister copper at the Lualaba Copper Smelter (LCS) to maximize profitability until the on-site smelter is completed. At year-end, there were approximately 30,000 tonnes of unsold copper in inventory, up from approximately 16,000 tonnes of unsold copper in concentrate at the end of the third quarter. The unsold copper in inventory is expected to be sold during the first and second quarter.
- Kamoa-Kakula's cost of sales per pound (lb.) of payable copper sold was
$1.71 /lb. for 2024 compared with$1.33 /lb. in 2023. Cash cost (C1) per pound of payable copper produced in 2024 totaled$1.65 /lb., compared with$1.45 /lb. in 2023, and within the guidance range of$1.50 /lb. to$1.70 /lb. for a fourth consecutive year.
- The year-on-year increase in cash costs was due to an increased use of imported power and on-site back-up power to make up for shortfalls in available DRC grid power, and; the processing of lower-grade surface stockpiles and run-of-mine ore during the commissioning of the Phase 3 concentrator in H2 2024.
- Ivanhoe Mines announces Kamoa-Kakula's full-year cash cost (C1) guidance for 2025 of
$1.65 /lb. to$1.85 /lb. of payable copper produced. Cash cost (C1) per pound of payable copper produced for the fourth quarter of 2024 amounted to$1.75 /lb. - The increase in cash cost guidance in 2025, relative to 2024, is in part due to the expectation that Kamoa-Kakula will continue to use imported and back-up power sources, particularly until Turbine #5 at Inga II is commissioned in the second half of 2025. In addition, that the savings associated with the on-site copper smelter are not expected to be realized until ramp up is well underway later in the year.
- Since entering Phase 1 commercial production on July 1, 2021, the Kamoa-Kakula joint venture has generated
$5.5 billion of EBITDA and$4.7 billion of operating cash flow, excluding working capital movements, which has largely been re-invested in the now-complete Phase 2 and 3 expansions and the direct-to-blister copper smelter, as well as optimization initiatives.
- Kipushi achieved commercial production during Q4 2024 and sold 16,999 tonnes of zinc (net of payability) during the quarter, which was significantly affected by ramp-up, recognizing revenue of
$41 million at a cost of sales of$52 million and EBITDA of$4 million . Kipushi's cost of sales per pound (lb.) of payable zinc sold was$1.38 /lb. and cash cost (C1) per pound of payable zinc sold totaled$1.13 /lb.
- Ivanhoe Mines announces Kipushi's full-year cash cost (C1) guidance for 2025 of
$0.90 /lb. to$1.00 /lb. of payable zinc. Cash costs are expected to steadily improve over the course of 2025.
- Ivanhoe Mines continued its excellent record of project execution in 2024, with capital expenditure, excluding sustaining capital, of
$1.62 billion at Kamoa-Kakula on the now-complete Phase 3 expansion and smelter,$267 million at Platreef on advancing Phase 1 and 2, and$185 million completing the Kipushi mine re-start, all being within capex guidance.
- During the fourth quarter of 2024, Ivanplats drew
$70 million of a$150 million senior debt facility for the Platreef Phase 1 mine; Ivanhoe Mines' marketing subsidiary entered into a$75 million revolving credit facility and drew$40 million ; and Kipushi entered into a$50 million revolving credit facility and drew$26 million .
- On January 24, 2025, Ivanhoe Mines closed the inaugural offering of an aggregate principal amount of
$750 million senior unsecured notes due 2030, bearing a coupon rate of 7⅞%.
- Ivanhoe Mines' cash and cash equivalents on hand as at December 31, 2024, was
$117 million , which excludes the net proceeds from the subsequent$750 million notes issue.
OPERATIONAL HIGHLIGHTS
- The Kamoa-Kakula Copper Complex produced 437,061 tonnes of copper in concentrate in 2024, a year-over-year increase of
11% compared with 393,551 tonnes in 2023 following the ramp-up of the Phase 3 concentrator in the second half of 2024.
- Kamoa-Kakula achieved record quarterly production of 133,819 tonnes of copper in concentrate in the fourth quarter of 2024, compared with 100,812 tonnes in Q2 2024 and 116,313 tonnes in Q3 2024. This included record monthly production in December of 47,058 tonnes of copper in concentrate.
- Kamoa-Kakula's Phase 1 and 2 milled 8.9 million tonnes of ore during 2024 at an average grade of
4.95% and Phase 3 milled 2.3 million tonnes of ore at an average grade of2.70% since first ore was fed on May 26, 2024. The three concentrators combined achieved a milling record of approximately 3.7 million tonnes of ore during the fourth quarter, as Phase 3 reached and at times exceeded nameplate capacity.
- Kamoa-Kakula's 2025 production guidance has been set at 520,000 to 580,000 tonnes of copper in concentrate. Kamoa-Kakula is targeting a production rate of approximately 600,000 tonnes of copper in concentrate for 2026, following the completion of power initiatives currently underway, together with optimization projects for improved Phase 1 and 2 recoveries ("Project 95") and increased Phase 3 throughput underway.
- Construction of Kamoa-Kakula's 500,000-tonne-per-annum on-site, direct-to-blister copper smelter, the largest in Africa, is now complete. The ramp-up of the smelter complex has been deferred by up to three months due to power availability and is expected to commence in Q2 2025 and will drive improvement in margins.
- The refurbishment of Turbine #5 at Inga II is expected to be completed in H2 2025. Wet commissioning has been delayed and is expected during the second half of 2025. Simultaneously, Kamoa-Kakula is expected to receive an initial 70 MW of grid-supplied hydropower, increasing to the Turbine #5 nameplate capacity of 178 MW as the ongoing grid improvement initiatives are completed over the remainder of the year.
- The "Project 95" initiative on Kamoa-Kakula's Phase 1 and 2 concentrators is advancing towards completion in Q1 2026. The increase in concentrator recoveries to
95% is expected to increase annualized copper production by up to 30,000 tonnes, with an industry-leading capital intensity of$6,000 per tonne of copper.
- The ongoing ramp-up of the ultra-high-grade Kipushi zinc mine continued during the fourth quarter, following first ore feed on May 31, 2024. The nameplate milling rate is expected to be achieved later in the first quarter of 2025.
- Kipushi produced 50,307 tonnes of zinc during its inaugural year. A monthly record of 14,900 tonnes of zinc was achieved in December.
- The Kipushi debottlenecking program is advancing on schedule for completion early in the fourth quarter. The debottlenecking program is targeting a
20% increase in the Kipushi concentrator's processing capacity, up to 960,000 tonnes of ore per annum. Engineering and the procurement of long-lead order equipment items are well underway.
- Kipushi's 2025 production guidance has been set at 180,000 to 240,000 tonnes of zinc in concentrate based on the ramp-up schedule. Kipushi is targeting a production rate of over 250,000 tonnes of zinc in concentrate for 2026, following the completion of ramp-up and debottlenecking activities.
- Ivanhoe Mines announced on February 18, 2025, two independent studies on the Phase 2 and Phase 3 expansion of the Platreef platinum-palladium-rhodium-nickel-gold-copper mine, outlining plans for Platreef to become one of the world's largest and lowest-cost platinum group metal producers, with significant nickel and copper by-products.
- Platreef's first production is expected from the completed Phase 1 concentrator in Q4 2025. The Phase 2 expansion is accelerated to Q4 2027, increasing production to over 450 koz of platinum, palladium, rhodium, and gold per annum, as well as significant nickel and copper byproducts.
- Platreef's Phase 3 expansion is expected to produce over 1.0 million ounces of platinum, palladium, rhodium, and gold per annum, plus approx. 25,000 tonnes of nickel and 15,000 tonnes of copper.
- Reaming of the 5.1-meter diameter Shaft #3 from the 950-meter level was completed in Q4 2024 and equipping has commenced. Shaft #3 is expected to commence hoisting from Q1 2026 with a capacity of approximately 4 million tonnes per annum.
- Ivanhoe continues exploration across its vast Western Forelands licenses, adjacent to Kamoa-Kakula. Diamond drilling during the fourth quarter of 2024 focused on wide-spaced, step-out drilling to define the extent of copper mineralization at the Makoko, Makoko West, and Kitoko discoveries. Drilling during the fourth quarter was conducted using eight contractor rigs and produced a total of 18,703 metres of core in 38 holes. A total of 81,734 metres were drilled in 2024 in 126 holes, exceeding the planned diamond drilling by more than 11,500 metres.
- Ivanhoe Mines announced on February 12, 2025, that it has formed a joint venture to explore the Chu-Sarysu Basin in Kazakhstan, the world's third-largest sedimentary copper basin. The joint venture is targeted a licence package of 16,000 km2, the largest in the basin, with
$18.7 million committed to exploration activities over the first two years.

Construction of Africa's largest and greenest smelter project at Kamoa-Kakula is now complete. Smelting of Kamoa's concentrate is expected to drive a material improvement in margins.
To view an enhanced version of this graphic, please visit:
https://images.newsfilecorp.com/files/3396/241566_d2e17de8b41aa889_003full.jpg
Conference call for investors on Thursday, February 20, 2025
Ivanhoe Mines will hold an investor conference call to discuss the results at 10:30 a.m. Eastern time / 7:30 a.m. Pacific time on February 20, 2025. The conference call will conclude with a question-and-answer (Q&A) session. Media are invited to attend on a listen-only basis.
To view the webcast, use the link: https://meetings.lumiconnect.com/400-631-436-236
Audience Phone Number:
Local - Toronto (+1) 289 514 5005
Toll Free - North America (+1) 800 206 4400
An audio webcast recording of the conference call, together with supporting presentation slides, will be available on Ivanhoe Mines' website at www.ivanhoemines.com.
After issuance, the condensed consolidated interim financial statements and Management's Discussion and Analysis will be available at www.ivanhoemines.com and www.sedarplus.ca.
Read Ivanhoe's Fourth Quarter 2024 Sustainability Review:
For 2024, the group achieved an industry-leading combined Lost Time Injury Frequency Rate (LTIFR) of 0.33 and a Total Recordable Injury Frequency Rate (TRIFR) of 0.9 per 1,000,000 hours worked. For the fourth quarter, the group achieved an impressive LTIFR of 0.14 and a TRIFR of 0.62 per 1,000,000 hours worked.
For more information on each project's health and safety performance, as well as more information on the various sustainability initiatives underway across the group, read Ivanhoe's Q4 2024 Sustainability Review. In addition, the group's 2024 Sustainability Report will be release in the second quarter: https://www.ivanhoemines.com/investors/document-library/#sustainability

To view an enhanced version of this graphic, please visit:
https://images.newsfilecorp.com/files/3396/241566_d2e17de8b41aa889_004full.jpg

Anita Kaulo, Water Treatment Plant Operator, at the Kakula North water supply facility.
To view an enhanced version of this graphic, please visit:
https://images.newsfilecorp.com/files/3396/241566_d2e17de8b41aa889_005full.jpg
Principal projects and review of activities
1. Kamoa-Kakula Copper Complex
Democratic Republic of Congo
The Kamoa-Kakula Copper Complex is operated as the Kamoa Holding joint venture between Ivanhoe Mines and Zijin Mining. The project is approximately 25 kilometres southwest of the town of Kolwezi and about 270 kilometres west of Lubumbashi. Kamoa-Kakula's Phase 1 concentrator began producing copper in May 2021. The Phase 2 concentrator, completed in April 2022, doubled nameplate production capacity to 400,000 tonnes of copper per annum. A debottlenecking program, completed 10 months later in February 2023, further increased copper production capacity to 450,000 tonnes per annum. The Phase 3 concentrator completed in June 2024 expands annual production capacity up to approximately 600,000 tonnes of copper, ranking the Kamoa-Kakula Copper Complex as the world's third-largest copper mining operation by international mining consultant Wood Mackenzie.
Ivanhoe sold a
Kamoa-Kakula summary of operating and financial data
| FY 2024 | Q4 2024 | Q3 2024 | Q2 2024 | Q1 2024 | |||||||||
| Ore tonnes milled (000's tonnes) | 11,363 | 3,655 | 3,266 | 2,381 | 2,061 | ||||||||
| Copper ore grade processed (%) | |||||||||||||
| Copper recovery (%) | |||||||||||||
| Copper in concentrate produced (tonnes) | 437,061 | 133,819 | 116,313 | 100,812 | 86,117 | ||||||||
| Payable copper sold (tonnes)(1) | 396,972 | 112,811 | 103,106 | 95,900 | 85,155 | ||||||||
| Cost of sales per pound ($ per lb.) | 1.71 | 1.94 | 1.80 | 1.53 | 1.50 | ||||||||
| Cash cost (C1) ($ per lb.) | 1.65 | 1.75 | 1.69 | 1.52 | 1.57 | ||||||||
| Realized copper price ($ per lb.) | 4.09 | 4.08 | 4.16 | 4.34 | 3.82 | ||||||||
| Sales revenue before remeasurement ($'000) | 3,158,942 | 895,758 | 836,871 | 813,817 | 612,496 | ||||||||
| Remeasurement of contract receivables ($'000) | (52,331) | (52,428 | ) | (8,983 | ) | 3,256 | 5,824 | ||||||
| Sales revenue after remeasurement ($'000) | 3,106,611 | 843,330 | 827,888 | 817,073 | 618,320 | ||||||||
| EBITDA ($'000) | 1,813,687 | 431,802 | 469,735 | 547,257 | 364,893 | ||||||||
| EBITDA margin (% of sales revenue) |
All figures in the above tables are on a
(1) Payable copper sold is net of the payability factor of circa
C1 cash cost per pound of payable copper produced can be further broken down as follows:
| FY 2024 | Q4 2024 | Q3 2024 | Q2 2024 | Q1 2024 | ||||||||||||
| Mining | ($ per lb.) | 0.54 | 0.61 | 0.62 | 0.45 | 0.44 | ||||||||||
| Processing | ($ per lb.) | 0.26 | 0.30 | 0.26 | 0.21 | 0.23 | ||||||||||
| Logistics charges | ($ per lb.) | 0.44 | 0.40 | 0.42 | 0.48 | 0.50 | ||||||||||
| TC, RC, smelter charges | ($ per lb.) | 0.26 | 0.27 | 0.26 | 0.25 | 0.25 | ||||||||||
| General & administrative | ($ per lb.) | 0.15 | 0.17 | 0.13 | 0.13 | 0.15 | ||||||||||
| Cash cost (C1) per pound of payable copper produced | ($ per lb.) | 1.65 | 1.75 | 1.69 | 1.52 | 1.57 |
The cost of power, which is allocated between mining and processing in the above cash cost split, can be split out as follows:
| FY 2024 | Q4 2024 | Q3 2024 | Q2 2024 | Q1 2024 | ||||||||||
| Power costs included in Mining and Processing cost | ($ per lb.) | 0.17 | 0.22 | 0.19 | 0.12 | 0.14 | ||||||||
| Power costs as a proportion of cash cost (C1) per pound of payable copper produced | (%) |
Cash cost (C1) is prepared on a basis consistent with the industry standard definitions by Wood Mackenzie cost guidelines but are not measures recognized under IFRS Accounting Standards. In calculating the C1 cash cost, the costs are measured on the same basis as the Company's share of profit from the Kamoa Holding joint venture that is contained in the financial statements. C1 cash cost is used by management to evaluate operating performance and include all direct mining, processing, and general and administrative costs. Smelter charges and freight deductions on sales to the final port of destination, which are recognized as a component of sales revenues, are added to C1 cash cost to arrive at an approximate cost of delivered, finished metal. C1 cash cost excludes royalties, production taxes, and non-routine charges as they are not direct production costs.
All figures are on a
Kamoa-Kakula's Phase 1, 2, and 3 concentrators produced a record 133,819 tonnes of copper in Q4 2024 and an annual record of 437,061 tonnes of copper in 2024
Kamoa-Kakula produced a record 437,061 tonnes of copper in concentrate in 2024, a
Record copper concentrate production in the fourth quarter was achieved following a strong performance from the Phase 1 and 2 concentrators, which delivered record throughput with improved grade and recovery; as well as the Phase 3 concentrator reaching, and at times exceeding, nameplate design parameters.
The Phase 3 concentrator milled at an annualized rate of 5.7 million tonnes per annum (Mtpa) during the month, representing a
Kamoa-Kakula summary of quarterly and annual production data:
| FY 2024 | Q4 2024 | Q3 2024 | Q2 2024 | Q1 2024 | |||||||||||||||
| Phase 1 & 2 | |||||||||||||||||||
| Ore tonnes milled (000's tonnes) | 8,893 | 2,329 | 2,215 | 2,288 | 2,061 | ||||||||||||||
| Copper ore grade processed (%) | |||||||||||||||||||
| Copper recovery (%) | |||||||||||||||||||
| Copper in concentrate produced (tonnes) | 382,079 | 102,042 | 94,214 | 99,706 | 86,117 | ||||||||||||||
| Phase 3 | |||||||||||||||||||
| Ore tonnes milled (000's tonnes) | 2,469 | 1,326 | 1,050 | 93 | - | ||||||||||||||
| Copper ore grade processed (%) | - | ||||||||||||||||||
| Copper recovery (%) | - | ||||||||||||||||||
| Copper in concentrate produced (tonnes) | 54,982 | 31,777 | 22,099 | 1,106 | - | ||||||||||||||
| Combined Phase 1, 2 and 3 | |||||||||||||||||||
| Ore tonnes milled (000's tonnes) | 11,363 | 3,655 | 3,266 | 2,381 | 2,061 | ||||||||||||||
| Copper ore grade processed (%) | |||||||||||||||||||
| Copper recovery (%) | |||||||||||||||||||
| Copper in concentrate produced (tonnes) | 437,061 | 133,819 | 116,313 | 100,812 | 86,117 | ||||||||||||||
The bolded numbers denote a quarterly record.
The 2024 production of 437,061 tonnes was within Kamoa-Kakula's revised production guidance of between 425,000 and 450,000 tonnes of copper in concentrate.
Kamoa-Kakula's high- and medium-grade ore surface stockpiles totaled approximately 4.19 million tonnes at an estimated, blended average grade of
At year-end, there were approximately 30,000 tonnes of unsold copper in inventory, up from approximately 16,000 tonnes of unsold copper in concentrate at the end of the third quarter. The inventory of unsold copper is largely undergoing toll treatment at the Lualaba Copper Smelter (LCS).
Kamoa Copper continues to work closely with the DRC's state-owned power company, La Société Nationale d'Electricité (SNEL), to deliver solutions for the identified causes of instability experienced across the southern DRC's grid infrastructure since late 2022. The project work, which is budgeted up to
The project work consists of grid infrastructure upgrades, such as an increase in grid capacity between the Inga II hydroelectric facility and Kolwezi, a new harmonic filter at the Inga Converter Station, as well as a new static compensator at the Kolwezi Converter Substation. In addition, various smaller initiatives have been identified to strengthen the transmission capability and improve the long-term stability of the southern grid. This includes the restringing of powerlines in the southern grid and repairs to the direct current (DC) infrastructure. In addition to this, Ivanhoe Mines Energy DRC SARL is working with SNEL to put in place maintenance contracts to maintain key generation capacity and transmission infrastructure.
Wet commissioning of Turbine #5 at Inga II deferred until Q3 2025
In December, the new turbine runner was lowered into place and installed inside Turbine #5 at Inga II. Wet commissioning of Turbine #5 is delayed and expected to commence in the second half of 2025. Kamoa-Kakula is expected to be allocated an initial, additional 70 megawatts (MW) of hydropower from the grid in the second half of 2025, which will increase over time to 178 MW by Q1 2026 as grid improvement initiatives are completed.

The ramp-up of the Phase 3 concentrator to steady-state was completed early in Q4; the concentrate filtration and storage building is pictured in the foreground.
To view an enhanced version of this graphic, please visit:
https://images.newsfilecorp.com/files/3396/241566_d2e17de8b41aa889_006full.jpg

Khuthado Mpandeli, Instrument Technician with T3 Projects, standing at the Phase 3 backfill plant.
To view an enhanced version of this graphic, please visit:
https://images.newsfilecorp.com/files/3396/241566_d2e17de8b41aa889_007full.jpg
Ramp-up of the Phase 3 concentrator to steady-state completed early in Q4; commissioning of underground infrastructure in the Kamoa 1 mine to improve mining costs
First ore to Kamoa-Kakula's Phase 3 concentrator was achieved on May 26, 2024, approximately two quarters ahead of the originally announced schedule, with first concentrate reported on June 10, 2024. The new 5-million-tonne-per-annum (Mtpa) Phase 3 concentrator is located adjacent to the Kamoa 1 and 2 underground mines, approximately 10 kilometres north of the Phase 1 and 2 concentrators located above the Kakula underground mine. Ramp-up to steady-state production of the Phase 3 concentrator was completed early in the fourth quarter.
The Phase 3 concentrator is
Construction progress of underground mining infrastructure at the Kamoa 1, Kamoa 2, and Kansoko mines continued on schedule with successful early commission of the first leg of the conveying system from the underground truck tip to surface run-of-mine stockpile, allowing for improved mining efficiencies. Construction focus has moved to the second conveyor leg system where early commissioning is planned. Additional upcast ventilation fan stations at Kamoa 1 and Kansoko were commissioned ahead of schedule during the period allowing for vastly improved underground working conditions due to the build-up of the mining fleet. The main Kamoa 1 pump station construction has been completed with final commissioning imminent to further improve underground water management.
Concurrently, underground development at Kamoa 1 and 2 continues to focus on opening up access to ore reserves well in advance of the mine plan providing the mine with flexibility to achieve a consistent head grade from the higher- and lower-grade mining areas.

Box cut and portal for the Phase 3 Kamoa 1 mine, where commissioning of underground infrastructure is expected to improve mining costs.
To view an enhanced version of this graphic, please visit:
https://images.newsfilecorp.com/files/3396/241566_d2e17de8b41aa889_008full.jpg
Direct-to-blister copper smelter construction project now complete
Construction of Africa's largest smelter at Kamoa-Kakula, which will have a capacity of 500,000 tonnes of >
The commencement of furnace heat-up has been deferred by up to three months due to power availability and is expected to commence in Q2 2025.
On-boarding of the 982-personnel operating team is nearly complete. These recruits have undergone extensive training at other smelter sites in Zambia and China and on-the-job training at the Kamoa smelter is now well underway.
The smelter will have a processing capacity of approximately 1.2 Mtpa of dry concentrate feed and is designed to run on a blend of concentrate produced from the Kakula (Phase 1 and 2) and Kamoa (Phase 3 and future Phase 4) concentrators. Where possible, Kamoa-Kakula will continue to toll treat concentrates domestically with surplus concentrates smelted at LCS.
Between 20,000 and 30,000 tonnes of copper in concentrate from the Phase 3 concentrator will be stockpiled on-site in anticipation of the heat-up and ramp-up smelter. Once fully ramped up, the smelter is expected to maintain approximately 17,000 tonnes of copper within the circuit.
The smelter will also produce a by-product of 600,000 to 700,000 tonnes per year of high-strength sulphuric acid, depending on the sulphur content of the feed concentrate. There is a strong demand for sulphuric acid in the DRC, as it is used to leach copper from oxide ores through the SX-EW (solvent extraction and electrowinning) process. Offtake agreements for the high-strength sulphuric acid produced have been concluded with other mines in the Kolwezi area.
The on-site smelter will offer transformative financial benefits for the Kamoa-Kakula Copper Complex, most significantly a material reduction in logistics costs, and to a lesser extent reduced concentrate treatment charges and local taxes, as well as revenue from acid sales. Logistics costs accounted for approximately
Kamoa-Kakula signs offtake agreement and advanced payment facility for copper anodes produced by the on-site smelter
CITIC Metal (HK) Limited and Gold Mountains International Mining Company Limited, a subsidiary of Zijin Mining, have each signed an offtake agreement with Kamoa Copper for a combined
CITIC Metal and Gold Mountains will purchase the copper anodes on a free-carrier (FCA) basis from Kamoa-Kakula's mine gate. CITIC has elected to use Ivanhoe's trading subsidiary to arrange the inland transportation of copper anodes to the port of loading in Africa.
In addition, under the offtake agreements, CITIC Metal and Gold Mountains have provided an advance payment facility of
Kamoa Copper is also in advanced discussions to sign a third offtake agreement for the remaining

Kamoa-Kakula's on-site copper smelter construction was completed in Q1 2025.
To view an enhanced version of this graphic, please visit:
https://images.newsfilecorp.com/files/3396/241566_d2e17de8b41aa889_009full.jpg

Joelle Mpanga, Laboratory Analyst with MD Services, working at the Kamoa-Kakula smelter laboratory.
To view an enhanced version of this graphic, please visit:
https://images.newsfilecorp.com/files/3396/241566_d2e17de8b41aa889_010full.jpg
Project 95 to unlock up to 30,000 tonnes per annum of additional copper growth from Phase 1 and 2 concentrators from 2026
Project 95 aims to improve copper recovery rates of the Phase 1 and 2 concentrators from
The modifications to the existing Phase 1 and 2 concentrators consist of a new coarse-fine cyclone bank, flash flotation cells, coarse rougher tailings tank, additional feed tanks to the rougher scavenger and cleaner scavenger flotation cells, and new cleaner flotation cells. In addition, a new fine-regrind milling plant adjacent to the Phase 1 and Phase 2 concentrator plants will be constructed, with high-intensity grinding (HIG) mills, rougher tailings cyclones, and slime thickeners.

Infrastructure site plan of Phase 1 and 2 concentrators, showing new Project 95 equipment to be installed in red.
To view an enhanced version of this graphic, please visit:
https://images.newsfilecorp.com/files/3396/241566_d2e17de8b41aa889_011full.jpg
Following the completion of Project 95, the copper grade of the tailings stream from the Phase 1 and 2 concentrators will be significantly reduced from approximately
The estimated capital cost for the modifications to the Phase 1 and 2 concentrator plants is approximately
During the fourth quarter, DRA Global of Johannesburg, South Africa, and Zijin Engineering of Fujian Province, China were appointed as engineering, procurement, and construction management (EPCM) contractors to execute Project 95.
The construction of Project 95 is expected to take approximately 18 months with completion targeted during the first quarter of 2026.
Kamoa-Kakula 2025 Integrated Development Plan, including future growth initiatives such as Project 95, Phase 3 debottlenecking, and Phase 4 expansion, expected in Q2 2025
Following the last Integrated Development Plan, released on January 30, 2023, Kamoa's engineering team is working on an updated 2025 Integrated Development Plan (2025 IDP) which is expected to be complete in Q2 2025. The 2025 IDP will include initiatives targeting increased processing recoveries and processing throughput from the Phase 1, 2, and 3 concentrators, as well as a new Phase 4 expansion.
Kamoa's engineering team is targeting to increase recovery rates of the Phase 1 and 2 concentrators and the Phase 3 concentrator, from the current nameplate rates of
The Phase 4 expansion involves doubling the size of the milling and flotation circuit adjacent to Phase 3. Like the Phase 2 expansion with Phase 1, the front-end crushing circuit installed for Phase 3 has already been oversized to accommodate Phase 4.
Phase 4 will be fed by ramping up new mining areas on the Kamoa-Kakula Copper Complex, the timing of which is under study for the 2025 IDP.
COPPER PRODUCTION AND CASH COST GUIDANCE FOR 2025
| Kamoa-Kakula 2025 Guidance | ||||
| Contained copper in concentrate (tonnes) | 520,000 - 580,000 | |||
| Cash cost (C1) ($ per pound of payable copper produced) | 1.65 to 1.85 |
Guidance figures are on a
Kamoa-Kakula is targeting a production rate of approximately 600,000 tonnes of copper in concentrate for 2026, following power initiatives in progress, together with optimization projects for improved Phase 1 and 2 recoveries ("Project 95") and increased Phase 3 throughput underway.
The Kamoa-Kakula joint venture produced a total of 133,819 tonnes of copper in concentrate for the fourth quarter of 2024, and 437,061 tonnes of copper for the year.
Cash cost (C1) per pound of payable copper produced amounted to
Cash cost (C1) guidance is based on assumptions including feed grades of processed copper ore, the ramp-up of the Phase 3 concentrator, reliability of DRC grid power supply, the availability and cost of alternative sources of electricity supply, and prevailing logistics rates among other variables.
In recent months, imported power available to Kamoa-Kakula has been reduced due to drought conditions affecting hydroelectric capacity in Zambia and Mozambique. Although the rainy season has begun, it is too early to predict the degree to which reservoirs that provide hydropower in Zambia and Mozambique will be recharged. Given this uncertainty, 2025 production and cost guidance will be reviewed at the end of the rainy season in the second quarter.
Cash cost (C1) is a non-GAAP measure used by management to evaluate operating performance and includes all direct mining, processing, stockpile rehandling charges, and general and administrative costs. Smelter charges and freight deductions on sales to the final port of destination (typically China), which are recognized as a component of sales revenues, are added to cash cost (C1) to arrive at an approximate cost of delivered finished metal.
For historical comparatives, see the non-GAAP Financial Performance Measures section of this press release.

Inside Kamoa-Kakula's smelter concentrate blender building.
To view an enhanced version of this graphic, please visit:
https://images.newsfilecorp.com/files/3396/241566_d2e17de8b41aa889_012full.jpg
2. Kipushi Mine
Democratic Republic of Congo
The ultra-high grade Kipushi zinc-copper-germanium-silver mine in the DRC is located adjacent to the town of Kipushi, approximately 30 kilometres southwest of Lubumbashi on the Central African Copperbelt. Kipushi is approximately 250 kilometres southeast of the Kamoa-Kakula Copper Complex and less than one kilometre from the Zambian border.
Ivanhoe acquired its
Kipushi's zinc-rich Big Zinc and Southern Zinc orebodies have a Measured and Indicated Mineral Resource of 11.78 million tonnes grading
Kipushi's high-grade zinc concentrate assays also include germanium and gallium. Germanium is a strategic metal used today in electronic devices, flat-panel display screens, light-emitting diodes, night vision devices, optical fibre, optical lens systems, and solar power arrays. Gallium is a strategic metal used today to manufacture compound semiconductor wafers used in integrated circuits, and optoelectronic devices such as laser diodes, light-emitting diodes, photodetectors, and solar cells.
Ivanhoe, together with its joint-venture partner, restarted the Kipushi zinc mine ahead of schedule in mid-2024, with the ramp-up to steady state operations continuing during the fourth quarter. On November 17, 2024, His Excellency Félix Tshisekedi, President of the Democratic Republic of the Congo, along with a government delegation, officially reopened the Kipushi zinc mine.
Kipushi summary of operating and financial data
| FY 2024 | Q4 2024 | Q3 2024 | |||||
| Ore tonnes milled (000's tonnes) | 228 | 135 | 93 | ||||
| Zinc ore grade processed (%) | |||||||
| Zinc recovery (%) | |||||||
| Zinc in concentrate produced (tonnes) | 50,307 | 32,323 | 17,984 | ||||
| Payable zinc sold (tonnes) | 16,999 | 16,999 | - | ||||
| Cost of sales per pound ($ per lb.) | 1.38 | 1.38 | - | ||||
| Cash cost (C1) ($ per lb.) | 1.13 | 1.13 | - | ||||
| Realized zinc price ($ per lb.) | 1.38 | 1.38 | - | ||||
| Sales revenue before remeasurement ($'000) | 41,600 | 41,600 | - | ||||
| Remeasurement of contract receivables ($'000) | (782) | (782 | ) | - | |||
| Sales revenue after remeasurement ($'000) | 40,818 | 40,818 | - | ||||
| EBITDA ($'000) | 4,050 | 4,050 | - | ||||
| EBITDA margin (% of sales revenue) | - |
C1 cash cost per pound of payable zinc can be further broken down as follows:
| FY 2024 | Q4 2024 | ||||||
| Mining | ($ per lb.) | 0.26 | 0.26 | ||||
| Processing | ($ per lb.) | 0.12 | 0.12 | ||||
| Logistics charges | ($ per lb.) | 0.48 | 0.48 | ||||
| Treatment charges | ($ per lb.) | 0.17 | 0.17 | ||||
| Support services | ($ per lb.) | 0.10 | 0.10 | ||||
| Cash cost (C1) per pound of payable zinc sold | ($ per lb.) | 1.13 | 1.13 |
Cash cost (C1) is prepared on a basis consistent with the industry standard definitions by Wood Mackenzie cost guidelines but cash cost per pound for the Kipushi Mine has been presented on a per ton sold basis to eliminate the impact of unsold tonnes of zinc concentrate in inventory. Cash cost (C1) and cash cost per pound are not measures recognized under IFRS Accounting Standards. C1 cash cost is used by management to evaluate operating performance and include all direct mining, processing, and general and administrative costs. Smelter charges and freight deductions on sales to the final port of destination, which are recognized as a component of sales revenues, are added to C1 cash cost to arrive at an approximate cost of delivered, finished metal. C1 cash cost excludes royalties, production taxes, and non-routine charges as they are not direct production costs.
All figures are on a
Kipushi produced 50,307 tonnes of zinc during inaugural year, including a monthly record 14,900 tonnes in December as ramp-up approaches nameplate throughput
In 2024, the Kipushi concentrator milled 228,293 tonnes of ore at an average grade of
Kipushi's concentrator milled approximately 135,285 tonnes of ore during the fourth quarter at an average feed grade of
During the fourth quarter of 2024, the Kipushi concentrator regularly operated at its name plate mill feed rate of 80 tonnes per hour required to achieve the designed 800,000 plant feed tonnes per annum. As a result, Kipushi was deemed to have entered commercial production in Q4 2024.
Following slower-than-anticipated ramp-up progress in the third quarter, operations at the Kipushi concentrator significantly improved during the fourth quarter, with several processing records achieved. 135,285 tonnes of ore were milled at an average grade of
In addition, during the last day of the year, a record 750 tonnes of zinc were produced over 24 hours, exceeding nameplate capacity. Over the same period, 2,200 tonnes of ore were milled by the concentrator, in line with the design rate. The Kipushi concentrator is expected to consistently achieve its nameplate milling rate during the first quarter of 2025.
The Kipushi concentrator's metallurgical recoveries improved to over
Engineering and procurement of long-lead order equipment items are well underway for the debottlenecking program. The debottlenecking of the Kipushi concentrator is targeting a
Kipushi is evaluating the production of a pyrite concentrate from the current flotation tailings. Pyrite can be used as a supplement during copper flash smelting, adding additional heat during copper concentrate combustion. Kipushi has the potential to produce between 5,000 and 10,000 tonnes per month of high-grade pyrite concentrate using conventional flotation, thickening, and filtration. Pyrite concentrate will be required at the Kamoa direct-to-blister smelter, due for start-up later this year.
Various infrastructure projects were commissioned in Q4 2024. The Kipushi P4 Ventilation Shaft system was upgraded, and the main intake substation electrical switchgear panels and main distribution transformer were replaced. A new power factor correction facility was successfully introduced into the electrical network.
Run-of-mine stockpiles to support ramp-up to steady-state production
At the end of December 2024, Kipushi's high-and medium-grade ore surface stockpiles, adjacent to the Kipushi concentrator, totaled approximately 344,000 tonnes at an estimated average grade of
Underground development during the fourth quarter was affected by localized flooding of the decline and several other development ends. The flooding was caused by a failure of the electrical feeder cables to the main P5 shaft pump station. Water was diverted to the decline area to prevent shaft flooding. Power restrictions have hampered the progress in dewatering the decline, impacting on development metres achieved, as well as head grade. Year to date, over 3,500 metres of underground development have been completed.
The new cemented aggregate fill plant and associated infrastructure on surface and underground were commissioned to facilitate the underground engineering backfill requirements. The first stope backfilling commenced in December 2024.
ZINC PRODUCTION AND CASH COST GUIDANCE FOR 2025
| Kipushi 2025 Guidance | |||
| Contained zinc in concentrate (tonnes) | 180,000 - 240,000 | ||
| Cash cost (C1) ($ per pound of payable zinc) | 0.90 to 1.00 |
Guidance figures are on a
The Company's 2025 production guidance is based on several assumptions and estimates as of December 31, 2024. The guidance involves estimates of known and unknown risks, uncertainties, and other factors that may cause the actual results to differ materially.
Kipushi is targeting a production rate of over 250,000 tonnes of zinc in concentrate for 2026, following the completion of ramp-up and debottlenecking activities, targeted for the third quarter of 2025.
The Kipushi Mine produced a total of 32,323 tonnes of zinc in concentrate for the fourth quarter of 2024, and 50,307 tonnes of zinc for the year.
Cash cost (C1) per pound of payable zinc sold amounted to
Cash cost guidance is based on assumptions including the ramp-up of the concentrator to steady state production, reliability of DRC grid power supply, the timing and successful completion of the debottlenecking program, and prevailing logistics rates among other variables.
Cash cost (C1) is a non-GAAP measure used by management to evaluate operating performance and includes all direct mining, processing, stockpile rehandling charges, and general and administrative costs. Smelter charges and freight deductions on sales to the final port of destination, which are recognized as a component of sales revenues, are added to cash cost (C1) to arrive at an approximate cost of delivered finished metal.
For historical comparatives, see the non-GAAP Financial Performance Measures section of this press release.

Raisebore Operator, Progress Chende, drilling the stope slots on the 1,395-metre level.
To view an enhanced version of this graphic, please visit:
https://images.newsfilecorp.com/files/3396/241566_d2e17de8b41aa889_013full.jpg
Aerial view of the Kipushi concentrator. The Kipushi concentrator's metallurgical recoveries improved to over
To view an enhanced version of this graphic, please visit:
https://images.newsfilecorp.com/files/3396/241566_d2e17de8b41aa889_014full.jpg
3. Platreef Project
South Africa
The Platreef Project is owned by Ivanplats (Pty) Ltd. (Ivanplats), which is
The Platreef Project hosts an underground deposit of thick, platinum-group metals, nickel, copper, and gold mineralization on the Northern Limb of the Bushveld Igneous Complex in Limpopo Province - approximately 280 kilometres northeast of Johannesburg and eight kilometres from the town of Mokopane in South Africa.
On the Northern Limb, platinum-group metals mineralization is primarily hosted within the Platreef, a mineralized sequence traced for more than 30 kilometres along strike. Ivanhoe's Platreef Project, within the Platreef's southern sector, is comprised of two contiguous properties: Turfspruit and Macalacaskop. Turfspruit, the northernmost property, is contiguous with, and along strike from, Anglo Platinum's Mogalakwena group of mining operations and properties.
Since 2007, Ivanhoe has focused its exploration and development activities on defining and advancing the down-dip extension of its original discovery at Platreef, now known as the Flatreef Deposit, which is amenable to highly mechanized, underground mining methods.
Cold commissioning of the Phase 1 concentrator completed early in Q3; first ore scheduled for Q4 2025 while underground development prioritizes waste development to accelerate the start of Phase 2
Construction of Platreef's Phase 1 concentrator was completed on schedule early in the third quarter. Cold commissioning started in July, with water being fed through the concentrator. The concentrator will be kept on care and maintenance until Q4 2025, as Shaft #1 prioritizes the hoisting of waste development required to bring forward the start of Phase 2.

Cold commissioning of the Phase 1 concentrator completed early in Q3 2024, while first ore is scheduled for Q4 2025.
To view an enhanced version of this graphic, please visit:
https://images.newsfilecorp.com/files/3396/241566_d2e17de8b41aa889_015full.jpg

Platreef Winder Driver, Luzuko Eric Kweba, working the controls.
To view an enhanced version of this graphic, please visit:
https://images.newsfilecorp.com/files/3396/241566_d2e17de8b41aa889_016full.jpg
Ivanhoe Mines unveils Independent Phase 2 and Phase 3 Expansion Studies for the super-giant Platreef Mine - a world-class, lowest-cost precious metals and critical minerals producer
On February 18, 2025, Ivanhoe Mines announced that the company's subsidiary, Ivanplats, and its partners, welcomed the positive and significant results from two independent technical studies completed on the Phase 2 and Phase 3 expansions of the tier-one Platreef platinum, palladium, rhodium, nickel, gold, and copper mine in South Africa.
The two completed independent studies cover the three-phase development of the Platreef mine, as shown in Figure 2. This includes an updated Feasibility Study on the Phase 2 expansion to 4.1 Mtpa of processing capacity (4.1 Mtpa FS), followed by a Preliminary Economic Assessment covering a new Phase 3 expansion to 10.7 Mtpa of processing capacity (10.7 Mtpa PEA).
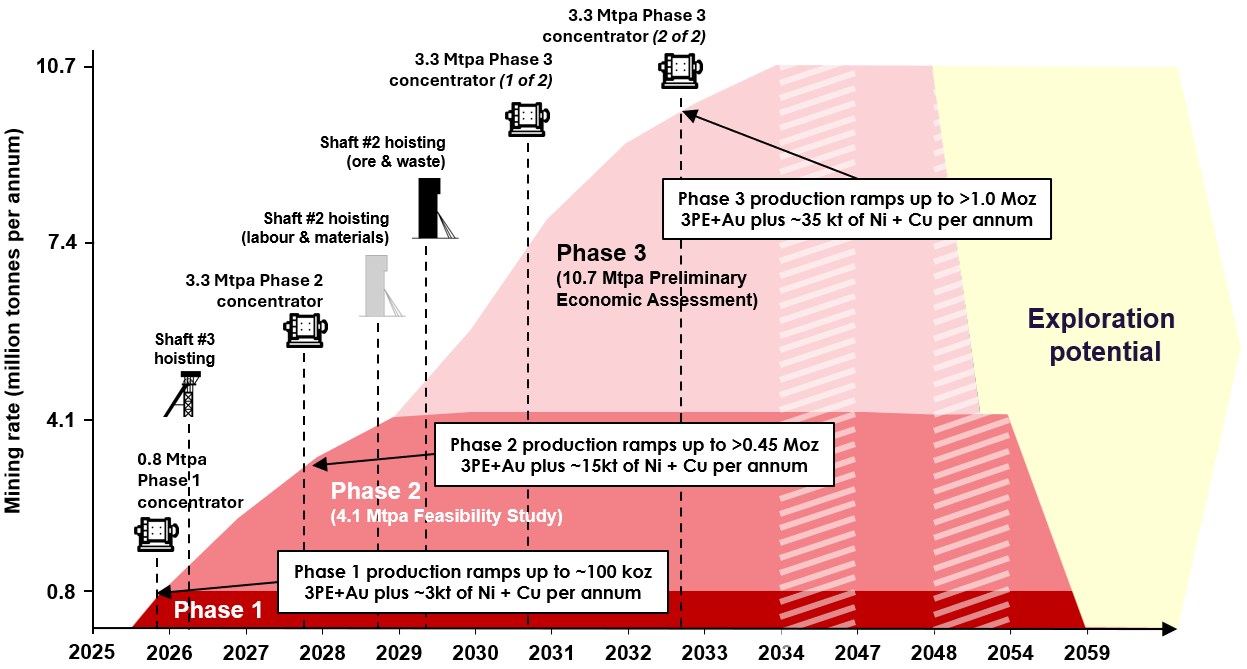
Figure 2: Phased development schematic of the Platreef mine, showing the annualized mining rate over life of mine.
To view an enhanced version of this graphic, please visit:
https://images.newsfilecorp.com/files/3396/241566_d2e17de8b41aa889_017full.jpg
4.1 Mtpa Feasibility Study targets first production from Phase 1 in Q4 2025 and Phase 2 expansion in Q4 2027.
Key Highlights
First feed of ore into the 770-ktpa Phase 1 concentrator is expected in Q4 2025.
Phase 1 annualized production is expected to ramp up to approximately 100,000 oz. of platinum, palladium, rhodium, and gold (3PE+Au), plus 2,000 tonnes of nickel and 1,000 tonnes of copper.
Phase 1 will use both Shaft #1 and Shaft #3 for hoisting ore and waste, with a total combined hoisting capacity of up to 5.0 Mtpa.
The remaining capital expenditure for Phase 1 is
$70 million .The 4.1 Mtpa FS outlines an increase in the total processing capacity to approximately 4.1 Mtpa. This is achieved from a new 3.3-Mtpa Phase 2 concentrator module from Q4 2027.
The 4.1 Mtpa FS ranks Platreef as the lowest-cost primary platinum-group metals (PGM) producer, with estimated life of mine (LOM) total cash costs of
$599 per oz. of 3PE+Au, including royalties, streams, and net of by-products. Including sustaining capital, total cash costs are$704 per oz of 3PE+Au, as shown in Figure 3.The 4.1 Mtpa FS estimates LOM annualized production, once fully ramped up, of between 450,000 and 550,000 oz. of 3PE+Au, plus approximately 9,000 tonnes of nickel and 5,600 tonnes of copper. This is expected to rank Platreef as the eighth-largest primary PGM producer on a platinum-equivalent basis, as shown in Figure 4.
The 4.1 Mtpa FS will initially use Shaft #1 and Shaft #3 for hoisting ore and waste to feed the Phase 2 concentrator module. Shaft #2 is expected to be initially equipped for hoisting labour and materials from 2029, further increasing total hoisting capacity, and providing significant operational flexibility.
The expansion capital cost for 4.1 Mtpa FS is estimated at
$1.2 billion , which is expected to be funded from an expanded project finance facility and equity.The 4.1 Mtpa FS delivers an after-tax net present value at an
8% discount rate (NPV8% ) of$1.4 billion and an internal rate of return (IRR) of20% , based on long-term consensus prices over a mine life of 35 years.
10.7 Mtpa PEA outlines an expansion from 2030 to rank Platreef as one of the largest global primary PGM producers, as well as a significant nickel producer
Key Highlights
The 10.7 Mtpa PEA includes a further phase of expansion, Phase 3, to a total processing capacity of 10.7 Mtpa, following the completion of two additional 3.3-Mtpa concentrator modules in 2030 and 2032.
LOM total cash costs for the 10.7 Mtpa PEA are expected to be
$511 per oz. of 3PE+Au, net of by-products, benefitting from significant economies of scale. Including sustaining capital, total cash costs are expected to be$641 per ounce of 3PE+Au, net of by-products, as shown in Figure 3.Annualized production in the 10.7 Mtpa PEA, once fully ramped up, is expected to be between 1.0 and 1.2 million oz. of 3PE+Au, plus approximately 22,000 tonnes of nickel and 13,000 tonnes of copper. Phase 3 is expected to rank Platreef as one of the largest primary PGM producers on a platinum equivalent basis, as shown in Figure 4, as well as a significant nickel producer
The 10.7 Mtpa PEA uses Shaft #2 and Shaft #3 for hoisting ore and waste with a combined total capacity of over 12 Mtpa.
The incremental expansion capital cost for the 10.7 Mtpa PEA is estimated at
$803 million , leveraging the significant surface and underground infrastructure already constructed during Phase 2.The 10.7 Mtpa PEA delivers an NPV
8% of$3.2 billion and an IRR of25% , based on long-term consensus prices over a mine life of 29 years.
The 10.7 Mtpa PEA is preliminary and includes an economic analysis that is based, in part, on Inferred Mineral Resources. Inferred Mineral Resources are considered too speculative geologically for the application of economic considerations that would allow them to be categorized as Mineral Reserves - and there is no certainty that the results will be realized. Mineral Resources do not have demonstrated economic viability and are not Mineral Reserves.

Figure 3: Global primary PGM producers' 2024 total cash costs, net of by-products, and sustaining capital ($ per oz of 3PE+Au).
To view an enhanced version of this graphic, please visit:
https://images.newsfilecorp.com/files/3396/241566_d2e17de8b41aa889_018full.jpg
Source: SFA (Oxford), Ivanplats. Notes: Cost and production data for the Platreef project is based on the Platreef's 2025 4.1 Mtpa FS and 10.7 Mtpa PEA parameters, applying SFA South African industry average smelting and refining costs. SFA's estimated peer group cost and production data for 2024 is based on H1 2024 figures, extrapolated out to produce an estimate for the full calendar year, and follows a methodology to provide a level playing field for smelting and refining costs on a pro-rata basis from the producer processing entity. Net total cash costs have been calculated using 2024 average basket prices and exchange rates of 18.78:1 ZAR: USD, US

Figure 4: Ranking of selected global primary PGM producers, based on 2024E platinum equivalent production (000 Pt eq. ounces).
To view an enhanced version of this graphic, please visit:
https://images.newsfilecorp.com/files/3396/241566_d2e17de8b41aa889_019full.jpg
Source: SFA (Oxford), Ivanplats. Notes: The chart only includes primary PGM producers. Cost and production data for the Platreef project is based on the Platreef's 2025 4.1 Mtpa FS and 10.7 Mtpa PEA parameters. Production data for the peer group is provided by SFA (Oxford). Equivalent platinum production has been calculated using average 2024 prices and exchange rates of 18.78:1 ZAR: USD, US
Reaming of Shaft #3 from 950 metres recently completed; Phase 2 expansion based on additional hoisting capacity from Shaft #3
The Phase 2 expansion will be accelerated by the completion Shaft #3 which provides a significant increase in hoisting capacity.
The reaming of Shaft #3 to a diameter of 5.1 metres down was completed in Q4 2024. Reaming is the process of boring, or excavating, a vertical shaft from the bottom up and it is the quickest and safest method of constructing a shaft. Once equipped, Shaft #3 is expected to be ready for hoisting in the first quarter of 2026, well ahead of the completion of the much larger Shaft #2, which is targeting the first of two rock winders to be operational in 2029.
Additional underground ventilation will now be provided by two new 5.1-metre-diameter shafts, named Shaft #4 and Shaft #5. Drilling of the pilot hole for Shaft #4 was completed, with reaming well advanced. Civil construction of Shaft #4's substation building and ventilation fans has been completed with the fan installation advancing well. Shaft #4 is expected to be operational from Q3 2025 and Shaft #5 is targeting completion in Q1 2027.
The installation of the 1,124 tonnes of internal structural steel inside Shaft #2's head frame continued during the quarter, as well as the installation of the Sinking Winders and related infrastructure. Reaming of Shaft #2 to an initial diameter of 3.1 metres has also been completed. Expansion of the shaft to its final diameter of 10 metres will commence in late 2025. The completion of Shaft #2 will increase the total hoisting capacity for ore and waste development, across all three shafts to over 12 Mtpa.
Construction of Platreef's 5-MW solar power facility was completed in early Q1 2025. The power generated by the plant will support development activities and operations, together with other renewable energy sources that are expected to be introduced over time.

Construction of the headframes for Shaft #2 (left) and Shaft #3 (right) are well advanced.
To view an enhanced version of this graphic, please visit:
https://images.newsfilecorp.com/files/3396/241566_d2e17de8b41aa889_020full.jpg

Construction of Platreef's first 5-MW solar plant was completed in January 2025.
To view an enhanced version of this graphic, please visit:
https://images.newsfilecorp.com/files/3396/241566_d2e17de8b41aa889_021full.jpg
4. Western Forelands Exploration Project
Democratic Republic of Congo
Ivanhoe's DRC exploration group is targeting Kamoa-Kakula-style copper mineralization on its Western Forelands exploration licences. More recent discoveries at Makoko, Makoko West, Kiala, and Kitoko, confirm the effectiveness of these models and the understanding of controls on this highly valuable and unique style of mineralization.
Diamond drilling during the fourth quarter of 2024 focused on wide-spaced, step-out drilling to define the extent of copper mineralization hosted in the Katangan Shelf sediments of the Nguba Group at Makoko, Makoko West, Kitoko and on the newly acquired licence along strike of Makoko West. Drilling was conducted using eight contractor rigs and produced a total of 18,703 metres of core in 38 holes. A total of 81,734 metres were drilled in 2024 in 126 holes, exceeding the planned diamond drilling target of 70,000 metres.
Drilling at Makoko West continues to define the extent of a ~2.7km zone of thick, low to medium-grade mineralization at depths of between 400 metres and 600 metres below surface, and to identify higher grades within this zone.
Shallow, high-grade copper mineralization at Makoko West is being followed along strike where four holes intersected a mafic intrusion at the base of the Nguba sediments.
Mineralization at Kitoko remains open downdip with the deepest holes completed in 2024 continuing to intersect medium to high-grade copper mineralization at widths greater than five metres.
Three diamond drill holes were completed on the Sakanama prospect to test the extent of copper-cobalt mineralization associated with Mine Series rocks of the Roan Group, and to improve the geological model of the complex folding and thrusting relationships on this prospect. A full review of the prospect are being conducted in early 2025 when geochemical results including cobalt values are received from the external laboratory.
The soil sampling program over the Chipaya prospect on newly acquired licences to the northwest of Makoko was completed in the quarter. Samples are being analyzed for trace element geochemistry and results will be used to refine the geological model in the area in preparation for targeting and exploration drilling in 2025.
Reverse circulation drilling continued in the Kamilli region to sample the top of the Katangan Shelf sediments below the Kalahari sand. The swap to reverse circulation drilling has improved the success rate of holes completed through hard silcrete layers, allowing sampling teams to sample the residual soils associated with the Katangan in this area. The analytical results of 2024 soil sampling are expected shortly and will be used to assist in the identification and refinement of exploration diamond drilling targets.
The planned passive seismic programs at both Lupemba and Kitoko were completed during the fourth quarter, with results and interpretation of survey expected in Q1 2025. The passive seismic program is aimed at defining the thickness of Kalahari sand, the location of thick mafic intrusions below Nguba sediments, and the depth to the Kibaran basement which will assist with focused targeting of follow-up drilling.
Ground gravity continued in Q4 with lines over Lupemba, Lubudi, and several regional lines collected. Ground gravity has proved to be a useful tool to identify major faults and lineaments on surface, identifying low-density areas where sediments have been more highly weathered due to extensive fracturing and surface water infiltration.
5. Global Exploration Portfolio
Mokopane Feeder Project, South Africa
Ivanhoe Mines is exploring the Northern Limb of South Africa's the Bushveld Complex, adjacent to Ivanplat's Platreef Project. Ivanhoe's geologists are testing a large gravity-high anomaly based on wide-spaced historical Council for Geoscience data. The anomaly is interpreted to represent. The working hypothesis is that the large gravity-high anomaly is interpreted by scientific research to represent a potential primary feeder zone of magma and mineralization into the Northern Limb of the Bushveld Complex, essentially the sources of mineralization that make up the Platreef and other Northern Limb deposits.
The collection, interpretation, and review process of all geological and geophysical data was completed early in 2024. The geological understanding of the anomaly continues to evolve, with numerous targets identified for drilling.
Following the completion of heritage surveys and community engagement around the proposed drilling sites, diamond drilling contractor, Geosearch, was appointed and commenced drilling after year-end in January 2025. A 6,000-metre diamond-core drill program is planned over four holes. Completion of the program is expected by the end of 2025. Downhole geophysics will be conducted concurrently with drilling.
The Chu-Sarysu Basin Exploration Joint Venture, Central Kazakhstan
Ivanhoe Mines has formed an exploration Joint Venture with UK-based private company Pallas Resources, to explore the Chu-Sarysu Copper Basin in Kazakhstan, the world's third-largest sediment-hosted copper district. The joint venture covers a highly prospective licence package of up to 16,000 km2, which spans an accumulated dataset of Soviet-era exploration data.
As announced on February 12, 2025, Ivanhoe has committed to fund
Exploration activities are underway, including the hiring of a dedicated exploration team. An airborne geophysics contract is currently under tender and is expected to be awarded imminently.
Moxico and Cuando Cubango Provinces, Angola
Ivanhoe's exploration team is targeting Western-Forelands-style sedimentary copper mineralization in Angola. The team is deploying its exploration expertise developed from its discoveries in the Western Forelands and from Kamoa-Kakula, to its vast greenfield exploration package in Angola.
The team has a developed an exploration thesis that the DRC's Western Forelands shelf extends into eastern Angola. As announced on November 27, 2023, Ivanhoe acquired approximately 22,000 km2 of prospecting rights in the Moxico and Cuando Cubango provinces of Angola. Concurrently, Ivanhoe signed a mining investment contract with the Angolan National Agency for Mineral Resources.
After receiving the required permitting, access onto the licenses was first made by Ivanhoe's geologists in August 2024. The team undertook a mapping and baseline soil geochemical sampling program over an area of 600 km2, which covered the same portion of the license flown by the airborne electro-magnetic survey. A ground-based geophysics program was also completed, including Audio-frequency (AMT) and Magnetotellurics (MT) in conjunction with a Passive Seismic survey, down the eastern portion of the license area.
The results from the 2024 work streams will be analyzed over the wet season, with targets generated in time for the start of the 2025 exploration program. The wet season, like the DRC, is expected to finish in April-May, after which two diamond core drill rigs are planned to be mobilized to complete an initial 6,400-metre stratigraphic diamond drill program.

The specialty diamond drill rig lining up ahead of the first drill hole of the Mokopane Feeder drill program. The program is expected to consist of 6,000 metres across 4 drill holes.
To view an enhanced version of this graphic, please visit:
https://images.newsfilecorp.com/files/3396/241566_d2e17de8b41aa889_022full.jpg
SELECTED ANNUAL FINANCIAL INFORMATION
The selected financial information is in accordance with IFRS as presented in the annual consolidated financial statements. Ivanhoe had operating revenue from Kipushi during the fourth quarter of 2024 but not in any other financial reporting period. All operating revenue from commercial production at Kamoa-Kakula is recognized within the Kamoa Holding joint venture. Ivanhoe did not declare or pay any dividend or distribution in any financial reporting period.
| For the year ended December 31, | |||||||||
| 2024 | 2023* | 2022* | |||||||
| $'000 | $'000 | $'000 | |||||||
| Revenue | 40,818 | - | - | ||||||
| Cost of sales | (51,563 | ) | - | - | |||||
| Share of profit from joint venture net of tax | 291,908 | 274,826 | 254,180 | ||||||
| Finance income | 241,535 | 239,563 | 175,298 | ||||||
| Deferred tax recovery | 17,857 | 8,304 | 113,250 | ||||||
| (Loss) gain on fair valuation of embedded derivative liability | (164,169 | ) | (85,261 | ) | 22,900 | ||||
| General and administrative expenditure | (56,582 | ) | (43,833 | ) | (36,254 | ) | |||
| Finance costs | (49,135 | ) | (31,497 | ) | (38,084 | ) | |||
| Share-based payments | (27,919 | ) | (29,269 | ) | (27,216 | ) | |||
| Exploration and project evaluation expenditure | (48,148 | ) | (22,657 | ) | (33,912 | ) | |||
| Profit (loss) attributable to: | |||||||||
| Owners of the Company | 228,135 | 318,928 | 410,864 | ||||||
| Non-controlling interest | (34,841 | ) | (15,984 | ) | 23,242 | ||||
| Total comprehensive income (loss) attributable to: | |||||||||
| Owners of the Company | 217,064 | 307,578 | 409,542 | ||||||
| Non-controlling interest | (36,027 | ) | (17,116 | ) | 23,338 | ||||
| Basic profit per share | 0.17 | 0.26 | 0.34 | ||||||
| Diluted profit per share | 0.17 | 0.26 | 0.33 | ||||||
| Total assets | 5,737,555 | 5,000,261 | 3,969,285 | ||||||
| Non-current liabilities | 663,357 | 422,034 | 377,323 | ||||||
*The prior periods presented have been restated in accordance with the amendments to IAS 1
DISCUSSION OF RESULTS OF OPERATIONS
Review of the year ended December 31, 2024 vs. December 31, 2023
The company recorded a profit for the year of
The Kamoa-Kakula Copper Complex sold 396,972 tonnes of payable copper in 2024 realizing revenue of
| Year ended | ||||||
| December 31, | ||||||
| 2024 | 2023 | |||||
| $'000 | $'000 | |||||
| Company's share of profit from joint venture | 291,908 | 274,826 | ||||
| Interest on loan to joint venture | 224,258 | 207,608 | ||||
| Company's income recognized from joint venture | 516,166 | 482,434 | ||||
The company's share of profit from the Kamoa Holding joint venture was
| Year ended | ||||||
| December 31, | ||||||
| 2024 | 2023 | |||||
| $'000 | $'000 | |||||
| Revenue from contract receivables | 3,158,942 | 2,697,257 | ||||
| Remeasurement of contract receivables | (52,331 | ) | 6,701 | |||
| Revenue | 3,106,611 | 2,703,958 | ||||
| Cost of sales | (1,497,758 | ) | (1,103,110 | ) | ||
| Gross profit | 1,608,853 | 1,600,848 | ||||
| General and administrative costs | (164,299 | ) | (142,707 | ) | ||
| Amortization of mineral property | (15,205 | ) | (11,465 | ) | ||
| Profit from operations | 1,429,349 | 1,446,676 | ||||
| Finance costs | (301,243 | ) | (352,700 | ) | ||
| Foreign exchange loss | (21,513 | ) | (59,898 | ) | ||
| Finance income and other | 15,852 | 34,306 | ||||
| Profit before taxes | 1,122,445 | 1,068,384 | ||||
| Current tax expense | (348,732 | ) | (292,303 | ) | ||
| Deferred tax recovery (expense) | 3,198 | (65,569 | ) | |||
| Profit after taxes | 776,911 | 710,512 | ||||
| Non-controlling interest of Kamoa Holding | (187,198 | ) | (155,308 | ) | ||
| Total comprehensive income for the year | 589,713 | 555,204 | ||||
| Company's share of profit from joint venture ( | 291,908 | 274,826 | ||||
The realized, provisional, and forward copper prices used for the remeasurement (mark-to-market) of contract receivables of the Kamoa Holding joint venture for the year ended December 31, 2024, can be summarized as follows:
| FY 2024 | Q4 2024 | Q3 2024 | Q2 2024 | Q1 2024 | |||||||||||
| $'000 | $'000 | $'000 | $'000 | $'000 | |||||||||||
| Realized during the period - open at the start of the period | |||||||||||||||
| Opening forward price ($/lb.)(1) | 3.86 | 4.41 | 4.32 | 3.99 | 3.86 | ||||||||||
| Realized price ($/lb.)(1) | 3.81 | 4.12 | 4.18 | 4.30 | 3.78 | ||||||||||
| Payable copper tonnes sold | 35,966 | 34,398 | 63,633 | 29,142 | 35,966 | ||||||||||
| Remeasurement of contract receivables ($'000) | (3,980 | ) | (21,999 | ) | (20,442 | ) | 20,218 | (6,040 | ) | ||||||
| Realized during the period - new copper sold in the current period | |||||||||||||||
| Provisional price ($/lb.)(1) | 4.17 | 4.33 | 4.15 | 4.31 | 3.78 | ||||||||||
| Realized price ($/lb.)(1) | 4.12 | 4.05 | 4.14 | 4.37 | 3.85 | ||||||||||
| Payable copper tonnes sold | 316,974 | 32,812 | 68,725 | 31,345 | 55,529 | ||||||||||
| Remeasurement of contract receivables ($'000) | (37,878 | ) | (19,956 | ) | (2,088 | ) | 4,453 | 8,801 | |||||||
| Open at the end of the period - open at the start of the period | |||||||||||||||
| Open at the end of the period - new copper sold in current period | |||||||||||||||
| Provisional price ($/lb.)(1) | 4.07 | 4.07 | 4.23 | 4.47 | 3.94 | ||||||||||
| Closing forward price ($/lb.)(1) | 4.01 | 4.01 | 4.41 | 4.32 | 3.99 | ||||||||||
| Payable copper tonnes sold | 79,999 | 79,999 | 34,382 | 64,555 | 29,626 | ||||||||||
| Remeasurement of contract receivables ($'000) | (10,473 | ) | (10,473 | ) | 13,547 | (21,415 | ) | 3,063 | |||||||
| Total remeasurement of contract receivables ($'000) | (52,331 | ) | (52,428 | ) | (8,983 | ) | 3,256 | 5,824 | |||||||
(1) Calculated on a weighted average basis
The finance costs recognized in the Kamoa Holding joint venture can be broken down as follows:
| Year ended | ||||||
| December 31, | ||||||
| 2024 | 2023 | |||||
| $'000 | $'000 | |||||
| Interest on shareholder loans | 452,917 | 419,292 | ||||
| Interest on shareholder loans - capitalized as borrowing costs | (309,601 | ) | (144,796 | ) | ||
| Interest on provisional and advance payment facilities | 112,182 | 56,970 | ||||
| Interest on bank loans and overdraft facilities | 22,852 | 6,903 | ||||
| Interest on equipment financing facilities | 9,728 | 10,428 | ||||
| Lease liability unwinding | 7,214 | 3,903 | ||||
| Rehabilitation unwinding | 5,951 | - | ||||
| 301,243 | 352,700 | |||||
Ivanhoe's exploration and project evaluation expenditure amounted to
Finance income amounted to
As explained in the accounting for the convertible notes section in the MD&A accompanying this press release available on www.ivanhoemines.com, the company recognized a loss on fair valuation of the embedded derivative financial liability of
The company sold 16,999 tonnes of payable zinc produced by the Kipushi Mine in 2024 realizing revenue of
The realized, provisional, and forward zinc prices used for the remeasurement (mark-to-market) of contract receivables of Kipushi for the year ended December 31, 2024, can be summarized as follows:
| FY 2024 | Q4 2024 | |||||
| $'000 | $'000 | |||||
| Realized during the period - new zinc sold in the current period | ||||||
| Provisional price ($/lb.)(1) | 1.39 | 1.39 | ||||
| Realized price ($/lb.)(1) | 1.38 | 1.38 | ||||
| Payable zinc tonnes sold | 5,090 | 5,090 | ||||
| Remeasurement of contract receivables ($'000) | (81 | ) | (81 | ) | ||
| Open at the end of the period - new zinc sold in the current period | ||||||
| Provisional price ($/lb.)(1) | 1.37 | 1.37 | ||||
| Closing forward price ($/lb.)(1) | 1.34 | 1.34 | ||||
| Payable zinc tonnes sold | 11,909 | 11,909 | ||||
| Remeasurement of contract receivables ($'000) | (701 | ) | (701 | ) | ||
| Total remeasurement of contract receivables ($'000) | (782 | ) | (782 | ) |
(1) Calculated on a weighted average basis
The total comprehensive income for the year ended December 31, 2024, included an exchange loss on translation of foreign operations of
Financial position as at December 31, 2024, vs. December 31, 2023
The company's total assets increased by
The company's investment in the Kamoa Holding joint venture increased by
| December 31, | December 31, | |||||
| 2024 | 2023 | |||||
| $'000 | $'000 | |||||
| Company's share of net assets in joint venture | 1,890,974 | 785,265 | ||||
| Loan advanced to joint venture | 1,142,742 | 1,732,286 | ||||
| Total investment in joint venture | 3,033,716 | 2,517,551 |
The company's share of the net assets in the Kamoa Holding joint venture can be broken down as follows:
| December 31, 2024 | December 31, 2023 | |||||||||||
| $'000 | $'000 | $'000 | $'000 | |||||||||
| Assets | ||||||||||||
| Property, plant, and equipment | 6,122,292 | 3,030,535 | 4,195,216 | 2,076,632 | ||||||||
| Mineral property | 763,217 | 377,792 | 778,423 | 385,319 | ||||||||
| Indirect taxes receivable | 651,915 | 322,698 | 419,779 | 207,791 | ||||||||
| Current inventory | 564,685 | 279,519 | 435,212 | 215,430 | ||||||||
| Long-term loan receivable | 374,485 | 185,370 | 306,594 | 151,764 | ||||||||
| Other receivables | 371,077 | 183,683 | 320,143 | 158,471 | ||||||||
| Run of mine stockpile | 318,688 | 157,751 | 304,261 | 150,609 | ||||||||
| Trade receivables | 280,795 | 138,993 | 241,944 | 119,762 | ||||||||
| Cash and cash equivalents | 100,641 | 49,817 | 72,486 | 35,881 | ||||||||
| Right-of-use asset | 51,764 | 25,623 | 56,966 | 28,198 | ||||||||
| Deferred tax asset | 27,594 | 13,659 | 606 | 300 | ||||||||
| Prepaid expenses | 17,377 | 8,602 | 81,802 | 40,492 | ||||||||
| Non-current deposits | 1,872 | 927 | 1,872 | 927 | ||||||||
| Liabilities | ||||||||||||
| Shareholder loans | (2,308,984 | ) | (1,142,947 | ) | (3,500,105 | ) | (1,732,552 | ) | ||||
| Trade and other payables | (700,803 | ) | (346,897 | ) | (471,377 | ) | (233,332 | ) | ||||
| Advance payment facility | (681,345 | ) | (337,266 | ) | (150,449 | ) | (74,472 | ) | ||||
| Term loan facilities | (668,508 | ) | (330,911 | ) | (111,193 | ) | (55,041 | ) | ||||
| Deferred tax liability | (323,546 | ) | (160,155 | ) | (322,194 | ) | (159,486 | ) | ||||
| Overdraft facility | (232,475 | ) | (115,075 | ) | (177,775 | ) | (87,999 | ) | ||||
| Rehabilitation provision | (123,668 | ) | (61,216 | ) | (95,081 | ) | (47,065 | ) | ||||
| Provisional payment facility | (78,993 | ) | (39,102 | ) | (51,501 | ) | (25,493 | ) | ||||
| Other provisions | (58,279 | ) | (28,848 | ) | (33,344 | ) | (16,505 | ) | ||||
| Lease liability | (52,093 | ) | (25,786 | ) | (51,913 | ) | (25,697 | ) | ||||
| Income taxes payable | 9,227 | 4,567 | (217,028 | ) | (107,429 | ) | ||||||
| Non-controlling interest | (606,788 | ) | (300,360 | ) | (446,950 | ) | (221,240 | ) | ||||
| Net assets of the joint venture | 3,820,147 | 1,890,974 | 1,586,394 | 785,265 |
In December 2024, Kamoa Holding and its shareholders, including Ivanhoe Mines US LLC, entered into a subscription and set-off agreement. In accordance with this agreement, the shareholders subscribed for additional common shares in Kamoa Holding, in proportion to their current shareholding. A portion of the interest payable on the shareholder loans was offset as consideration for these additional shares. This re-capitalization was carried out to streamline the holding structure and comply with the debt-equity ratio required under Barbados tax law enabling the deductibility of the interest expense for tax purposes.
Before commencing commercial production in July 2021, the Kamoa Holding joint venture principally used loans from its shareholders to develop the Kamoa-Kakula Copper Complex through investing in development costs and other property, plant, and equipment. No additional shareholder loans were advanced from 2022 to date with joint venture cashflow and joint venture level facilities funding its operations and expansions.
Overdraft facilities represent drawn unsecured financing facilities from DRC financial institutions at an attractive cost of capital, utilized to augment cash generated from operations for Kamoa-Kakula's continued expansion and working capital. Total available overdraft facilities amount to
The term loan facilities of the Kamoa Holding joint venture can be summarized as follows:
| Description | Repayment terms | December 31, | December 31, | ||||
| 2024 | 2023 | ||||||
| $'000 | $'000 | ||||||
| Syndicated term facility | Repayable in eight equal quarterly installments starting from March 31, 2026 | 403,568 | - | ||||
| Facility agreement | Full repayment on June 25, 2025 | 199,911 | - | ||||
| Equipment financing facilities | Installments on each quarterly facility repayment date, with | 65,029 | 111,193 | ||||
| Total term loan facilities | 668,508 | 111,193 |
The cash flows of the Kamoa Holding joint venture can be summarized as follows:
| Year ended | ||||||
| December 31, | ||||||
| 2024 | 2023 | |||||
| $'000 | $'000 | |||||
| Net cash generated from operating activities before change in working capital items | 1,209,337 | 1,448,888 | ||||
| Change in working capital items | (313,475 | ) | (485,043 | ) | ||
| Net cash used in investing activities | (1,941,722 | ) | (1,523,874 | ) | ||
| Net cash generated from financing activities | 1,023,673 | 87,646 | ||||
| Effect of foreign exchange rates on cash | (4,358 | ) | 1,461 | |||
| Net cash outflow | (26,545 | ) | (470,922 | ) | ||
| Cash and cash equivalents - beginning of the year | (105,289 | ) | 365,633 | |||
| Cash and cash equivalents - end of the year | (131,834 | ) | (105,289 | ) | ||
The Kamoa Holding joint venture's net increase in property, plant, and equipment from December 31, 2023, to December 31, 2024, amounted to
| Three months ended | Year ended | |||||||||||
| December 31, | December 31, | |||||||||||
| 2024 | 2023 | 2024 | 2023 | |||||||||
| $'000 | $'000 | $'000 | $'000 | |||||||||
| Kamoa Holding joint venture | ||||||||||||
| Expansion capital | 225,400 | 442,498 | 1,622,923 | 1,302,873 | ||||||||
| Sustaining capital | 96,327 | 73,644 | 315,872 | 213,897 | ||||||||
| 321,727 | 516,142 | 1,938,795 | 1,516,770 | |||||||||
| Depreciation capitalized | 20,131 | 10,379 | 60,105 | 39,792 | ||||||||
| Total capital expenditure | 341,858 | 526,521 | 1,998,900 | 1,556,562 | ||||||||
| Borrowing costs capitalized | 82,510 | 53,153 | 309,601 | 144,796 | ||||||||
| Total additions to property, plant, and equipment for Kamoa Holding | 424,368 | 579,674 | 2,308,501 | 1,701,358 | ||||||||
| Less depreciation, disposals, and foreign exchange translation | (120,717 | ) | (110,980 | ) | (381,425 | ) | (239,318 | ) | ||||
| Net increase in property, plant, and equipment of Kamoa Holding | 303,651 | 468,694 | 1,927,076 | 1,462,040 | ||||||||
Ivanhoe's cash and cash equivalents decreased by
The net increase in property, plant, and equipment amounted to
The main components of the additions to property, plant, and equipment - including capitalized development costs - at the Platreef and Kipushi projects for the three months ended December 31, 2024, and for the same period in 2023, are set out in the following tables:
| Three months ended | Year ended | |||||||||
| December 31, | December 31, | |||||||||
| 2024 | 2023 | 2024 | 2023 | |||||||
| $'000 | $'000 | $'000 | $'000 | |||||||
| Platreef Project | ||||||||||
| Phase 2 construction | 41,438 | 15,244 | 137,543 | 56,649 | ||||||
| Phase 1 construction | 4,418 | 34,438 | 54,146 | 130,720 | ||||||
| Salaries and benefits | 12,331 | 5,710 | 29,366 | 15,253 | ||||||
| Administrative and other expenditure | 5,855 | 3,046 | 14,163 | 8,560 | ||||||
| Depreciation | 2,477 | 2,574 | 8,791 | 6,985 | ||||||
| Social and environmental | 1,062 | 1,354 | 3,610 | 2,785 | ||||||
| Site costs | 1,650 | 1,097 | 5,381 | 4,195 | ||||||
| Studies and contracting work | 540 | (1,972 | ) | 3,211 | 1,419 | |||||
| Total development costs | 69,771 | 61,491 | 256,211 | 226,566 | ||||||
| Other additions to property, plant, and equipment | 11,065 | 7,547 | 19,438 | 14,124 | ||||||
| Total additions to property, plant, and equipment for Platreef | 80,836 | 69,038 | 275,649 | 240,690 | ||||||
| Three months ended | Year ended | |||||||||
| December 31, | December 31, | |||||||||
| 2024 | 2023 | 2024 | 2023 | |||||||
| $'000 | $'000 | $'000 | $'000 | |||||||
| Kipushi Mine | ||||||||||
| Mine construction costs | 7,611 | 62,032 | 116,081 | 158,061 | ||||||
| Other additions to property, plant, and equipment | - | 351 | 171 | 802 | ||||||
| Other expenditure | - | 7,089 | 14,196 | 15,516 | ||||||
| Salaries and benefits | - | 5,691 | 26,715 | 17,953 | ||||||
| Administration and overheads | - | 4,381 | 17,619 | 16,451 | ||||||
| Studies and contracting work | - | 4,353 | 9,995 | 10,150 | ||||||
| Depreciation | - | 1,984 | 4,530 | 8,224 | ||||||
| Electricity | - | 1,674 | 7,841 | 6,967 | ||||||
| Total project expenditure | 7,611 | 87,555 | 197,148 | 234,124 | ||||||
| Accounted for as follows: | ||||||||||
| Additions to property, plant, and equipment | 7,611 | 62,383 | 116,252 | 158,863 | ||||||
| Development costs capitalized to property, plant, and equipment | - | 25,172 | 80,896 | 75,261 | ||||||
| Total project expenditure | 7,611 | 87,555 | 197,148 | 234,124 | ||||||
Costs incurred during 2024 at the Platreef Project and Kipushi Mine are deemed necessary to bring the project to commercial production and are therefore capitalized as property, plant, and equipment. During the fourth quarter of 2024, the Kipushi Mine was deemed to have entered into commercial production, therefore the majority of
its assets under construction were transferred to the appropriate classes of property, plant, and equipment during Q4 2024.
The company's total liabilities decreased by
Ivanplats drew on
In Q4 2024, Ivanhoe Marketing (Pty) Ltd. (Ivanhoe Marketing), a subsidiary of the Company, entered into a
Kipushi also entered into a
During the second quarter of 2024, Kipushi entered into a
On June 28, 2024, and July 5, 2024, Kipushi entered into off-taker facility agreements with Trafigura Asia Trading Pte Ltd. (Trafigura) and CITIC Metal (HK) Limited (CITIC) respectively. Each of the off-taker facility agreements made
SELECTED QUARTERLY FINANCIAL INFORMATION
The following table summarizes selected financial information for the prior eight quarters. Ivanhoe had no operating revenue in any financial reporting period and did not declare or pay any dividend or distribution in any financial reporting period.
| Three months ended | ||||||||||||
| December 31, | September 30, | June 30, | March 31, | |||||||||
| 2024 | 2024 | 2024 | 2024 | |||||||||
| $'000 | $'000 | $'000 | $'000 | |||||||||
| Revenue | 40,818 | - | - | - | ||||||||
| Cost of sales | (51,563 | ) | - | - | - | |||||||
| Share of profit from joint venture | 73,620 | 83,507 | 89,616 | 45,165 | ||||||||
| Finance income | 56,041 | 60,164 | 62,873 | 62,457 | ||||||||
| Deferred tax recovery | 12,663 | 575 | 1,398 | 3,221 | ||||||||
| Finance costs | (6,849 | ) | (471 | ) | (32,871 | ) | (8,944 | ) | ||||
| Loss on fair valuation of embedded derivative liability | - | (4,171 | ) | (20,727 | ) | (139,271 | ) | |||||
| General administrative expenditure | (19,663 | ) | (10,573 | ) | (12,345 | ) | (14,001 | ) | ||||
| Exploration and project evaluation expenditure | (15,845 | ) | (12,813 | ) | (10,589 | ) | (8,901 | ) | ||||
| Share-based payments | (2,977 | ) | (7,504 | ) | (8,505 | ) | (8,933 | ) | ||||
| Profit (loss) attributable to: | ||||||||||||
| Owners of the Company | 99,344 | 117,942 | 76,401 | (65,552 | ) | |||||||
| Non-controlling interests | (11,338 | ) | (9,760 | ) | (9,885 | ) | (3,858 | ) | ||||
| Total comprehensive income (loss) attributable to: | ||||||||||||
| Owners of the Company | 60,964 | 141,525 | 88,223 | (73,648 | ) | |||||||
| Non-controlling interest | (15,158 | ) | (7,469 | ) | (8,672 | ) | (4,728 | ) | ||||
| Basic profit (loss) per share | 0.07 | 0.09 | 0.06 | (0.05 | ) | |||||||
| Diluted profit (loss) per share | 0.07 | 0.09 | 0.06 | (0.05 | ) | |||||||
| Three months ended | ||||||||||||
| December 31, | September 30, | June 30, | March 31, | |||||||||
| 2023 | 2023 | 2023 | 2023 | |||||||||
| $ | '000 | $ | '000 | $ | '000 | $ | '000 | |||||
| Share of profit from joint venture | 49,272 | 69,829 | 73,066 | 82,659 | ||||||||
| Finance income | 63,110 | 56,671 | 61,956 | 57,826 | ||||||||
| (Loss) gain on fair valuation of embedded derivative liability | (39,961 | ) | 12,218 | (26,618 | ) | (30,900 | ) | |||||
| General administrative expenditure | (14,947 | ) | (9,841 | ) | (10,474 | ) | (8,571 | ) | ||||
| Finance costs | (6,741 | ) | (8,752 | ) | (5,539 | ) | (10,465 | ) | ||||
| Share-based payments | (7,715 | ) | (6,732 | ) | (7,120 | ) | (7,702 | ) | ||||
| Exploration and project evaluation expenditure | (8,637 | ) | (6,264 | ) | (4,375 | ) | (3,381 | ) | ||||
| Deferred tax recovery | 4,201 | 1,212 | 1,965 | 926 | ||||||||
| Profit (loss) attributable to: | ||||||||||||
| Owners of the Company | 27,739 | 112,510 | 92,042 | 86,637 | ||||||||
| Non-controlling interests | (1,980 | ) | (4,988 | ) | (4,859 | ) | (4,157 | ) | ||||
| Total comprehensive income (loss) attributable to: | ||||||||||||
| Owners of the Company | 37,155 | 109,681 | 86,588 | 74,154 | ||||||||
| Non-controlling interest | (1,003 | ) | (5,250 | ) | (5,433 | ) | (5,420 | ) | ||||
| Basic profit per share | 0.02 | 0.09 | 0.08 | 0.07 | ||||||||
| Diluted profit per share | 0.02 | 0.08 | 0.07 | 0.07 | ||||||||
Review of the three months ended December 31, 2024 vs. December 31, 2023
The company recorded a profit for Q4 2024 of
The Kipushi Mine, which achieved commercial production in Q4 2024, produced 32,323 tonnes of zinc in concentrate during Q4 2024. The Company sold 16,999 tonnes of payable zinc produced by the Kipushi Mine in Q4 2024 realizing revenue of
The Kamoa-Kakula Copper Complex sold 112,811 tonnes of payable copper in Q4 2024 realizing revenue of
| Three months ended | ||||||
| December 31, | ||||||
| 2024 | 2023 | |||||
| $'000 | $'000 | |||||
| Company's share of profit from joint venture | 73,620 | 49,272 | ||||
| Interest on loan to joint venture | 53,667 | 58,618 | ||||
| Company's income recognized from joint venture | 127,287 | 107,890 | ||||
The company's share of profit from the Kamoa Holding joint venture was
| Three months ended | ||||||
| December 31, | ||||||
| 2024 | 2023 | |||||
| $'000 | $'000 | |||||
| Revenue from contract receivables | 895,758 | 625,983 | ||||
| Remeasurement of contract receivables | (52,428 | ) | (8,365 | ) | ||
| Revenue | 843,330 | 617,618 | ||||
| Cost of sales | (482,070 | ) | (299,857 | ) | ||
| Gross profit | 361,260 | 317,761 | ||||
| General and administrative costs | (68,299 | ) | (51,635 | ) | ||
| Amortization of mineral property | (4,862 | ) | (2,862 | ) | ||
| Profit from operations | 288,099 | 263,264 | ||||
| Finance costs | (72,569 | ) | (88,229 | ) | ||
| Foreign exchange (loss) gain | 3,707 | (10,431 | ) | |||
| Finance income and other | 5,006 | 18,795 | ||||
| Profit before taxes | 224,243 | 183,399 | ||||
| Current tax expense | (21,561 | ) | (52,434 | ) | ||
| Deferred tax expense | (13,507 | ) | (1,018 | ) | ||
| Profit after taxes | 189,175 | 129,947 | ||||
| Non-controlling interest of Kamoa Holding | (40,448 | ) | (30,408 | ) | ||
| Total comprehensive income for the year | 148,727 | 99,539 | ||||
| Company's share of profit from joint venture ( | 73,620 | 49,272 | ||||
Kamoa-Kakula's operating data is summarized under the review of operations section on page 5.
The finance costs recognized in the Kamoa Holding joint venture can be broken down as follows:
| Three months ended | ||||||
| December 31, | ||||||
| 2024 | 2023 | |||||
| $'000 | $'000 | |||||
| Interest on shareholder loans | 105,295 | 118,389 | ||||
| Interest on shareholder loans - capitalized as borrowing costs | (82,511 | ) | (53,080 | ) | ||
| Interest on provisional and advance payment facilities | 32,289 | 15,490 | ||||
| Interest on bank loans and overdraft facilities | 7,669 | 2,836 | ||||
| Interest on equipment financing facilities | 2,035 | 2,776 | ||||
| Lease liability unwinding | 1,841 | 1,818 | ||||
| Rehabilitation unwinding | 5,951 | - | ||||
| 72,569 | 88,229 | |||||
Ivanhoe's exploration and project evaluation expenditure amounted to
Finance income for Q4 2024 amounted to
LIQUIDITY AND CAPITAL RESOURCES
The company had
The company's capital expenditure can be summarized as follows:
| Capital Expenditure | 2024 Guidance | 2024 Actuals | 2025 Guidance | 2026 Guidance | ||||
| ($' million) | ($' million) | ($' million) | ($' million) | |||||
| Kamoa-Kakula | ||||||||
| Phase 3 and expansion capital | 1,350 - 1,750 | 1,623 | 1,050 - 1,300 | 300 - 550 | ||||
| Sustaining capital | 240 | 316 | 370 | 380 | ||||
| 1,590 - 1,990 | 1,939 | 1,420 - 1,670 | 680 - 930 | |||||
| Platreef | ||||||||
| Phase 1 initial capital | 110 - 140 | 129 | 70 | - | ||||
| Phase 2 capital | 130 - 180 | 138 | 180 - 210 | 350 - 380 | ||||
| 240 - 320 | 267 | 250 - 280 | 350 - 380 | |||||
| Kipushi | ||||||||
| Initial and expansion capital | 185 | 185 | 30 | - | ||||
| Sustaining capital | 35 | 7 | 40 | 35 | ||||
| 220 | 192 | 70 | 35 | |||||
Figures in the above table are presented on a
Kamoa-Kakula's operations are anticipated to generate significant operating cash flow and are expected to, together with joint venture-level financing facilities, be sufficient to fund the 2025 capital cost requirements at current copper prices. Kamoa-Kakula's 2025 guidance is provisional only and will be updated on the completion of the Kamoa-Kakula 2025 Integrated Development Plan with the updated project development strategy, which is expected to be completed in Q2 2025.
Construction of Platreef's Phase 1 concentrator was completed on schedule in Q3 2024 and is currently on care and maintenance until Q4 2025, as Shaft #1 prioritizes the hoisting of waste from the development required to bring forward the start of Phase 2. Phase 1 first production is expected in Q4 2025 with the Phase 2 expansion accelerated to Q4 2027. The 2025 Capital Expenditure guidance for Platreef has been reduced to align with the recently released Phase 2 expansion study.
Ivanhoe's exploration budget for 2025 has been set to approximately
On January 16, 2025, the company announced that it had priced an offering (the "Offering") of an aggregate principal amount of
The following pro-rata financial ratios have been calculated by aggregating the contributions of the company with the contributions from the Kamoa-Kakula joint venture, pro rata to the company's effective shareholding in the Kamoa-Kakula JV.
| (in millions of $, except ratios) | December 31, 2024 | ||
| Pro-rata total debt | 1,016.3 | ||
| Pro-rata cash | 163.5 | ||
| Pro-rata net debt | 852.8 | ||
| Pro-rata finance costs | (108.5 | ) | |
| Pro-rata net debt to Adjusted EBITDA(1) | 1.36x |
(1) Pro-rata net debt to adjusted EBITDA ratio is a non-GAAP financial measure. Pro-rata net debt to adjusted EBITDA ratio is pro-rata net debt divided by adjusted EBITDA for the twelve months ended at the reporting period, expressed as the number of times adjusted EBITDA needs to be earned to repay the pro-rata net debt.
The company's pro-rata total debt is summarized as follows:
| December 31, | December 31, | |||||
| 2024 | 2023 | |||||
| $'millions | $'millions | |||||
| Consolidated indebtedness of the Company: | ||||||
| Senior debt facility | 63.4 | - | ||||
| Advance payment facilities | 120.0 | - | ||||
| Other borrowings | 175.0 | 140.0 | ||||
| Convertible notes | - | 802.5 | ||||
| 358.4 | 942.5 | |||||
| Pro-rata indebtedness of the Kamoa Holding joint venture | ||||||
| Term loan facilities | 264.7 | 44.0 | ||||
| Advance payment facilities | 269.8 | 59.6 | ||||
| Provisional payment facilities | 31.3 | 20.4 | ||||
| Overdraft facilities | 92.1 | 70.4 | ||||
| 657.9 | 194.4 | |||||
| Pro-rata total debt | 1,016.3 | 1,136.9 |
The pro-rata cash and cash equivalents of the company are summarized as follows:
| December 31, | December 31, | |||
| 2024 | 2023 | |||
| $'millions | $'millions | |||
| Consolidated cash and cash equivalents of the Company | 117.3 | 574.3 | ||
| Pro-rata cash and cash equivalents of the Kamoa Holding joint venture | 46.2 | 31.6 | ||
| Pro-rata cash and cash equivalents | 163.5 | 605.9 |
The pro-rata net debt of the Company is summarized as follows:
| December 31, | December 31, | |||||
| 2024 | 2023 | |||||
| $'millions | $'millions | |||||
| Pro-rata total debt | 1,016.3 | 1,136.9 | ||||
| Pro-rata cash and cash equivalents | 163.5 | 605.9 | ||||
| Pro-rata net debt | 852.8 | 531.0 |
SUMMARY OF DEBT FACILITIES
On December 10, 2024, Kipushi entered into a
On October 25, 2024, Ivanhoe Marketing and RMB entered into a
During the second quarter of 2024, Kipushi entered into a
On December 22, 2023, Ivanplats entered into a common terms and senior secured facility agreement between, amongst others, Société Générale and Nedbank Limited (acting through its Nedbank Corporate and Investment Banking Division) (Nedbank) as lenders; Ivanplats as borrower; Ivanplats Holding S.À.R.L, ITC, and Ivanhoe Mines SA (Pty) Ltd. as guarantors; Ivanhoe Mines Ltd. as sponsor; and Nedbank Limited as global facility agent (as amended and amended and restated from time to time, the "Platreef Senior Debt Financing Agreement"). Under the Platreef Senior Debt Financing Agreement, the lenders thereunder make available to Ivanplats a senior secured facility in an aggregate principal amount of up to
On August 4, 2023, the company entered into an
The company has a mortgage bond outstanding on its offices in London, United Kingdom, of £3.2 million (
In 2013, the company became a party to a loan payable to ITC Platinum Development Limited, which had a carrying value and contractual value of
The company has an implied commitment in terms of spending on work programs submitted to regulatory bodies to maintain the good standing of exploration and exploitation permits at its mineral properties. The following table sets forth the company's long-term obligations:
| Contractual obligations as at December 31, 2024 | Payments Due By Period | ||||||||||||
| Total | Less than 1 year | 1-3 years | 4-5 years | After 5 years | |||||||||
| $'000 | $'000 | $'000 | $'000 | $'000 | |||||||||
| Debt | 439,542 | 119,940 | 91,587 | 210,602 | 17,413 | ||||||||
| Lease commitments | 1,165 | 390 | 775 | - | - | ||||||||
| Total contractual obligations | 440,707 | 120,330 | 92,362 | 210,602 | 17,413 | ||||||||
Debt in the above table represents the senior debt facility, the advance payment facilities, the RMB loan facilities, mortgage bond owing to Citibank, the loan payable to ITC Platinum Development Limited, the loan from FirstBank, the aircraft loan as described above.
NON-GAAP FINANCIAL PERFORMANCE MEASURES
Kamoa-Kakula's cash cost (C1) per pound is a non-GAAP financial measure. These are disclosed to enable investors to better understand the performance of Kamoa-Kakula in comparison to other copper producers who present results on a similar basis.
Cash cost (C1) is prepared on a basis consistent with the industry standard definitions by Wood Mackenzie cost guidelines but are not measures recognized under IFRS Accounting Standards. In calculating the C1 cash cost, the costs are measured on the same basis as the company's share of profit from the Kamoa Holding joint venture that is contained in the financial statements. C1 cash cost is used by management to evaluate operating performance and includes all direct mining, processing, and general and administrative costs. Smelter charges and freight deductions on sales to the final port of destination, which are recognized as a component of sales revenues, are added to C1 cash cost to arrive at an approximate cost of finished metal. C1 cash cost and C1 cash cost per pound exclude royalties, production taxes, and non-routine charges as they are not direct production costs.
Reconciliation of Kamoa-Kakula's cost of sales to C1 cash cost, including on a per pound basis:
| Three months ended | Year ended | |||||||||||
| December 31, | December 31, | |||||||||||
| 2024 | 2023 | 2024 | 2023 | |||||||||
| $'000 | $'000 | $'000 | $'000 | |||||||||
| Cost of sales | 482,070 | 299,857 | 1,497,758 | 1,103,110 | ||||||||
| Logistics, treatment, and refining charges | 126,550 | 117,307 | 471,045 | 475,097 | ||||||||
| General and administrative expenditure | 86,886 | 51,634 | 182,886 | 142,705 | ||||||||
| Royalties and production taxes | (76,783 | ) | (59,446 | ) | (264,768 | ) | (233,702 | ) | ||||
| Depreciation | (117,574 | ) | (57,812 | ) | (328,234 | ) | (193,714 | ) | ||||
| Power rebate | (3,769 | ) | (4,564 | ) | (16,932 | ) | (18,490 | ) | ||||
| Non-cash adjustments to inventory | 37,582 | (20,082 | ) | 58,795 | (20,411 | ) | ||||||
| Extraordinary taxes | (21,100 | ) | (21,026 | ) | (43,017 | ) | (21,026 | ) | ||||
| General and administrative expenditures of other group entities | (10,601 | ) | (2,452 | ) | (13,494 | ) | (11,562 | ) | ||||
| C1 cash costs | 503,261 | 303,416 | 1,544,039 | 1,222,007 | ||||||||
| Cost of sales per pound of payable copper sold ($ per lb.) | 1.94 | 1.50 | 1.71 | 1.33 | ||||||||
| C1 cash costs per pound of payable copper produced ($ per lb.) | 1.75 | 1.53 | 1.65 | 1.45 | ||||||||
| Payable copper produced in concentrate (tonnes) | 130,275 | 90,146 | 425,746 | 381,689 | ||||||||
Figures in the above table are for the Kamoa-Kakula joint venture on a
Reconciliation of Kipushi's cost of sales to C1 cash cost, including on a per pound basis:
| Three months ended | Year ended | |||||||||||
| December 31, | December 31, | |||||||||||
| 2024 | 2023 | 2024 | 2023 | |||||||||
| $'000 | $'000 | $'000 | $'000 | |||||||||
| Cost of sales | 51,563 | - | 51,563 | - | ||||||||
| Logistics and treatment charges | 9,926 | - | 9,926 | - | ||||||||
| General and administrative expenditure | 384 | - | 384 | - | ||||||||
| Royalties and production taxes | (2,104) | - | (2,104) | - | ||||||||
| Depreciation | (15,769) | - | (15,769) | - | ||||||||
| General and administrative expenditures of other group entities | (1,806) | - | (1,806) | - | ||||||||
| C1 cash costs | 42,194 | - | 42,194 | - | ||||||||
| Cost of sales per pound of payable zinc sold ($ per lb.) | 1.38 | - | 1.38 | - | ||||||||
| C1 cash costs per pound of payable zinc sold ($ per lb.) | 1.13 | - | 1.13 | - | ||||||||
| Payable zinc sold in concentrate (tonnes) | 16,999 | - | 16,999 | - | ||||||||
EBITDA, Adjusted EBITDA and EBITDA margin, normalized profit after tax, and normalized profit per share
EBITDA and Adjusted EBITDA are non-GAAP financial measures. Ivanhoe believes that Kamoa-Kakula's EBITDA is a valuable indicator of the mine's ability to generate liquidity by producing operating cash flow to fund its working capital needs, service debt obligations, fund capital expenditures and distribute cash to its shareholders. EBITDA and Adjusted EBITDA are also frequently used by investors and analysts for valuation purposes. Kamoa-Kakula's EBITDA and the EBITDA and Adjusted EBITDA for the Company are intended to provide additional information to investors and analysts and do not have any standardized definition under IFRS Accounting Standards and should not be considered in isolation or as a substitute for measures of performance prepared per IFRS Accounting Standards. EBITDA and Adjusted EBITDA exclude the impact of cash cost of financing activities and taxes, and the effects of changes in operating working capital balances, and therefore are not necessarily indicative of operating profit or cash flow from operations as determined under IFRS Accounting Standards. Other companies may calculate EBITDA and Adjusted EBITDA differently.
The EBITDA margin is an indicator of Kamoa-Kakula's overall health and denotes its profitability, which is calculated by dividing EBITDA by revenue. The EBITDA margin is intended to provide additional information to investors and analysts, does not have any standardized definition under IFRS Accounting Standards, and should not be considered in isolation, or as a substitute, for measures of performance prepared per IFRS Accounting Standards.
Reconciliation of profit after tax to Kamoa-Kakula's EBITDA:
| Three months ended | Year ended | |||||||||||
| December 31, | December 31, | |||||||||||
| 2024 | 2023 | 2024 | 2023 | |||||||||
| $'000 | $'000 | $'000 | $'000 | |||||||||
| Profit after taxes | 189,175 | 129,947 | 776,911 | 710,512 | ||||||||
| Depreciation | 122,436 | 60,674 | 343,439 | 205,179 | ||||||||
| Finance costs | 72,569 | 88,229 | 301,243 | 352,700 | ||||||||
| Other taxes | 21,100 | 21,026 | 43,017 | 21,026 | ||||||||
| Current and deferred tax expense | 35,068 | 53,452 | 345,534 | 357,872 | ||||||||
| Finance income | (5,805 | ) | (5,223 | ) | (16,580 | ) | (20,891 | ) | ||||
| Unrealized foreign exchange (gain) loss | (2,741 | ) | 9,300 | 20,123 | 68,157 | |||||||
| Derecognition loss | - | (13,506 | ) | - | (13,506 | ) | ||||||
| EBITDA | 431,802 | 343,899 | 1,813,687 | 1,681,049 | ||||||||
Figures in the above table are for the Kamoa-Kakula joint venture on a
Reconciliation of loss after tax to Kipushi's EBITDA:
| Three months ended | Year ended | |||||||||||
| December 31, | December 31, | |||||||||||
| 2024 | 2023 | 2024 | 2023 | |||||||||
| $'000 | $'000 | $'000 | $'000 | |||||||||
| Loss after taxes | (8,642 | ) | - | (8,642 | ) | - | ||||||
| Depreciation | 15,769 | - | 15,769 | - | ||||||||
| Finance costs | 6,502 | - | 6,502 | - | ||||||||
| Current and deferred tax expense | (8,746 | ) | - | (8,746 | ) | - | ||||||
| Finance income | (2,368 | ) | - | (2,368 | ) | - | ||||||
| Unrealized foreign exchange loss | 1,535 | - | 1,535 | - | ||||||||
| EBITDA | 4,050 | - | 4,050 | - | ||||||||
Reconciliation of profit after tax to Ivanhoe's EBITDA and adjusted EBITDA:
| Three months ended | Year ended | |||||||||||
| December 31, | December 31, | |||||||||||
| 2024 | 2023 | 2024 | 2023 | |||||||||
| $'000 | $'000 | $'000 | $'000 | |||||||||
| Profit after taxes | 88,006 | 25,759 | 193,294 | 302,944 | ||||||||
| Finance income | (56,041 | ) | (63,110 | ) | (241,535 | ) | (239,563 | ) | ||||
| Current and deferred tax recovery | (12,443 | ) | (3,901 | ) | (14,176 | ) | (7,658 | ) | ||||
| Unrealized foreign exchange loss (gain) | 2,840 | (2,100 | ) | 9,893 | 2,111 | |||||||
| Finance costs | 6,849 | 6,741 | 49,135 | 31,497 | ||||||||
| Depreciation | 11,452 | 507 | 13,908 | 2,295 | ||||||||
| Amortization of mineral property | 5,367 | - | 5,367 | - | ||||||||
| EBITDA | 46,030 | (36,104 | ) | 15,886 | 91,626 | |||||||
| Share of profit from joint venture net of tax | (73,620 | ) | (49,272 | ) | (291,908 | ) | (274,826 | ) | ||||
| Company's share of EBITDA from Kamoa-Kakula joint venture(1) | 158,871 | 135,787 | 711,868 | 664,272 | ||||||||
| Derecognition loss | - | 11,924 | - | 11,924 | ||||||||
| Loss on fair valuation of embedded derivative liability | - | 39,961 | 164,169 | 85,261 | ||||||||
| Non-cash share-based payments | 4,306 | 6,509 | 24,869 | 26,197 | ||||||||
| Adjusted EBITDA | 135,587 | 108,805 | 624,884 | 604,454 | ||||||||
| Q4 2024 | Q3 2024 | Q2 2024 | Q1 2024 | |||||||||
| $ | '000 | $ | '000 | $ | '000 | $ | '000 | |||||
| Profit (loss) after taxes | 88,006 | 108,182 | 66,516 | (69,410 | ) | |||||||
| Finance income | (56,041 | ) | (60,164 | ) | (62,873 | ) | (62,457 | ) | ||||
| Current and deferred tax (recovery) expense | (12,443 | ) | 644 | 782 | (3,159 | ) | ||||||
| Finance costs | 6,849 | 471 | 32,871 | 8,944 | ||||||||
| Unrealized foreign exchange loss (gain) | 2,840 | (1,319 | ) | 2,257 | 6,115 | |||||||
| Depreciation | 11,452 | 1,010 | 688 | 758 | ||||||||
| Amortization of mineral property | 5,367 | - | - | - | ||||||||
| EBITDA | 46,030 | 48,824 | 40,241 | (119,209 | ) | |||||||
| Share of profit from joint venture net of tax | (73,620 | ) | (83,507 | ) | (89,616 | ) | (45,165 | ) | ||||
| Company's share of EBITDA from Kamoa-Kakula joint venture(1) | 158,871 | 184,720 | 224,113 | 144,164 | ||||||||
| Loss on fair valuation of embedded derivative liability | - | 4,171 | 20,727 | 139,271 | ||||||||
| Non-cash share-based payments | 4,306 | 5,764 | 7,459 | 7,340 | ||||||||
| Adjusted EBITDA | 135,587 | 159,972 | 202,924 | 126,401 | ||||||||
(1) The company's attributable share of EBITDA from the Kamoa-Kakula joint venture is calculated using the company's effective shareholding in Kamoa Copper SA (
Normalized profit after tax and normalized profit per share are non-GAAP financial measures. Normalized profit after tax and normalized profit per share for the company are intended to provide additional information to investors and analysts and do not have any standardized definition under IFRS Accounting Standards and should not be considered in isolation or as a substitute for measures of performance prepared per IFRS Accounting Standards. Other companies may calculate normalized profit after tax and normalized profit per share differently.
Below is a table reconciling the company's profit after taxes to the company's normalized profit after taxes. Normalized profit after taxes excludes the loss on fair valuation of the embedded derivative liability and the finance costs on the early redemption of the convertible notes.
| Three months ended | Year ended | |||||||||||
| December 31, | December 31, | |||||||||||
| 2024 | 2023 | 2024 | 2023 | |||||||||
| $'000 | $'000 | $'000 | $'000 | |||||||||
| Profit after taxes | 88,006 | 25,759 | 193,294 | 302,944 | ||||||||
| Finance costs on early redemption of convertible notes | - | - | 28,076 | - | ||||||||
| Loss on fair valuation of embedded derivative liability | - | 39,961 | 164,169 | 85,261 | ||||||||
| Normalized profit after taxes | 88,006 | 65,720 | 385,539 | 388,205 | ||||||||
Below is a table reconciling the company's basic profit per share to the company's normalized profit per share. Normalized profit per share excludes the loss on fair valuation of the embedded derivative liability and the finance costs on the early redemption of the convertible notes.
| Three months ended | Year ended | |||||||||||
| December 31, | December 31, | |||||||||||
| 2024 | 2023 | 2024 | 2023 | |||||||||
| $'000 | $'000 | $'000 | $'000 | |||||||||
| Profit attributable to the owners of the Company | 99,344 | 27,739 | 228,135 | 318,928 | ||||||||
| Finance costs on early redemption of convertible notes | - | - | 28,076 | - | ||||||||
| Loss on fair valuation of embedded derivative liability | - | 39,961 | 164,169 | 85,261 | ||||||||
| Normalized profit attributable to owners of the Company | 99,344 | 67,700 | 420,380 | 404,189 | ||||||||
| Weighted average number of basic shares outstanding | 1,351,181,822 | 1,227,514,455 | 1,313,389,735 | 1,220,711,543 | ||||||||
| Basic profit per share | 0.07 | 0.02 | 0.17 | 0.26 | ||||||||
| Normalized profit per share | 0.07 | 0.06 | 0.32 | 0.33 | ||||||||
This news release should be read in conjunction with Ivanhoe Mines' audited 2024 Financial Statements and Management's Discussion and Analysis report available at www.ivanhoemines.com and www.sedarplus.ca.
Disclosure of technical information
Disclosures of a scientific or technical nature at the Kamoa-Kakula Copper Complex and the Kipushi Project, other than stockpiles, in this news release have been reviewed and approved by Steve Amos, who is considered, by virtue of his education, experience, and professional association, a Qualified Person under the terms of NI 43-101. Mr. Amos is not considered independent under NI 43-101 as he is Ivanhoe Mines' Executive Vice President, Projects. Mr. Amos has verified the technical data disclosed in this news release.
Disclosures of a scientific or technical nature regarding the stockpiles in this news release have been reviewed and approved by Joshua Chitambala, who is considered, by virtue of his education, experience, and professional association, a Qualified Person under the terms of NI 43-101. Mr. Chitambala is not considered independent under NI 43-101 as he is the Resource Manager for Ivanhoe Mines. Mr. Chitambala has verified the other technical data regarding the surface stockpiles disclosed in this news release.
Disclosures of a scientific or technical nature regarding the Western Forelands Exploration Project in this press release have been reviewed and approved by Tim Williams, who is considered, by virtue of his education, experience, and professional association, a Qualified Person under the terms of NI 43-101. Mr. Williams is not considered independent under NI 43-101 as he is the Vice President, Geosciences, at Ivanhoe Mines. Mr. Williams has verified the technical data regarding the Western Forelands Exploration Project disclosed in this press release.
Ivanhoe has prepared an independent, NI 43-101-compliant technical report for the Kamoa-Kakula Copper Complex, the Platreef Project, and the Kipushi Mine, each of which is available on the company's website and under the company's SEDAR+ profile at www.sedarplus.ca
Kamoa-Kakula Integrated Development Plan 2023 Technical Report dated March 6, 2023, prepared by OreWin Pty Ltd.; China Nerin Engineering Co. Ltd.; DRA Global; Epoch Resources; Golder Associates Africa; Metso Outotec Oyj; Paterson and Cooke; SRK Consulting Ltd.; and The MSA Group.
The Kipushi 2022 Feasibility Study dated February 14, 2022, prepared by OreWin Pty Ltd., MSA Group (Pty) Ltd., SRK Consulting (South Africa) (Pty) Ltd, and METC Engineering.
The Platreef 2022 Feasibility Study dated February 28, 2022, prepared by OreWin Pty Ltd., Mine Technical Services, SRK Consulting Inc., DRA Projects (Pty) Ltd and Golder Associates Africa.
These technical reports include relevant information regarding the effective dates and the assumptions, parameters, and methods of the mineral resource estimates on the Platreef Project, the Kipushi Mine, and the Kamoa-Kakula Copper Complex cited in this press release, as well as information regarding data verification, exploration procedures and other matters relevant to the scientific and technical disclosure contained in this press release in respect of the Platreef Project, Kipushi Mine and Kamoa-Kakula Copper Complex.
Information contact
Follow Robert Friedland (@robert_ivanhoe) and Ivanhoe Mines (@IvanhoeMines_) on Twitter.
Investors
Vancouver: Matthew Keevil +1 604 558 1034
London: Tommy Horton +44 7866 913 207
Media
Tanya Todd +1 604 331 9834
Website www.ivanhoemines.com
Forward-looking statements
Certain statements in this news release constitute "forward-looking statements" or "forward-looking information" within the meaning of applicable securities laws. Such statements and information involve known and unknown risks, uncertainties, and other factors that may cause the actual results, performance, or achievements of the company, its projects, or industry results, to be materially different from any future results, performance, or achievements expressed or implied by such forward-looking statements or information. Such statements can be identified using words such as "may", "would", "could", "will", "intend", "expect", "believe", "plan", "anticipate", "estimate", "scheduled", "forecast", "predict" and other similar terminology, or state that certain actions, events, or results "may", "could", "would", "might" or "will" be taken, occur or be achieved. These statements reflect the company's current expectations regarding future events, performance, and results and speak only as of the date of this release.
Such statements include, without limitation: (i) statements that at current copper prices, cash flow generated from Kamoa-Kakula's operations, as well as project level financing facilities, will be sufficient to fund the remaining capital cost requirements for the Phase 3 expansion; (ii) statements that completion of Africa's largest and greenest smelter will boost margins in 2025 and that Ivanhoe Mines is entering an era of exceptional free cash flow generation; (iii) statements that an exploration update is set for February 24, 2025 at the BMO Global Metals & Mining Conference; (iv) statements that Kamoa Copper continues to work closely with the DRC's state-owned power company, La Société Nationale d'Electricité (SNEL), to deliver solutions for the identified causes of instability experienced across the southern DRC's grid infrastructure and that the project work and is expected to be completed by the end of 2025; (v) statements that the project consists of grid infrastructure upgrades, such as an increase in grid capacity between the Inga II dam and Kolwezi, a new harmonic filter at the Inga Converter Station, as well as a new static compensator at the Kolwezi Converter Substation; (vi) statements that various smaller initiatives have been identified to strengthen the transmission capability and improve the long-term stability of the southern grid; (vii) statements that Ivanhoe Mines Energy is working with SNEL to put in place maintenance contracts to maintain key generation capacity and transmission infrastructure; (viii) statements that Kamoa-Kakula will continue to use more imported and back-up power sources; (ix) statements that Kamoa-Kakula s expected to receive an initial 70 MW of grid-supplied hydropower, increasing to the Turbine #5 nameplate capacity of 178 MW as the ongoing grid improvement initiatives are completed over the remainder of the year; (x) statements that refurbishment works of Turbine #5 at the Inga II hydroelectric facility is nearing completion, with wet commission expected to commence in the second half of 2025;(xi) statements that construction progress of underground mining infrastructure at the Kamoa 1, Kamoa 2, and Kansoko mines continues on schedule, where focus has moved to the second conveyor leg system where early commissioning is planned; (xi) statements that underground development at Kamoa 1 and 2 continues to focus on opening-up access to ore reserves well in advance of the mine plan; (xii) statements that that from Q2 2025, 20,000 to 30,000 tonnes of copper in concentrate produced by the Phase 3 concentrator would start to be stockpiled on-site in anticipation of the heat-up and ramp-up of the on-site smelter from Q2 2025 and that once fully-ramped up, the smelter is expected to maintain approximately 17,000 tones of copper within the circuit; (xiii) statements that the smelter furnace heat-up is expected to commence in Q2 2025; (xiv) statements that the smelter will have a processing capacity of approximately 1.2 Mtpa of dry concentrate feed and is designed to run on a blend of concentrate produced from the Kakula (Phase 1 and 2) and Kamoa (Phase 3 and future Phase 4) concentrators; (xv) statements that where possible Kamoa-Kakula will continue to toll-treat concentrates domestically, with surplus concentrates smelted at the nearby LCS, located approximately 50 kilometres from Kamoa-Kakula, near the town of Kolwezi; (xvi) statements that subject to sulphide content of the feed concentrate, as a by-product, the smelter will also produce 600,000 to 700,000 tonnes per year of high-strength sulphuric acid; (xvii) statements that the on-site smelter will offer transformative financial benefits for the Kamoa-Kakula Copper Complex, most significantly a material reduction in logistics costs, and to a lesser extent reduced concentrate treatment charges and local taxes, as well as revenue from acid sales; (xviii) statements that the volume of required trucks is expected to approximately halve following the smelter start-up; (xiv) statements that Kamoa Copper is in advanced discussions to sign a third offtake agreement for the remaining
Also, all of the results of the 4.1 Mtpa FS, the 10.7 Mtpa PEA, the Kamoa-Kakula 2023 IDP, the Platreef 2022 feasibility study, and the Kipushi 2022 feasibility study constitute forward-looking statements or information and include future estimates of internal rates of return, net present value, future production, estimates of cash cost, proposed mining plans and methods, mine life estimates, cash flow forecasts, metal recoveries, estimates of capital and operating costs and the size and timing of phased development of the projects.
Furthermore, concerning this specific forward-looking information concerning the operation and development of the Kamoa-Kakula Copper Complex, Platreef Project and Kipushi Mine, and the exploration of the Western Forelands Exploration Project, the Mokopane Feeder Exploration Project and the Chu-Sarya Basin Exploration JV, the company has based its assumptions and analysis on certain factors that are inherently uncertain. Uncertainties include: (i) the adequacy of infrastructure; (ii) geological characteristics; (iii) metallurgical characteristics of the mineralization; (iv) the ability to develop adequate processing capacity; (v) the price of copper, nickel, zinc, platinum, palladium, rhodium and gold; (vi) the availability of equipment and facilities necessary to complete development and exploration; (vii) the cost of consumables and mining and processing equipment; (viii) unforeseen technological and engineering problems; (ix) accidents or acts of sabotage or terrorism; (x) currency fluctuations; (xi) changes in regulations; (xii) the compliance by joint venture partners with terms of agreements; (xiii) the availability and productivity of skilled labour; (xiv) the regulation of the mining industry by various governmental agencies; (xv) the ability to raise sufficient capital to develop such projects; (xvi) changes in project scope or design; (xvii) recoveries, mining rates and grade; (xviii) political factors; (xviii) water inflow into the mine and its potential effect on mining operations; and (xix) the consistency and availability of electric power.
Forward-looking statements and information involve significant risks and uncertainties, should not be read as guarantees of future performance or results, and will not necessarily be accurate indicators of whether such results will be achieved. Many factors could cause actual results to differ materially from the results discussed in the forward-looking statements or information, including, however not limited to, the factors discussed above and under the "Risk Factors" heading in the company's MD&A for the fiscal year ended December 31, 2024, in the company's current annual information form, and elsewhere in this release, as well as unexpected changes in laws, rules or regulations, or their enforcement by applicable authorities; the failure of parties to contracts with the company to perform as agreed; social or labour unrest; changes in commodity prices; and the failure of exploration programs or studies to deliver anticipated results or results that would justify and support continued exploration, studies, development or operations.
Although the forward-looking statements contained in this release are based upon what management of the company believes are reasonable assumptions, the company cannot assure investors that actual results will be consistent with these forward-looking statements. These forward-looking statements are made as of the date of this release and are expressly qualified in their entirety by this cautionary statement. Subject to applicable securities laws, the company does not assume any obligation to update or revise the forward-looking statements contained herein to reflect events or circumstances occurring after the date of this release.
The company's actual results could differ materially from those anticipated in these forward-looking statements as a result of the factors outlined in the "Risk Factors" section in the company's MD&A for the fiscal year ended December 31, 2024, in the company's current annual information and elsewhere in this release.
To view the source version of this press release, please visit https://www.newsfilecorp.com/release/241566