Health Catalyst Reports Fourth Quarter and Year End 2024 Results
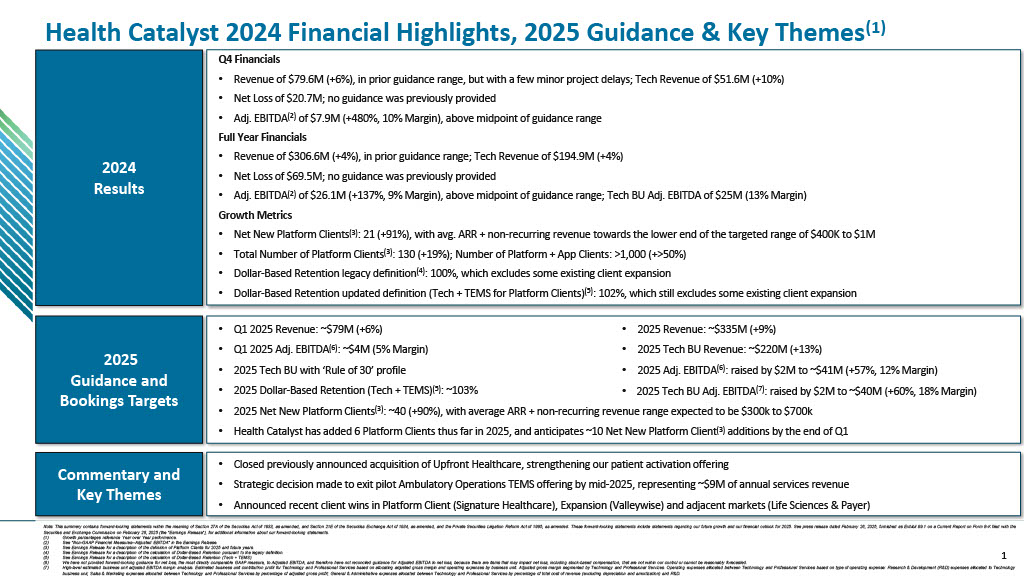
Health Catalyst (HCAT) reported strong financial results for Q4 and full-year 2024, achieving total revenue of $307 million and Adjusted EBITDA of $26 million for 2024. The Technology segment showed notable performance with revenue of $195 million for full-year 2024 and $52 million for Q4 2024, representing 10% year-over-year growth.
The company provided guidance for 2025, projecting total revenue of approximately $335 million, Technology revenue of $220 million, and raised their Adjusted EBITDA target by $2 million to $41 million. For Q1 2025, they expect revenue of approximately $79 million and Adjusted EBITDA of $4 million.
The company announced governance updates, including the appointment of Dr. Jill Hoggard Green to the Board of Directors and the promotion of Dr. Daniel Samarov to Chief AI Officer.
Health Catalyst (HCAT) ha riportato risultati finanziari solidi per il quarto trimestre e per l'intero anno 2024, raggiungendo un fatturato totale di 307 milioni di dollari e un EBITDA rettificato di 26 milioni di dollari per il 2024. Il segmento Tecnologia ha mostrato una performance notevole con un fatturato di 195 milioni di dollari per l'intero anno 2024 e 52 milioni di dollari per il quarto trimestre 2024, rappresentando una crescita del 10% rispetto all'anno precedente.
L'azienda ha fornito indicazioni per il 2025, prevedendo un fatturato totale di circa 335 milioni di dollari, un fatturato tecnologico di 220 milioni di dollari e ha aumentato il target di EBITDA rettificato di 2 milioni di dollari a 41 milioni di dollari. Per il primo trimestre 2025, si aspettano un fatturato di circa 79 milioni di dollari e un EBITDA rettificato di 4 milioni di dollari.
L'azienda ha annunciato aggiornamenti sulla governance, inclusa la nomina della Dr.ssa Jill Hoggard Green nel Consiglio di Amministrazione e la promozione del Dr. Daniel Samarov a Chief AI Officer.
Health Catalyst (HCAT) reportó resultados financieros sólidos para el cuarto trimestre y el año completo 2024, alcanzando ingresos totales de 307 millones de dólares y un EBITDA ajustado de 26 millones de dólares para 2024. El segmento de Tecnología mostró un rendimiento notable con ingresos de 195 millones de dólares para el año completo 2024 y 52 millones de dólares para el cuarto trimestre de 2024, representando un crecimiento del 10% en comparación con el año anterior.
La empresa proporcionó orientación para 2025, proyectando ingresos totales de aproximadamente 335 millones de dólares, ingresos por Tecnología de 220 millones de dólares, y aumentó su objetivo de EBITDA ajustado en 2 millones de dólares a 41 millones de dólares. Para el primer trimestre de 2025, esperan ingresos de aproximadamente 79 millones de dólares y un EBITDA ajustado de 4 millones de dólares.
La empresa anunció actualizaciones de gobernanza, incluida la designación de la Dra. Jill Hoggard Green en la Junta Directiva y la promoción del Dr. Daniel Samarov a Director de IA.
헬스 캐털리스트 (HCAT)는 2024년 4분기 및 전체 연도에 대한 강력한 재무 결과를 보고하며, 총 수익 3억 7천만 달러와 조정 EBITDA 2천6백만 달러를 달성했습니다. 기술 부문은 2024년 전체 연도에 1억 9천5백만 달러의 수익을 올렸고, 2024년 4분기에는 5천2백만 달러를 기록하여 전년 대비 10% 성장했습니다.
회사는 2025년을 위한 가이던스를 제공하며, 총 수익을 약 3억 3천5백만 달러, 기술 수익을 2억 2천만 달러로 예상하고, 조정 EBITDA 목표를 200만 달러 올려 4천1백만 달러로 설정했습니다. 2025년 1분기에는 약 7천9백만 달러의 수익과 400만 달러의 조정 EBITDA를 예상하고 있습니다.
회사는 거버넌스 업데이트를 발표하며, 닥터 질 호가드 그린을 이사회에 임명하고, 닥터 다니엘 사마로프를 최고 AI 책임자로 승진시켰습니다.
Health Catalyst (HCAT) a annoncé de solides résultats financiers pour le quatrième trimestre et l'année complète 2024, atteignant un chiffre d'affaires total de 307 millions de dollars et un EBITDA ajusté de 26 millions de dollars pour 2024. Le segment Technologie a montré une performance remarquable avec un chiffre d'affaires de 195 millions de dollars pour l'année complète 2024 et 52 millions de dollars pour le quatrième trimestre 2024, représentant une croissance de 10 % par rapport à l'année précédente.
L'entreprise a fourni des prévisions pour 2025, projetant un chiffre d'affaires total d'environ 335 millions de dollars, un chiffre d'affaires technologique de 220 millions de dollars, et a relevé son objectif d'EBITDA ajusté de 2 millions de dollars à 41 millions de dollars. Pour le premier trimestre 2025, ils s'attendent à un chiffre d'affaires d'environ 79 millions de dollars et un EBITDA ajusté de 4 millions de dollars.
L'entreprise a annoncé des mises à jour de gouvernance, y compris la nomination de Dr. Jill Hoggard Green au Conseil d'administration et la promotion de Dr. Daniel Samarov au poste de Chief AI Officer.
Health Catalyst (HCAT) hat starke finanzielle Ergebnisse für das vierte Quartal und das Gesamtjahr 2024 gemeldet, mit einem Gesamtumsatz von 307 Millionen Dollar und einem bereinigten EBITDA von 26 Millionen Dollar für 2024. Der Technologiesektor zeigte eine bemerkenswerte Leistung mit einem Umsatz von 195 Millionen Dollar für das Gesamtjahr 2024 und 52 Millionen Dollar für das vierte Quartal 2024, was einem Wachstum von 10% im Vergleich zum Vorjahr entspricht.
Das Unternehmen gab eine Prognose für 2025 ab und erwartet einen Gesamtumsatz von etwa 335 Millionen Dollar, einen Technologieumsatz von 220 Millionen Dollar und erhöhte sein Ziel für das bereinigte EBITDA um 2 Millionen Dollar auf 41 Millionen Dollar. Für das erste Quartal 2025 erwarten sie einen Umsatz von etwa 79 Millionen Dollar und ein bereinigtes EBITDA von 4 Millionen Dollar.
Das Unternehmen gab Governance-Updates bekannt, einschließlich der Ernennung von Dr. Jill Hoggard Green in den Vorstand und der Beförderung von Dr. Daniel Samarov zum Chief AI Officer.
- Technology segment revenue grew 10% YoY in Q4 2024
- Full-year 2024 revenue reached $307M
- Adjusted EBITDA of $26M for 2024
- Raised 2025 Adjusted EBITDA target by $2M to $41M
- Projected revenue growth to $335M for 2025
- None.
Insights
Health Catalyst's Q4 and full-year 2024 results reveal a company in transition toward improved profitability and accelerated growth. The $307 million in annual revenue coupled with
The Technology segment's
The redefinition of Platform Clients metric is strategically important and reveals how Health Catalyst is evolving its business model. By setting a
The appointment of a Chief AI Officer signals Health Catalyst's strategic pivot toward AI integration in healthcare analytics – a critical move as healthcare systems increasingly demand predictive capabilities and workflow automation. This positions the company to potentially capture higher-value contracts in a competitive landscape where AI differentiation is becoming essential.
While the guided
SALT LAKE CITY, Feb. 26, 2025 (GLOBE NEWSWIRE) -- Health Catalyst, Inc. ("Health Catalyst," Nasdaq: HCAT), a leading provider of data and analytics technology and services to healthcare organizations, today reported financial results for the quarter and year ended December 31, 2024.
“For the full year 2024, I am pleased to share that we achieved strong performance across our business, including total revenue of
"As part of our annual planning process, we’re grateful to share a few governance and leadership updates. First, we are thrilled to welcome Dr. Jill Hoggard Green to the Health Catalyst Board of Directors as of December 1, 2024. Jill is the former Chief Executive Officer of The Queens Health System and has been an extraordinary leader throughout her career. We are excited for Jill to be a member of our Board. Next, we wanted to take a moment to thank Anita Pramoda for her dedicated service as a member of our Board. After nearly a decade, she will complete her service on March 1, 2025. We are deeply grateful for her meaningful contributions. Finally, I’m excited to announce recent promotions to our leadership team. Dr. Daniel Samarov has been promoted to Chief AI Officer. In addition, Allie Coronis, Senior Vice President of Tech-Enabled Managed Services, and Dan Heinmiller, Senior Vice President of Implementation Services, have been appointed to our company-wide leadership team. We’re looking forward to the meaningful impact these leaders will have in their new roles."
Financial Highlights for the Three and Twelve Months Ended December 31, 2024
Key Financial Measures
| Three Months Ended December 31, | Year over Year Change | Twelve Months Ended December 31, | Year over Year Change | ||||||||||||||||||||||
| 2024 | 2023 | 2024 | 2023 | ||||||||||||||||||||||
| GAAP Financial Measures: | (in thousands, except percentages) | (in thousands, except percentages) | |||||||||||||||||||||||
| Revenue | $ | 79,606 | $ | 75,084 | $ | 306,584 | $ | 295,938 | |||||||||||||||||
| Gross profit | $ | 28,618 | $ | 23,902 | $ | 114,503 | $ | 104,002 | |||||||||||||||||
| Gross margin | 36 | % | 32 | % | 37 | % | 35 | % | |||||||||||||||||
| Net loss | $ | (20,673 | ) | $ | (30,312 | ) | $ | (69,502 | ) | $ | (118,147 | ) | |||||||||||||
| Non-GAAP Financial Measures:(1) | |||||||||||||||||||||||||
| Adjusted Gross Profit | $ | 37,121 | $ | 34,693 | $ | 149,533 | $ | 144,060 | |||||||||||||||||
| Adjusted Gross Margin | 47 | % | 46 | % | 49 | % | 49 | % | |||||||||||||||||
| Adjusted EBITDA | $ | 7,911 | $ | 1,352 | $ | 26,105 | $ | 11,021 | |||||||||||||||||
________________________
(1) These measures are not calculated in accordance with generally accepted accounting principles in the United States (GAAP). See the accompanying "Non-GAAP Financial Measures" section below for more information about these financial measures, including the limitations of such measures, and for a reconciliation of each measure to the most directly comparable measure calculated in accordance with GAAP.
Other Key Metrics
| As of December 31, | ||||||||
| 2024 | 2023 | 2022 | ||||||
| Platform Clients(1) | 130 | 109 | 98 | |||||
| Year Ended December 31, | ||||||||
| 2024 | 2023 | 2022 | ||||||
| Dollar-based Retention Rate (legacy)(2) | 100 | % | 100 | % | 100 | % | ||
| Dollar-based Retention Rate (Tech + TEMS)(3) | 102 | % | ||||||
__________________
(1) We have updated the name and definition of this key metric to Platform Clients from DOS Subscription Clients to better reflect the deep, long-standing, multi-faceted relationships we strive to build with the entities we serve. Platform Clients have historically been defined as clients who directly or indirectly access our platform via a technology subscription contract. Direct access to our platform has included access to our DOS platform, Ignite platform, or Ninja Universe. Indirect access to our platform has included platform module components such as Ignite connectors, Healthcare.AI, Pop Analyzer, IDEA, and other platform components. Given the modularity of our Ignite platform, we anticipate Ignite infrastructure will be included in all of our technology Solutions in the near future and many of our Solutions already include Ignite components. Accordingly, beginning in 2025, Platform Clients will be defined as: (i) all Platform Clients as of December 31, 2024 under our historical definition (i.e., these clients will be included in our Platform Client count going forward until they cease to have an active subscription as of the end of the period), and (ii) going forward in 2025 and beyond, any technology client that signs contracts with at least
(2) Dollar-based Retention Rate (legacy) is calculated as of a period end by starting with the sum of the technology and professional services ARR from our Platform Clients as of the date 12 months prior to such period end and then calculating the sum of the ARR from these same clients as of the current period end. Please see our Annual Report on Form 10-K for the year ended December 31, 2024 expected to be filed with the SEC on or about February 26, 2025 for additional information.
(3) Dollar-based Retention Rate (Tech + TEMS) is calculated as of a period end by starting with the sum of the technology ARR and Tech-Enabled Managed Services (TEMS) ARR from our Platform Clients as of the date 12 months prior to such period end (this calculation excludes professional services ARR and non-recurring revenue), calculating the sum of the ARR from these same clients as of the current period end (which includes any upsells and also reflects contraction or attrition over the trailing twelve months but excludes revenue from new Platform Clients added in the current period who were not clients at the beginning of such period; this current period ARR may include acquired ARR from clients that overlap with the Platform Clients in a given calendar year), and then dividing the current period ARR by the prior period ARR. Please see our Annual Report on Form 10-K for the year ended December 31, 2024 expected to be filed with the SEC on or about February 26, 2025 for additional information.
Financial Outlook
Health Catalyst provides forward-looking guidance on total revenue, a GAAP measure, and Adjusted EBITDA, a non-GAAP measure.
For the first quarter of 2025, we expect:
- Total revenue of approximately
$79 million , and
- Adjusted EBITDA of approximately
$4 million
For the full year of 2025, we expect:
- Total revenue of approximately
$335 million , - Technology revenue of approximately
$220 million , and
- Adjusted EBITDA of approximately
$41 million
We have not reconciled guidance for Adjusted EBITDA to net loss, the most directly comparable GAAP measure, and have not provided forward-looking guidance for net loss, because there are items that may impact net loss, including stock-based compensation, that are not within our control or cannot be reasonably forecasted.
Quarterly Conference Call Details
We will host a conference call to review the results today, Wednesday, February 26, 2025, at 5:00 p.m. E.T. The conference call can be accessed by dialing (800) 343-5172 for U.S. participants, or (203) 518-9856 for international participants, and referencing conference ID “HCATQ424.” A live audio webcast will be available online at https://ir.healthcatalyst.com/. A replay of the call will be available via webcast for on-demand listening shortly after the completion of the call, at the same web link, and will remain available for approximately 90 days.
About Health Catalyst
Health Catalyst (Nasdaq: HCAT) is a leading provider of data and analytics technology and services that ignite smarter healthcare, lighting the path to measurable clinical, financial, and operational improvement. More than 1,000 organizations worldwide rely on Health Catalyst's offerings, including our cloud-based technology ecosystem Health Catalyst Ignite™, AI-enabled data and analytics solutions, and expert services to drive meaningful outcomes across hundreds of millions of patient records. Powered by high-value data, standardized measures and registries, and deep healthcare domain expertise, Ignite helps organizations transform complex information into actionable insights. Backed by a multi-decade mission and a proven track record of delivering billions of dollars in measurable results, Health Catalyst continues to serve as the catalyst for massive, measurable, data-informed healthcare improvement and innovation.
Available Information
Our investors and others should note that we announce material information to the public about our company, products and services, and other matters related to our company through a variety of means, including our website (https://www.healthcatalyst.com/), our investor relations website (https://ir.healthcatalyst.com/), press releases, SEC filings, public conference calls, and social media, including our and our CEO's social media accounts (including on LinkedIn), in order to achieve broad, non-exclusionary distribution of information to the public and to comply with our disclosure obligations under Regulation FD.
Forward-Looking Statements
This release contains forward-looking statements within the meaning of Section 27A of the Securities Act of 1933, as amended, and Section 21E of the Securities Exchange Act of 1934, as amended, and the Private Securities Litigation Reform Act of 1995, as amended. These forward-looking statements include statements regarding our future growth and our financial outlook for Q1 and fiscal year 2025. Forward-looking statements are subject to risks and uncertainties and are based on potentially inaccurate assumptions that could cause actual results to differ materially from those expected or implied by the forward-looking statements. Actual results may differ materially from the results predicted, and reported results should not be considered as an indication of future performance.
Important risks and uncertainties that could cause our actual results and financial condition to differ materially from those indicated in the forward-looking statements include, among others, the following: (i) changes in laws and regulations applicable to our business model; (ii) changes in market or industry conditions, regulatory environment, and receptivity to our technology and services; (iii) results of litigation or a security incident; (iv) the loss of one or more key clients or partners; (v) macroeconomic challenges (including high inflationary and/or high interest rate environments, or market volatility caused by bank failures and measures taken in response thereto) and any new public health crisis; and (vi) changes to our abilities to recruit and retain qualified team members. For a detailed discussion of the risk factors that could affect our actual results, please refer to the risk factors identified in our SEC reports, including, but not limited to the Quarterly Report on Form 10-Q for the fiscal quarter ended September 30, 2024 that was filed with the SEC on November 7, 2024 and the Annual Report on Form 10-K for the year ended December 31, 2024 expected to be filed with the SEC on or about February 26, 2025. All information provided in this release and in the attachments is as of the date hereof, and we undertake no duty to update or revise this information unless required by law.
| Consolidated Balance Sheets (in thousands, except share and per share data) | |||||||
| As of December 31, | |||||||
| 2024 | 2023 | ||||||
| Assets | |||||||
| Current assets: | |||||||
| Cash and cash equivalents | $ | 249,645 | $ | 106,276 | |||
| Short-term investments | 142,355 | 211,452 | |||||
| Accounts receivable, net | 57,182 | 60,290 | |||||
| Prepaid expenses and other assets | 16,468 | 15,379 | |||||
| Total current assets | 465,650 | 393,397 | |||||
| Property and equipment, net | 29,394 | 25,712 | |||||
| Intangible assets, net | 86,052 | 73,384 | |||||
| Operating lease right-of-use assets | 12,058 | 13,927 | |||||
| Goodwill | 259,759 | 190,652 | |||||
| Other assets | 6,016 | 4,742 | |||||
| Total assets | $ | 858,929 | $ | 701,814 | |||
| Liabilities and stockholders’ equity | |||||||
| Current liabilities: | |||||||
| Accounts payable | $ | 11,433 | $ | 6,641 | |||
| Accrued liabilities | 26,340 | 23,282 | |||||
| Deferred revenue(1) | 53,281 | 55,753 | |||||
| Operating lease liabilities | 3,614 | 3,358 | |||||
| Current portion of long-term debt | 231,182 | — | |||||
| Total current liabilities | 325,850 | 89,034 | |||||
| Long-term debt, net of current portion | 151,178 | 228,034 | |||||
| Deferred revenue, net of current portion | 249 | 77 | |||||
| Operating lease liabilities, net of current portion | 16,291 | 17,676 | |||||
| Other liabilities | 154 | 74 | |||||
| Total liabilities | 493,722 | 334,895 | |||||
| Stockholders’ equity: | |||||||
| Preferred stock, | — | — | |||||
| Common stock, | 1,552,714 | 1,484,056 | |||||
| Accumulated deficit | (1,186,672 | ) | (1,117,170 | ) | |||
| Accumulated other comprehensive (loss) income | (835 | ) | 33 | ||||
| Total stockholders’ equity | 365,207 | 366,919 | |||||
| Total liabilities and stockholders’ equity | $ | 858,929 | $ | 701,814 | |||
| Consolidated Statements of Operations (in thousands, except per share data, unaudited) | |||||||||||||||
| Three Months Ended December 31, | Twelve Months Ended December 31, | ||||||||||||||
| 2024 | 2023 | 2024 | 2023 | ||||||||||||
| Revenue: | |||||||||||||||
| Technology | $ | 51,598 | $ | 47,100 | $ | 194,852 | $ | 187,583 | |||||||
| Professional services | 28,008 | 27,984 | 111,732 | 108,355 | |||||||||||
| Total revenue | 79,606 | 75,084 | 306,584 | 295,938 | |||||||||||
| Cost of revenue, excluding depreciation and amortization: | |||||||||||||||
| Technology(1)(2)(3) | 18,821 | 16,719 | 67,812 | 62,474 | |||||||||||
| Professional services(1)(2)(3) | 26,094 | 27,857 | 97,993 | 101,631 | |||||||||||
| Total cost of revenue, excluding depreciation and amortization | 44,915 | 44,576 | 165,805 | 164,105 | |||||||||||
| Operating expenses: | |||||||||||||||
| Sales and marketing(1)(2)(3) | 11,242 | 17,271 | 54,387 | 67,321 | |||||||||||
| Research and development(1)(2)(3) | 15,002 | 20,288 | 57,950 | 72,627 | |||||||||||
| General and administrative(1)(2)(3)(4)(5) | 15,681 | 15,430 | 56,817 | 76,559 | |||||||||||
| Depreciation and amortization | 10,266 | 10,304 | 41,431 | 42,223 | |||||||||||
| Total operating expenses | 52,191 | 63,293 | 210,585 | 258,730 | |||||||||||
| Loss from operations | (17,500 | ) | (32,785 | ) | (69,806 | ) | (126,897 | ) | |||||||
| Interest and other expense, net | (2,548 | ) | 2,616 | 637 | 9,106 | ||||||||||
| Loss before income taxes | (20,048 | ) | (30,169 | ) | (69,169 | ) | (117,791 | ) | |||||||
| Income tax provision | 625 | 143 | 333 | 356 | |||||||||||
| Net loss | $ | (20,673 | ) | $ | (30,312 | ) | $ | (69,502 | ) | $ | (118,147 | ) | |||
| Net loss per share, basic | $ | (0.33 | ) | $ | (0.53 | ) | $ | (1.15 | ) | $ | (2.09 | ) | |||
| Net loss per share, diluted | $ | (0.33 | ) | $ | (0.53 | ) | $ | (1.15 | ) | $ | (2.09 | ) | |||
| Weighted-average shares outstanding used in calculating net loss per share, basic | 62,377 | 57,476 | 60,185 | 56,418 | |||||||||||
| Weighted-average shares outstanding used in calculating net loss per share, diluted | 62,377 | 57,476 | 60,185 | 56,418 | |||||||||||
_______________
(1) Includes stock-based compensation expense as follows:
| Three Months Ended December 31, | Twelve Months Ended December 31, | ||||||||||
| 2024 | 2023 | 2024 | 2023 | ||||||||
| Stock-Based Compensation Expense: | (in thousands) | (in thousands) | |||||||||
| Cost of revenue, excluding depreciation and amortization: | |||||||||||
| Technology | $ | 494 | $ | 458 | $ | 1,700 | $ | 1,866 | |||
| Professional services | 1,759 | 1,687 | 6,041 | 7,369 | |||||||
| Sales and marketing | 3,123 | 4,933 | 12,120 | 20,982 | |||||||
| Research and development | 2,305 | 2,536 | 7,696 | 11,213 | |||||||
| General and administrative | 3,131 | 3,397 | 12,571 | 14,326 | |||||||
| Total | $ | 10,812 | $ | 13,011 | $ | 40,128 | $ | 55,756 | |||
(2) Includes acquisition-related costs, net as follows:
| Three Months Ended December 31, | Twelve Months Ended December 31, | ||||||||||
| 2024 | 2023 | 2024 | 2023 | ||||||||
| Acquisition-related costs, net: | (in thousands) | (in thousands) | |||||||||
| Cost of revenue, excluding depreciation and amortization: | |||||||||||
| Technology | $ | 74 | $ | 65 | $ | 320 | $ | 273 | |||
| Professional services | 103 | 93 | 433 | 391 | |||||||
| Sales and marketing | 53 | 393 | 791 | 697 | |||||||
| Research and development | 91 | 200 | 703 | 787 | |||||||
| General and administrative | 4,012 | 1,904 | 7,817 | 3,609 | |||||||
| Total | $ | 4,333 | $ | 2,655 | $ | 10,064 | $ | 5,757 | |||
(3) Includes restructuring costs, as follows:
| Three Months Ended December 31, | Twelve Months Ended December 31, | ||||||||||
| 2024 | 2023 | 2024 | 2023 | ||||||||
| Restructuring costs: | (in thousands) | (in thousands) | |||||||||
| Cost of revenue, excluding depreciation and amortization: | |||||||||||
| Technology | $ | — | $ | 484 | $ | 79 | $ | 496 | |||
| Professional services | — | 1,398 | 181 | 1,832 | |||||||
| Sales and marketing | — | 1,210 | 449 | 2,415 | |||||||
| Research and development | — | 3,051 | 443 | 3,337 | |||||||
| General and administrative | — | 624 | 936 | 742 | |||||||
| Total | $ | — | $ | 6,767 | $ | 2,088 | $ | 8,822 | |||
(4) Includes litigation costs, as follows:
| Three Months Ended December 31, | Twelve Months Ended December 31, | ||||||||||
| 2024 | 2023 | 2024 | 2023 | ||||||||
| Litigation costs: | (in thousands) | (in thousands) | |||||||||
| General and administrative | $ | — | $ | — | $ | — | $ | 21,279 | |||
(5) Includes non-recurring lease-related charges, as follows:
| Three Months Ended December 31, | Twelve Months Ended December 31, | ||||||||||
| 2024 | 2023 | 2024 | 2023 | ||||||||
| Non-recurring lease-related charges: | (in thousands) | (in thousands) | |||||||||
| General and administrative | $ | — | $ | 1,400 | $ | 2,200 | $ | 4,081 | |||
| Consolidated Statements of Cash Flows | |||||||
| (in thousands) | |||||||
| Year Ended December 31, | |||||||
| 2024 | 2023 | ||||||
| Cash flows from operating activities | |||||||
| Net loss | $ | (69,502 | ) | $ | (118,147 | ) | |
| Adjustments to reconcile net loss to net cash provided by (used in) operating activities: | |||||||
| Stock-based compensation expense | 40,128 | 55,756 | |||||
| Depreciation and amortization | 41,431 | 42,223 | |||||
| Investment discount and premium accretion | (4,757 | ) | (9,720 | ) | |||
| Impairment of long-lived assets | 2,200 | 4,081 | |||||
| Non-cash operating lease expense | 2,685 | 2,990 | |||||
| Provision for expected credit losses | 1,202 | 1,821 | |||||
| Amortization of debt discount, issuance costs, and deferred financing costs | 3,256 | 1,511 | |||||
| Deferred tax provision (benefit) | 77 | 8 | |||||
| Change in fair value of contingent consideration liabilities | (1,642 | ) | — | ||||
| Other | 141 | 67 | |||||
| Change in operating assets and liabilities: | |||||||
| Accounts receivable, net | 4,281 | (13,663 | ) | ||||
| Prepaid expenses and other assets | (50 | ) | 164 | ||||
| Accounts payable, accrued liabilities, and other liabilities | 5,581 | 4,868 | |||||
| Deferred revenue | (7,012 | ) | (1,487 | ) | |||
| Operating lease liabilities | (3,460 | ) | (3,552 | ) | |||
| Net cash provided by (used in) operating activities | 14,559 | (33,080 | ) | ||||
| Cash flows from investing activities | |||||||
| Proceeds from the sale and maturity of short-term investments | 242,067 | 336,801 | |||||
| Purchases of short-term investments | (168,307 | ) | (290,836 | ) | |||
| Capitalization of internal-use software | (14,274 | ) | (11,957 | ) | |||
| Acquisition of businesses, net of cash acquired | (80,277 | ) | (11,392 | ) | |||
| Purchases of property and equipment | (1,616 | ) | (1,236 | ) | |||
| Purchases of intangible assets | (508 | ) | (1,118 | ) | |||
| Proceeds from the sale of property and equipment | 13 | 31 | |||||
| Net cash provided by (used in) investing activities | (22,902 | ) | 20,293 | ||||
| Cash flows from financing activities | |||||||
| Proceeds from issuance of long-term debt, net of issuance costs | 152,277 | — | |||||
| Payment of deferred financing costs | (2,152 | ) | — | ||||
| Repayment of debt | (959 | ) | — | ||||
| Proceeds from employee stock purchase plan | 2,411 | 3,588 | |||||
| Proceeds from exercise of stock options | 169 | 950 | |||||
| Repurchase of common stock | — | (1,808 | ) | ||||
| Net cash provided by (used in) financing activities | 151,746 | 2,730 | |||||
| Effect of exchange rate changes on cash and cash equivalents | (34 | ) | 21 | ||||
| Net increase (decrease) in cash and cash equivalents | 143,369 | (10,036 | ) | ||||
| Cash and cash equivalents at beginning of period | 106,276 | 116,312 | |||||
| Cash and cash equivalents at end of period | $ | 249,645 | $ | 106,276 | |||
Non-GAAP Financial Measures
To supplement our financial information presented in accordance with GAAP, we believe certain non-GAAP financial measures, including Adjusted Gross Profit, Adjusted Gross Margin, Adjusted EBITDA, Adjusted Net Income, and Adjusted Net Income per share, basic and diluted, are useful in evaluating our operating performance. For example, we exclude stock-based compensation expense because it is non-cash in nature and excluding this expense provides meaningful supplemental information regarding our operational performance and allows investors the ability to make more meaningful comparisons between our operating results and those of other companies. We use this non-GAAP financial information to evaluate our ongoing operations, as a component in determining employee bonus compensation, and for internal planning and forecasting purposes.
We believe that non-GAAP financial information, when taken collectively, may be helpful to investors because it provides consistency and comparability with past financial performance. However, non-GAAP financial information is presented for supplemental informational purposes only, has limitations as an analytical tool and should not be considered in isolation or as a substitute for financial information presented in accordance with GAAP. In addition, other companies, including companies in our industry, may calculate similarly-titled non-GAAP financial measures differently or may use other measures to evaluate their performance. A reconciliation is provided below for each non-GAAP financial measure to the most directly comparable financial measure stated in accordance with GAAP. Investors are encouraged to review the related GAAP financial measures and the reconciliation of these non-GAAP financial measures to their most directly comparable GAAP financial measures, and not to rely on any single financial measure to evaluate our business.
Adjusted Gross Profit and Adjusted Gross Margin
Adjusted Gross Profit is a non-GAAP financial measure that we define as revenue less cost of revenue, excluding depreciation and amortization, adding back stock-based compensation, acquisition-related costs, net, and restructuring costs as applicable. We define Adjusted Gross Margin as our Adjusted Gross Profit divided by our revenue. We believe Adjusted Gross Profit and Adjusted Gross Margin are useful to investors as they eliminate the impact of certain non-cash expenses and certain other non-recurring operating expenses, and allow a direct comparison of these measures between periods without the impact of non-cash expenses and certain other non-recurring operating expenses.
The following is a reconciliation of our Adjusted Gross Profit and Adjusted Gross Margin, in total and for technology and professional services, to gross profit and gross margin, the most directly comparable financial measures calculated in accordance with GAAP, for the three and twelve months ended December 31, 2024 and 2023:
| Three Months Ended December 31, 2024 | |||||||||||
| (in thousands, except percentages) | |||||||||||
| Technology | Professional Services | Total | |||||||||
| Revenue | $ | 51,598 | $ | 28,008 | $ | 79,606 | |||||
| Cost of revenue, excluding depreciation and amortization | (18,821 | ) | (26,094 | ) | (44,915 | ) | |||||
| Amortization of intangible assets, cost of revenue | (3,455 | ) | — | (3,455 | ) | ||||||
| Depreciation of property and equipment, cost of revenue | (2,618 | ) | — | (2,618 | ) | ||||||
| Gross profit | 26,704 | 1,914 | 28,618 | ||||||||
| Gross margin | 52 | % | 7 | % | 36 | % | |||||
| Add: | |||||||||||
| Amortization of intangible assets, cost of revenue | 3,455 | — | 3,455 | ||||||||
| Depreciation of property and equipment, cost of revenue | 2,618 | — | 2,618 | ||||||||
| Stock-based compensation | 494 | 1,759 | 2,253 | ||||||||
| Acquisition-related costs, net(1) | 74 | 103 | 177 | ||||||||
| Adjusted Gross Profit | $ | 33,345 | $ | 3,776 | $ | 37,121 | |||||
| Adjusted Gross Margin | 65 | % | 13 | % | 47 | % | |||||
__________________
(1) Acquisition-related costs, net include deferred retention expenses attributable to the Lumeon, Carevive, ARMUS, and KPI Ninja acquisitions.
| Three Months Ended December 31, 2023 | |||||||||||
| (in thousands, except percentages) | |||||||||||
| Technology | Professional Services | Total | |||||||||
| Revenue | $ | 47,100 | $ | 27,984 | $ | 75,084 | |||||
| Cost of revenue, excluding depreciation and amortization | (16,719 | ) | (27,857 | ) | (44,576 | ) | |||||
| Amortization of intangible assets, cost of revenue | (4,370 | ) | — | (4,370 | ) | ||||||
| Depreciation of property and equipment, cost of revenue | (2,236 | ) | — | (2,236 | ) | ||||||
| Gross profit | 23,775 | 127 | 23,902 | ||||||||
| Gross margin | 50 | % | — | % | 32 | % | |||||
| Add: | |||||||||||
| Amortization of intangible assets, cost of revenue | 4,370 | — | 4,370 | ||||||||
| Depreciation of property and equipment, cost of revenue | 2,236 | — | 2,236 | ||||||||
| Stock-based compensation | 458 | 1,687 | 2,145 | ||||||||
| Acquisition-related costs, net(1) | 65 | 93 | 158 | ||||||||
| Restructuring costs(2) | 484 | 1,398 | 1,882 | ||||||||
| Adjusted Gross Profit | $ | 31,388 | $ | 3,305 | $ | 34,693 | |||||
| Adjusted Gross Margin | 67 | % | 12 | % | 46 | % | |||||
___________________
(1) Acquisition-related costs, net include deferred retention expenses following the ARMUS and KPI Ninja acquisitions.
(2) Restructuring costs include severance and other team member costs from workforce reductions.
| Twelve Months Ended December 31, 2024 | |||||||||||
| (in thousands, except percentages) | |||||||||||
| Technology | Professional Services | Total | |||||||||
| Revenue | $ | 194,852 | $ | 111,732 | $ | 306,584 | |||||
| Cost of revenue, excluding depreciation and amortization | (67,812 | ) | (97,993 | ) | (165,805 | ) | |||||
| Amortization of intangible assets, cost of revenue | (16,150 | ) | — | (16,150 | ) | ||||||
| Depreciation of property and equipment, cost of revenue | (10,126 | ) | — | (10,126 | ) | ||||||
| Gross profit | 100,764 | 13,739 | 114,503 | ||||||||
| Gross margin | 52 | % | 12 | % | 37 | % | |||||
| Add: | |||||||||||
| Amortization of intangible assets, cost of revenue | 16,150 | — | 16,150 | ||||||||
| Depreciation of property and equipment, cost of revenue | 10,126 | — | 10,126 | ||||||||
| Stock-based compensation | 1,700 | 6,041 | 7,741 | ||||||||
| Acquisition-related costs, net(1) | 320 | 433 | 753 | ||||||||
| Restructuring costs(2) | 79 | 181 | 260 | ||||||||
| Adjusted Gross Profit | $ | 129,139 | $ | 20,394 | $ | 149,533 | |||||
| Adjusted Gross Margin | 66 | % | 18 | % | 49 | % | |||||
__________________
(1) Acquisition-related costs, net include deferred retention expenses attributable to the Lumeon, Carevive, ARMUS, and KPI Ninja acquisitions.
(2) Restructuring costs include severance and other team member costs from workforce reductions.
| Twelve Months Ended December 31, 2023 | |||||||||||
| (in thousands, except percentages) | |||||||||||
| Technology | Professional Services | Total | |||||||||
| Revenue | $ | 187,583 | $ | 108,355 | $ | 295,938 | |||||
| Cost of revenue, excluding depreciation and amortization | (62,474 | ) | (101,631 | ) | (164,105 | ) | |||||
| Amortization of intangible assets, cost of revenue | (18,742 | ) | — | (18,742 | ) | ||||||
| Depreciation of property and equipment, cost of revenue | (9,089 | ) | — | (9,089 | ) | ||||||
| Gross profit | 97,278 | 6,724 | 104,002 | ||||||||
| Gross margin | 52 | % | 6 | % | 35 | % | |||||
| Add: | |||||||||||
| Amortization of intangible assets, cost of revenue | 18,742 | — | 18,742 | ||||||||
| Depreciation of property and equipment, cost of revenue | 9,089 | — | 9,089 | ||||||||
| Stock-based compensation | 1,866 | 7,369 | 9,235 | ||||||||
| Acquisition-related costs, net(1) | 273 | 391 | 664 | ||||||||
| Restructuring costs(2) | 496 | 1,832 | 2,328 | ||||||||
| Adjusted Gross Profit | $ | 127,744 | $ | 16,316 | $ | 144,060 | |||||
| Adjusted Gross Margin | 68 | % | 15 | % | 49 | % | |||||
___________________
(1) Acquisition-related costs, net include deferred retention expenses following the ARMUS, KPI Ninja, and Twistle acquisitions.
(2) Restructuring costs include severance and other team member costs from workforce reductions.
Adjusted EBITDA
Adjusted EBITDA is a non-GAAP financial measure that we define as net loss adjusted for (i) interest and other (income) expense, net, (ii) income tax provision (benefit), (iii) depreciation and amortization, (iv) stock-based compensation, (v) acquisition-related costs, net, including the fair change in value of contingent consideration liabilities for potential earn-out payments, (vi) litigation costs, (vii) restructuring costs, and (viii) non-recurring lease-related charges. We view acquisition-related expenses when applicable, such as transaction costs and changes in the fair value of contingent consideration liabilities that are directly related to business combinations, as costs that are unpredictable, dependent upon factors outside of our control, and are not necessarily reflective of operational performance during a period. We believe that excluding restructuring costs, litigation costs, and non-recurring lease-related charges allows for more meaningful comparisons between operating results from period to period as this is separate from the core activities that arise in the ordinary course of our business and are not part of our ongoing operations. We believe Adjusted EBITDA provides investors with useful information on period-to-period performance as evaluated by management and a comparison with our past financial performance and is useful in evaluating our operating performance compared to that of other companies in our industry, as this metric generally eliminates the effects of certain items that may vary from company to company for reasons unrelated to overall operating performance. The following is a reconciliation of our net loss, the most directly comparable GAAP financial measure, to Adjusted EBITDA, for the three and twelve months ended December 31, 2024 and 2023:
| Three Months Ended December 31, | Twelve Months Ended December 31, | ||||||||||||||
| 2024 | 2023 | 2024 | 2023 | ||||||||||||
| (in thousands) | (in thousands) | ||||||||||||||
| Net loss | $ | (20,673 | ) | $ | (30,312 | ) | $ | (69,502 | ) | $ | (118,147 | ) | |||
| Add: | |||||||||||||||
| Interest and other (income) expense, net | 2,548 | (2,616 | ) | (637 | ) | (9,106 | ) | ||||||||
| Income tax provision | 625 | 143 | 333 | 356 | |||||||||||
| Depreciation and amortization | 10,266 | 10,304 | 41,431 | 42,223 | |||||||||||
| Stock-based compensation | 10,812 | 13,011 | 40,128 | 55,756 | |||||||||||
| Acquisition-related costs, net(1) | 4,333 | 2,655 | 10,064 | 5,757 | |||||||||||
| Litigation costs(2) | — | — | — | 21,279 | |||||||||||
| Restructuring costs(3) | — | 6,767 | 2,088 | 8,822 | |||||||||||
| Non-recurring lease-related charges(4) | — | 1,400 | 2,200 | 4,081 | |||||||||||
| Adjusted EBITDA | $ | 7,911 | $ | 1,352 | $ | 26,105 | $ | 11,021 | |||||||
__________________
(1) Acquisition-related costs, net includes third-party fees associated with due diligence, deferred retention expenses, post-acquisition restructuring costs incurred as part of business combinations, and changes in fair value of contingent consideration liabilities for potential earn-out payments. For additional details refer to Notes 1, 2, and 7 in our consolidated financial statements.
(2) Litigation costs include costs related to litigation that are outside the ordinary course of our business. For additional details, refer to Note 16 in our consolidated financial statements.
(3) Restructuring costs include severance and other team member costs from workforce reductions, impairment of discontinued capitalized software projects, and other miscellaneous charges. For additional details, refer to Note 11 in our consolidated financial statements.
(4) Non-recurring lease-related charges includes lease-related impairment charges for the subleased portion of our corporate headquarters. For additional details refer to Note 9 in our consolidated financial statements.
Adjusted Net Income and Adjusted Net Income Per Share
Adjusted Net Income is a non-GAAP financial measure that we define as net loss adjusted for (i) stock-based compensation, (ii) amortization of acquired intangibles, (iii) acquisition-related costs, net, including the deferred tax valuation allowance release from acquisitions, (iv) litigation costs, (v) restructuring costs, (vi) non-recurring lease-related charges, and (vii) non-cash interest expense related to our convertible senior notes. We believe Adjusted Net Income provides investors with useful information on period-to-period performance as evaluated by management and comparison with our past financial performance and is useful in evaluating our operating performance compared to that of other companies in our industry, as this metric generally eliminates the effects of certain items that may vary from company to company for reasons unrelated to overall operating performance. The following is a reconciliation of our net loss, the most directly comparable GAAP financial measure, to Adjusted Net Income, for the three and twelve months ended December 31, 2024 and 2023:
| Three Months Ended December 31, | Twelve Months Ended December 31, | ||||||||||||||
| 2024 | 2023 | 2024 | 2023 | ||||||||||||
| Numerator: | (in thousands, except share and per share amounts) | ||||||||||||||
| Net loss | $ | (20,673 | ) | $ | (30,312 | ) | $ | (69,502 | ) | $ | (118,147 | ) | |||
| Add: | |||||||||||||||
| Stock-based compensation | 10,812 | 13,011 | 40,128 | 55,756 | |||||||||||
| Amortization of acquired intangibles | 7,029 | 7,243 | 28,654 | 29,636 | |||||||||||
| Acquisition-related costs, net(1) | 4,333 | 2,655 | 10,064 | 5,757 | |||||||||||
| Litigation costs(2) | — | — | — | 21,279 | |||||||||||
| Restructuring costs(3) | — | 6,767 | 2,088 | 8,822 | |||||||||||
| Non-recurring lease-related charges(4) | — | 1,400 | 2,200 | 4,081 | |||||||||||
| Non-cash interest expense related to debt | 1,178 | 379 | 3,256 | 1,511 | |||||||||||
| Adjusted Net Income | $ | 2,679 | $ | 1,143 | $ | 16,888 | $ | 8,695 | |||||||
| Denominator: | |||||||||||||||
| Weighted-average number of shares used in calculating net loss per share, basic | 62,376,784 | 57,476,187 | 60,184,920 | 56,418,397 | |||||||||||
| Non-GAAP weighted-average effect of dilutive securities | 536,029 | 283,805 | 305,370 | 666,488 | |||||||||||
| Non-GAAP weighted-average number of shares used in calculating Adjusted Net Income per share, diluted | 62,912,813 | 57,759,992 | 60,490,290 | 57,084,885 | |||||||||||
| Net loss per share, basic and diluted | $ | (0.33) | $ | (0.53) | $ | (1.15) | $ | (2.09) | |||||||
| Adjusted Net Income per share, basic | $ | 0.04 | $ | 0.02 | $ | 0.28 | $ | 0.15 | |||||||
| Adjusted Net Income per share, diluted | $ | 0.04 | $ | 0.02 | $ | 0.28 | $ | 0.15 | |||||||
______________
(1) Acquisition-related costs, net includes third-party fees associated with due diligence, deferred retention expenses, post-acquisition restructuring costs incurred as part of business combinations, changes in fair value of contingent consideration liabilities for potential earn-out payments, and the deferred tax valuation allowance release from acquisitions. For additional details refer to Notes 1, 2, 7, and 15 in our consolidated financial statements.
(2) Litigation costs include costs related to litigation that are outside the ordinary course of our business. For additional details, refer to Note 16 in our consolidated financial statements.
(3) Restructuring costs include severance and other team member costs from workforce reductions, impairment of discontinued capitalized software projects, and other miscellaneous charges. For additional details, refer to Note 11 in our consolidated financial statements.
(4) Includes the lease-related impairment charge for the subleased portion of our corporate headquarters. For additional details refer to Note 9 in our consolidated financial statements.
Health Catalyst Investor Relations Contact:
Jack Knight
Vice President, Investor Relations
+1 (855)-309-6800
ir@healthcatalyst.com
Health Catalyst Media Contact:
Amanda Flanders
SVP, Marketing and Communications
media@healthcatalyst.com
To view this slide as a PDF, please click here: http://ml.globenewswire.com/Resource/Download/a81b2084-e98b-4a71-8d9c-2fd3534b3a42
