General Dynamics Reports Third-Quarter 2024 Financial Results
General Dynamics (GD) reported strong Q3 2024 financial results with revenue reaching $11.7 billion, up 10.4% year-over-year. Operating earnings increased 11.7% to $1.2 billion, while diluted EPS grew 10.2% to $3.35. The company achieved a 10.1% operating margin, expanding 10 basis points from the previous year. Gulfstream delivered 28 aircraft, including 24 large-cabin aircraft. The quarter saw strong order activity with a book-to-bill ratio of 1.1-to-1, resulting in a total backlog of $92.6 billion and total estimated contract value of $137.6 billion.
General Dynamics (GD) ha riportato risultati finanziari solidi per il terzo trimestre del 2024, con un fatturato di $11,7 miliardi, in aumento del 10,4% rispetto all'anno precedente. Gli utili operativi sono aumentati dell'11,7% a $1,2 miliardi, mentre l'utile per azione diluito è cresciuto del 10,2% a $3,35. L'azienda ha raggiunto un margine operativo del 10,1%, in espansione di 10 punti base rispetto all'anno scorso. Gulfstream ha consegnato 28 aerei, di cui 24 aerei a grande cabina. Nel trimestre si è registrata una forte attività di ordini con un rapporto book-to-bill di 1,1 a 1, con una backlog totale di $92,6 miliardi e un valore totale stimato dei contratti di $137,6 miliardi.
General Dynamics (GD) informó resultados financieros sólidos para el tercer trimestre de 2024, con ingresos que alcanzaron $11.7 mil millones, un aumento del 10.4% en comparación con el año anterior. Las ganancias operativas aumentaron un 11.7% a $1.2 mil millones, mientras que las ganancias por acción diluida crecieron un 10.2% a $3.35. La compañía logró un margen operativo del 10.1%, ampliándose 10 puntos básicos en comparación con el año anterior. Gulfstream entregó 28 aeronaves, incluyendo 24 aeronaves de cabina grande. El trimestre vio una fuerte actividad de pedidos con una relación book-to-bill de 1.1 a 1, resultando en un backlog total de $92.6 mil millones y un valor total estimado de contratos de $137.6 mil millones.
제너럴 다이나믹스(GD)는 2024년 3분기 강력한 재무 결과를 보고했으며, 수익은 $117억에 달해 전년 대비 10.4% 증가했습니다. 운영 수익은 11.7% 증가하여 $12억에 달했고, 희석 주당 순이익은 10.2% 증가하여 $3.35로 증가했습니다. 회사는 10.1%의 운영 마진을 달성했으며, 이는 전년 대비 10 베이시스 포인트 확장된 것입니다. Gulfstream은 28대의 항공기를 인도했으며, 이 중 24대는 대형 캐빈 항공기입니다. 이번 분기는 주문 활동이 활발하게 이루어졌으며, book-to-bill 비율은 1.1:1로, 총 백로그는 $926억, 총 예상 계약 가치는 $1376억에 달합니다.
General Dynamics (GD) a annoncé de solides résultats financiers pour le troisième trimestre 2024, avec un chiffre d'affaires atteignant $11,7 milliards, en hausse de 10,4 % par rapport à l'année précédente. Les bénéfices d'exploitation ont augmenté de 11,7 % pour atteindre $1,2 milliards, tandis que le BPA dilué a crû de 10,2 % pour atteindre $3,35. L'entreprise a atteint une marge d'exploitation de 10,1 %, élargie de 10 points de base par rapport à l'année précédente. Gulfstream a livré 28 avions, dont 24 avions à grande cabine. Le trimestre a connu une forte activité de commandes avec un ratio book-to-bill de 1,1 à 1, résultant en une charge totale de $92,6 milliards et une valeur contractuelle totale estimée à $137,6 milliards.
General Dynamics (GD) berichtete über starke finanzielle Ergebnisse für das dritte Quartal 2024, mit einem Umsatz von $11,7 Milliarden, was einem Anstieg von 10,4% im Vergleich zum Vorjahr entspricht. Die Betriebsergebnisse stiegen um 11,7% auf $1,2 Milliarden, während der verwässerte Gewinn pro Aktie um 10,2% auf $3,35 wuchs. Das Unternehmen erzielte eine operative Marge von 10,1%, was eine Erweiterung um 10 Basispunkte im Vergleich zum Vorjahr bedeutet. Gulfstream lieferte 28 Flugzeuge, darunter 24 große Kabinenflugzeuge. Das Quartal verzeichnete eine starke Auftragsaktivität mit einem Buch-zu-Bill-Verhältnis von 1,1 zu 1, was zu einem Gesamtrückstand von $92,6 Milliarden und einem gesamten geschätzten Vertragswert von $137,6 Milliarden führte.
- Revenue growth of 10.4% YoY to $11.7 billion
- Operating earnings increased 11.7% YoY to $1.2 billion
- EPS growth of 10.2% to $3.35
- Operating margin expansion of 10 basis points to 10.1%
- Strong order intake with 1.1-to-1 book-to-bill ratio
- Substantial backlog of $92.6 billion
- Strong cash generation with operating cash flow at 152% of net earnings
- None.
Insights
General Dynamics delivered a robust Q3 2024 performance with impressive growth metrics.
The book-to-bill ratio of 1.1x and substantial backlog of
Strong cash generation with operating cash flow at
The defense segment's performance is particularly noteworthy with significant contract wins across various domains. Key awards include strategic programs like the Virginia-class submarines (
The diverse order mix spanning naval systems, munitions and space technology demonstrates General Dynamics' strong competitive position across multiple defense domains. The
- Revenue of
$11.7 billion 10.4% from year-ago quarter - Operating earnings of
$1.2 billion 11.7% from year-ago quarter - Diluted EPS of
$3.35 10.2% from year-ago quarter - Operating margin of
10.1% , a 10-basis-point expansion from year-ago quarter
"The company continues to see strong growth and steady improvement in operating performance," said Phebe Novakovic, chairman and chief executive officer. "Demand across the portfolio also remains strong in the current environment."
Gulfstream delivered 28 aircraft in the quarter, of which 24 were large-cabin aircraft, including four G700s. This compares with 27 aircraft delivered in the year-ago quarter, of which 22 were large cabin.
Cash and Capital Deployment
Net cash provided by operating activities in the quarter was
Orders and Backlog
The consolidated book-to-bill ratio, defined as orders divided by revenue, was 1.1-to-1 for the quarter. Company-wide backlog was
In the Aerospace segment, orders in the quarter totaled
In the defense segments, orders in the quarter totaled
About General Dynamics
Headquartered in
WEBCAST INFORMATION: General Dynamics will webcast its third-quarter 2024 financial results conference call at 9 a.m. EDT on Wednesday, October 23, 2024. The webcast will be a listen-only audio event available at www.gd.com. An on-demand replay of the webcast will be available by telephone two hours after the end of the call through October 30, 2024, at 800-770-2030 (international: +1 609-800-9909), conference ID 4299949. Charts furnished to investors and securities analysts in connection with General Dynamics' announcement of its financial results are available at www.gd.com.
This press release contains forward-looking statements (FLS), including statements about the company's future operational and financial performance, which are based on management's expectations, estimates, projections and assumptions. Words such as "expects," "anticipates," "plans," "believes," "forecasts," "scheduled," "outlook," "estimates," "should" and variations of these words and similar expressions are intended to identify FLS. In making FLS, we rely on assumptions and analyses based on our experience and perception of historical trends; current conditions and expected future developments; and other factors, estimates and judgments we consider reasonable and appropriate based on information available to us at the time. FLS are made pursuant to the safe harbor provisions of the Private Securities Litigation Reform Act of 1995, as amended. FLS are not guarantees of future performance and involve factors, risks and uncertainties that are difficult to predict. Actual future results and trends may differ materially from what is forecast in the FLS. All FLS speak only as of the date they were made. We do not undertake any obligation to update or publicly release revisions to FLS to reflect events, circumstances or changes in expectations after the date of this press release. Additional information regarding these factors is contained in the company's filings with the SEC, and these factors may be revised or supplemented in future SEC filings. In addition, this press release contains some financial measures not prepared in accordance with
EXHIBIT A
| |||||||||||
Three Months Ended | Variance | ||||||||||
September 29, 2024 | October 1, 2023 | $ | % | ||||||||
Revenue | $ 11,671 | $ 10,571 | $ 1,100 | 10.4 % | |||||||
Operating costs and expenses | (10,490) | (9,514) | (976) | ||||||||
Operating earnings | 1,181 | 1,057 | 124 | 11.7 % | |||||||
Other, net | 15 | 19 | (4) | ||||||||
Interest, net | (82) | (85) | 3 | ||||||||
Earnings before income tax | 1,114 | 991 | 123 | 12.4 % | |||||||
Provision for income tax, net | (184) | (155) | (29) | ||||||||
Net earnings | $ 930 | $ 836 | $ 94 | 11.2 % | |||||||
Earnings per share—basic | $ 3.39 | $ 3.07 | $ 0.32 | 10.4 % | |||||||
Basic weighted average shares outstanding | 274.4 | 272.6 | |||||||||
Earnings per share—diluted | $ 3.35 | $ 3.04 | $ 0.31 | 10.2 % | |||||||
Diluted weighted average shares outstanding | 277.9 | 274.7 | |||||||||
EXHIBIT B
| |||||||||||
Nine Months Ended | Variance | ||||||||||
September 29, 2024 | October 1, 2023 | $ | % | ||||||||
Revenue | $ 34,378 | $ 30,604 | $ 3,774 | 12.3 % | |||||||
Operating costs and expenses | (31,005) | (27,647) | (3,358) | ||||||||
Operating earnings | 3,373 | 2,957 | 416 | 14.1 % | |||||||
Other, net | 47 | 65 | (18) | ||||||||
Interest, net | (248) | (265) | 17 | ||||||||
Earnings before income tax | 3,172 | 2,757 | 415 | 15.1 % | |||||||
Provision for income tax, net | (538) | (447) | (91) | ||||||||
Net earnings | $ 2,634 | $ 2,310 | $ 324 | 14.0 % | |||||||
Earnings per share—basic | $ 9.61 | $ 8.45 | $ 1.16 | 13.7 % | |||||||
Basic weighted average shares outstanding | 274.0 | 273.2 | |||||||||
Earnings per share—diluted | $ 9.49 | $ 8.39 | $ 1.10 | 13.1 % | |||||||
Diluted weighted average shares outstanding | 277.5 | 275.4 | |||||||||
EXHIBIT C
| ||||||||||||||||||
Three Months Ended | Variance | |||||||||||||||||
September 29, 2024 | October 1, 2023 | $ | % | |||||||||||||||
Revenue: | ||||||||||||||||||
Aerospace | $ 2,482 | $ 2,032 | $ 450 | 22.1 % | ||||||||||||||
Marine Systems | 3,599 | 3,002 | 597 | 19.9 % | ||||||||||||||
Combat Systems | 2,212 | 2,224 | (12) | (0.5) % | ||||||||||||||
Technologies | 3,378 | 3,313 | 65 | 2.0 % | ||||||||||||||
Total | $ 11,671 | $ 10,571 | $ 1,100 | 10.4 % | ||||||||||||||
Operating earnings: | ||||||||||||||||||
Aerospace | $ 305 | $ 268 | $ 37 | 13.8 % | ||||||||||||||
Marine Systems | 258 | 211 | 47 | 22.3 % | ||||||||||||||
Combat Systems | 325 | 300 | 25 | 8.3 % | ||||||||||||||
Technologies | 326 | 315 | 11 | 3.5 % | ||||||||||||||
Corporate | (33) | (37) | 4 | 10.8 % | ||||||||||||||
Total | $ 1,181 | $ 1,057 | $ 124 | 11.7 % | ||||||||||||||
Operating margin: | ||||||||||||||||||
Aerospace | 12.3 % | 13.2 % | ||||||||||||||||
Marine Systems | 7.2 % | 7.0 % | ||||||||||||||||
Combat Systems | 14.7 % | 13.5 % | ||||||||||||||||
Technologies | 9.7 % | 9.5 % | ||||||||||||||||
Total | 10.1 % | 10.0 % | ||||||||||||||||
EXHIBIT D
| ||||||||||||||||
Nine Months Ended | Variance | |||||||||||||||
September 29, 2024 | October 1, 2023 | $ | % | |||||||||||||
Revenue: | ||||||||||||||||
Aerospace | $ 7,506 | $ 5,877 | $ 1,629 | 27.7 % | ||||||||||||
Marine Systems | 10,383 | 9,053 | 1,330 | 14.7 % | ||||||||||||
Combat Systems | 6,602 | 5,904 | 698 | 11.8 % | ||||||||||||
Technologies | 9,887 | 9,770 | 117 | 1.2 % | ||||||||||||
Total | $ 34,378 | $ 30,604 | $ 3,774 | 12.3 % | ||||||||||||
Operating earnings: | ||||||||||||||||
Aerospace | $ 879 | $ 733 | $ 146 | 19.9 % | ||||||||||||
Marine Systems | 735 | 657 | 78 | 11.9 % | ||||||||||||
Combat Systems | 920 | 796 | 124 | 15.6 % | ||||||||||||
Technologies | 941 | 897 | 44 | 4.9 % | ||||||||||||
Corporate | (102) | (126) | 24 | 19.0 % | ||||||||||||
Total | $ 3,373 | $ 2,957 | $ 416 | 14.1 % | ||||||||||||
Operating margin: | ||||||||||||||||
Aerospace | 11.7 % | 12.5 % | ||||||||||||||
Marine Systems | 7.1 % | 7.3 % | ||||||||||||||
Combat Systems | 13.9 % | 13.5 % | ||||||||||||||
Technologies | 9.5 % | 9.2 % | ||||||||||||||
Total | 9.8 % | 9.7 % | ||||||||||||||
EXHIBIT E
| ||||||||||||||
(Unaudited) | ||||||||||||||
September 29, 2024 | December 31, 2023 | |||||||||||||
ASSETS | ||||||||||||||
Current assets: | ||||||||||||||
Cash and equivalents | $ 2,101 | $ 1,913 | ||||||||||||
Accounts receivable | 3,165 | 3,004 | ||||||||||||
Unbilled receivables | 8,852 | 7,997 | ||||||||||||
Inventories | 10,141 | 8,578 | ||||||||||||
Other current assets | 1,484 | 2,123 | ||||||||||||
Total current assets | 25,743 | 23,615 | ||||||||||||
Noncurrent assets: | ||||||||||||||
Property, plant and equipment, net | 6,324 | 6,198 | ||||||||||||
Intangible assets, net | 1,583 | 1,656 | ||||||||||||
Goodwill | 20,757 | 20,586 | ||||||||||||
Other assets | 2,905 | 2,755 | ||||||||||||
Total noncurrent assets | 31,569 | 31,195 | ||||||||||||
Total assets | $ 57,312 | $ 54,810 | ||||||||||||
LIABILITIES AND SHAREHOLDERS' EQUITY | ||||||||||||||
Current liabilities: | ||||||||||||||
Short-term debt and current portion of long-term debt | $ 2,005 | $ 507 | ||||||||||||
Accounts payable | 3,290 | 3,095 | ||||||||||||
Customer advances and deposits | 10,925 | 9,564 | ||||||||||||
Other current liabilities | 3,337 | 3,266 | ||||||||||||
Total current liabilities | 19,557 | 16,432 | ||||||||||||
Noncurrent liabilities: | ||||||||||||||
Long-term debt | 7,262 | 8,754 | ||||||||||||
Other liabilities | 7,520 | 8,325 | ||||||||||||
Total noncurrent liabilities | 14,782 | 17,079 | ||||||||||||
Shareholders' equity: | ||||||||||||||
Common stock | 482 | 482 | ||||||||||||
Surplus | 3,997 | 3,760 | ||||||||||||
Retained earnings | 40,730 | 39,270 | ||||||||||||
Treasury stock | (21,137) | (21,054) | ||||||||||||
Accumulated other comprehensive loss | (1,099) | (1,159) | ||||||||||||
Total shareholders' equity | 22,973 | 21,299 | ||||||||||||
Total liabilities and shareholders' equity | $ 57,312 | $ 54,810 | ||||||||||||
EXHIBIT F
| |||
Nine Months Ended | |||
September 29, 2024 | October 1, 2023 | ||
Cash flows from operating activities—continuing operations: | |||
Net earnings | $ 2,634 | $ 2,310 | |
Adjustments to reconcile net earnings to net cash from operating activities: | |||
Depreciation of property, plant and equipment | 469 | 446 | |
Amortization of intangible and finance lease right-of-use assets | 177 | 195 | |
Equity-based compensation expense | 137 | 136 | |
Deferred income tax benefit | (107) | (158) | |
(Increase) decrease in assets, net of effects of business acquisitions: | |||
Accounts receivable | (172) | (89) | |
Unbilled receivables | (874) | 448 | |
Inventories | (1,612) | (1,904) | |
Increase (decrease) in liabilities, net of effects of business acquisitions: | |||
Accounts payable | 193 | (83) | |
Customer advances and deposits | 628 | 2,171 | |
Other, net | 479 | 42 | |
Net cash provided by operating activities | 1,952 | 3,514 | |
Cash flows from investing activities: | |||
Capital expenditures | (561) | (600) | |
Other, net | (27) | (8) | |
Net cash used by investing activities | (588) | (608) | |
Cash flows from financing activities: | |||
Dividends paid | (1,140) | (1,068) | |
Purchases of common stock | (183) | (434) | |
Repayment of fixed-rate notes | — | (1,250) | |
Other, net | 150 | (40) | |
Net cash used by financing activities | (1,173) | (2,792) | |
Net cash used by discontinued operations | (3) | (4) | |
Net increase in cash and equivalents | 188 | 110 | |
Cash and equivalents at beginning of period | 1,913 | 1,242 | |
Cash and equivalents at end of period | $ 2,101 | $ 1,352 | |
EXHIBIT G
| ||||||||
Other Financial Information: | ||||||||
September 29, 2024 | December 31, 2023 | |||||||
Debt-to-equity (a) | 40.3 % | 43.5 % | ||||||
Book value per share (b) | $ 83.55 | $ 77.85 | ||||||
Shares outstanding | 274,968,619 | 273,599,948 | ||||||
Third Quarter | Nine Months | |||||||
2024 | 2023 | 2024 | 2023 | |||||
Income tax payments, net | $ 173 | $ 167 | $ 125 | $ 493 | ||||
Company-sponsored research and development (c) | $ 137 | $ 140 | $ 421 | $ 395 | ||||
Return on sales (d) | 8.0 % | 7.9 % | 7.7 % | 7.5 % | ||||
Non-GAAP Financial Measures: | ||||||||
Third Quarter | Nine Months | |||||||
2024 | 2023 | 2024 | 2023 | |||||
Free cash flow: | ||||||||
Net cash provided by operating activities | $ 1,416 | $ 1,321 | $ 1,952 | $ 3,514 | ||||
Capital expenditures | (201) | (227) | (561) | (600) | ||||
Free cash flow (e) | $ 1,215 | $ 1,094 | $ 1,391 | $ 2,914 | ||||
September 29, 2024 | December 31, 2023 | |||||||
Net debt: | ||||||||
Total debt | $ 9,267 | $ 9,261 | ||||||
Less cash and equivalents | 2,101 | 1,913 | ||||||
Net debt (f) | $ 7,166 | $ 7,348 | ||||||
(a) | Debt-to-equity ratio is calculated as total debt divided by total equity as of the end of the period. |
(b) | Book value per share is calculated as total equity divided by total outstanding shares as of the end of the period. |
(c) | Includes independent research and development and Aerospace product-development costs. |
(d) | Return on sales is calculated as net earnings divided by revenue. |
(e) | We define free cash flow as net cash from operating activities less capital expenditures. We believe free cash flow is a useful measure for investors because it portrays our ability to generate cash from our businesses for purposes such as repaying debt, funding business acquisitions, repurchasing our common stock and paying dividends. We use free cash flow to assess the quality of our earnings and as a key performance measure in evaluating management. |
(f) | We define net debt as short- and long-term debt (total debt) less cash and equivalents. We believe net debt is a useful measure for investors because it reflects the borrowings that support our operations and capital deployment strategy. We use net debt as an important indicator of liquidity and financial position. |
EXHIBIT H
| ||||||||||
Funded | Unfunded | Total Backlog | Estimated Potential Contract Value* | Total Estimated Contract Value | ||||||
Third Quarter 2024: | ||||||||||
Aerospace | $ 18,859 | $ 937 | $ 19,796 | $ 254 | $ 20,050 | |||||
Marine Systems | 29,008 | 11,463 | 40,471 | 9,578 | 50,049 | |||||
Combat Systems | 17,289 | 682 | 17,971 | 8,016 | 25,987 | |||||
Technologies | 9,794 | 4,602 | 14,396 | 27,093 | 41,489 | |||||
Total | $ 74,950 | $ 17,684 | $ 92,634 | $ 44,941 | $ 137,575 | |||||
Second Quarter 2024: | ||||||||||
Aerospace | $ 19,126 | $ 911 | $ 20,037 | $ 372 | $ 20,409 | |||||
Marine Systems | 29,912 | 11,436 | 41,348 | 3,983 | 45,331 | |||||
Combat Systems | 16,003 | 673 | 16,676 | 5,816 | 22,492 | |||||
Technologies | 9,365 | 3,875 | 13,240 | 28,283 | 41,523 | |||||
Total | $ 74,406 | $ 16,895 | $ 91,301 | $ 38,454 | $ 129,755 | |||||
Third Quarter 2023: | ||||||||||
Aerospace | $ 19,654 | $ 405 | $ 20,059 | $ 785 | $ 20,844 | |||||
Marine Systems | 30,445 | 17,277 | 47,722 | 3,113 | 50,835 | |||||
Combat Systems | 14,375 | 719 | 15,094 | 6,098 | 21,192 | |||||
Technologies | 9,833 | 2,852 | 12,685 | 27,302 | 39,987 | |||||
Total | $ 74,307 | $ 21,253 | $ 95,560 | $ 37,298 | $ 132,858 | |||||
* | The estimated potential contract value includes work awarded on unfunded indefinite delivery, indefinite quantity (IDIQ) contracts and unexercised options associated with existing firm contracts, including options and other agreements with existing customers to purchase new aircraft and aircraft services. We recognize options in backlog when the customer exercises the option and establishes a firm order. For IDIQ contracts, we evaluate the amount of funding we expect to receive and include this amount in our estimated potential contract value. The actual amount of funding received in the future may be higher or lower than our estimate of potential contract value. |
EXHIBIT H-1
|
BACKLOG - (UNAUDITED) |
DOLLARS IN MILLIONS |
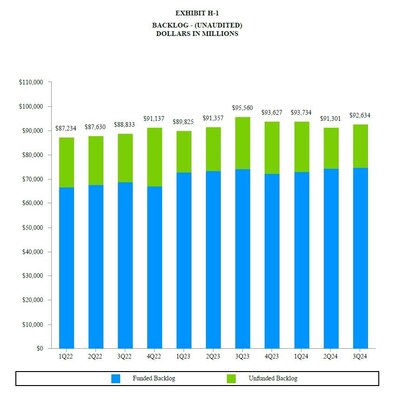
EXHIBIT H-2
|
BACKLOG BY SEGMENT - (UNAUDITED) |
DOLLARS IN MILLIONS |
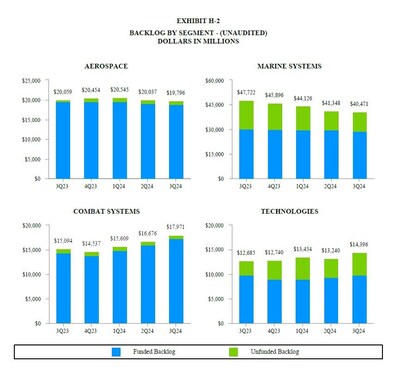
EXHIBIT I
|
THIRD QUARTER 2024 SIGNIFICANT ORDERS - (UNAUDITED) |
DOLLARS IN MILLIONS |
We received the following significant contract awards during the third quarter of 2024:
Marine Systems:
$780 U.S. Navy for the construction of an additional John Lewis-class (T-AO-205) fleet replenishment oiler. The contract including options for an additional seven T-AO-205 oilers has a maximum potential value of more than$6.7 billion $1.5 billion $100 $85 $80
Combat Systems:
$885 $1.7 billion $465 U.S. Army for the production of 155mm artillery projectile metal parts. These contracts have a maximum potential value of$1.7 billion $395 $190 $180 $100
Technologies:
$840 $1 billion $605 U.S. Space Development Agency to develop and integrate ground systems for the low-Earth orbit satellite network.$105 U.S. Defense Information Systems Agency (DISA) to continue operating and maintaining Pentagon and regional government-furnished network infrastructures. The contract including options has a maximum potential value of$300 $185 U.S. Department of State (DoS) to manage its global technical security supply chain.$135 $130 $120 U.S. embassies and consulates throughout the world under the Global Support Strategy (GSS) program.
EXHIBIT J
| ||||||||
Third Quarter | Nine Months | |||||||
2024 | 2023 | 2024 | 2023 | |||||
Gulfstream Aircraft Deliveries (units): | ||||||||
Large-cabin aircraft | 24 | 22 | 76 | 57 | ||||
Mid-cabin aircraft | 4 | 5 | 13 | 15 | ||||
Total | 28 | 27 | 89 | 72 | ||||
Aerospace Book-to-Bill: | ||||||||
Orders* | $ 2,365 | $ 2,916 | $ 7,464 | $ 7,119 | ||||
Revenue | 2,482 | 2,032 | 7,506 | 5,877 | ||||
Book-to-Bill Ratio | 1.0x | 1.4x | 1.0x | 1.2x | ||||
* Does not include customer defaults, liquidated damages, cancellations, foreign exchange fluctuations and other backlog adjustments. | ||||||||
![]()
![]() View original content to download multimedia:https://www.prnewswire.com/news-releases/general-dynamics-reports-third-quarter-2024-financial-results-302283844.html
View original content to download multimedia:https://www.prnewswire.com/news-releases/general-dynamics-reports-third-quarter-2024-financial-results-302283844.html
SOURCE General Dynamics