Calibre Reports 2024 Financial Results; 2025 Set to be a Transformational Year as the Multi-Million Ounce Valentine Gold Mine, Canada Advances to First Gold During Q2, 2025
Calibre Mining reported strong financial results for Q4 and FY 2024, achieving record Q4 gold production of 76,269 ounces and full-year production of 242,487 ounces, exceeding revised guidance. The company's Valentine Gold Mine is on track for first gold production in Q2 2025, with construction progressing well and initial project capital costs remaining at C$744 million.
As of February 15, 2025, consolidated production is trending 15% above budget, with cash increasing to $161 million, up 23% from December 31, 2024. FY 2024 gold sales reached 242,452 ounces, generating $574.4 million in revenue at an average realized gold price of $2,369/oz. The company reported Total Cash Costs of $1,336/oz and All-In Sustaining Costs of $1,583/oz.
Significant exploration success continues at Valentine, with drill results showing grades 40% above Mineral Reserve grade. The company also declared an initial Inferred Mineral Resource at the Talavera Gold Deposit near the Limon mill, comprising 3.847 million tonnes at 5.09 g/t gold for 630,000 ounces.
Calibre Mining ha riportato risultati finanziari solidi per il Q4 e l'anno fiscale 2024, raggiungendo una produzione record di oro nel Q4 di 76.269 once e una produzione totale per l'anno di 242.487 once, superando le previsioni riviste. La miniera d'oro Valentine è in programma per la prima produzione d'oro nel Q2 2025, con i lavori di costruzione che procedono bene e i costi iniziali del progetto che rimangono a C$744 milioni.
Al 15 febbraio 2025, la produzione consolidata è in crescita del 15% rispetto al budget, con la liquidità che aumenta a $161 milioni, in aumento del 23% rispetto al 31 dicembre 2024. Le vendite di oro per l'anno fiscale 2024 hanno raggiunto 242.452 once, generando $574,4 milioni di entrate a un prezzo medio realizzato dell'oro di $2.369/oz. L'azienda ha riportato Costi Totali di Liquidità di $1.336/oz e Costi Totali Sostenibili di $1.583/oz.
Il successo significativo nell'esplorazione continua a Valentine, con risultati di perforazione che mostrano gradi superiori del 40% rispetto al grado delle riserve minerarie. L'azienda ha anche dichiarato una riserva mineraria iniziale inferita presso il deposito d'oro Talavera vicino al mulino di Limon, comprendente 3.847 milioni di tonnellate a 5,09 g/t d'oro per 630.000 once.
Calibre Mining reportó resultados financieros sólidos para el Q4 y el año fiscal 2024, logrando una producción récord de oro en el Q4 de 76,269 onzas y una producción total anual de 242,487 onzas, superando las guías revisadas. La mina de oro Valentine está programada para la primera producción de oro en el Q2 de 2025, con la construcción avanzando bien y los costos de capital iniciales del proyecto manteniéndose en C$744 millones.
Al 15 de febrero de 2025, la producción consolidada está en tendencia un 15% por encima del presupuesto, con el efectivo aumentando a $161 millones, un 23% más que el 31 de diciembre de 2024. Las ventas de oro para el año fiscal 2024 alcanzaron 242,452 onzas, generando $574.4 millones en ingresos a un precio promedio realizado de $2,369/oz. La empresa reportó Costos Totales de Efectivo de $1,336/oz y Costos Totales Sostenibles de $1,583/oz.
El éxito significativo en la exploración continúa en Valentine, con resultados de perforación que muestran grados un 40% superiores al grado de la Reserva Mineral. La empresa también declaró un recurso mineral inferido inicial en el depósito de oro Talavera cerca del molino de Limon, comprendiendo 3.847 millones de toneladas a 5.09 g/t de oro para 630,000 onzas.
칼리버 마이닝은 2024년 4분기 및 전체 회계연도에 대한 강력한 재무 실적을 보고하며, 4분기 금 생산량이 76,269온스로 기록을 세우고 전체 연간 생산량이 242,487온스로 수정된 가이던스를 초과했습니다. 회사의 발렌타인 금광은 2025년 2분기에 첫 금 생산을 목표로 하고 있으며, 건설이 순조롭게 진행되고 초기 프로젝트 자본 비용은 C$744백만으로 유지되고 있습니다.
2025년 2월 15일 기준으로 통합 생산량이 예산보다 15% 높은 추세를 보이고 있으며, 현금은 $161백만으로 증가하여 2024년 12월 31일 대비 23% 증가했습니다. 2024 회계연도 금 판매량은 242,452온스에 달하며, 평균 실현 금 가격이 $2,369/온스인 가운데 $574.4백만의 수익을 창출했습니다. 회사는 총 현금 비용이 $1,336/온스, 전부 포함 지속 비용이 $1,583/온스라고 보고했습니다.
발렌타인에서의 중요한 탐사 성공이 계속되고 있으며, 시추 결과는 광물 매장량 등급보다 40% 높은 등급을 보여주고 있습니다. 회사는 또한 리몬 밀 근처의 탈라베라 금 매장지에서 초기 추정 광물 자원을 선언했으며, 3.847백만 톤에서 5.09 g/t 금으로 630,000온스를 포함합니다.
Calibre Mining a rapporté des résultats financiers solides pour le 4ème trimestre et l'exercice 2024, atteignant une production record d'or au 4ème trimestre de 76 269 onces et une production totale annuelle de 242 487 onces, dépassant les prévisions révisées. La mine d'or Valentine est en bonne voie pour une première production d'or au 2ème trimestre 2025, la construction progressant bien et les coûts de capital initiaux restant à 744 millions de CAD.
Au 15 février 2025, la production consolidée est en tendance 15 % au-dessus du budget, avec des liquidités atteignant 161 millions de dollars, en hausse de 23 % par rapport au 31 décembre 2024. Les ventes d'or pour l'exercice 2024 ont atteint 242 452 onces, générant 574,4 millions de dollars de revenus à un prix moyen réalisé de 2 369 $/once. L'entreprise a rapporté des coûts totaux de liquidité de 1 336 $/once et des coûts totaux de maintien de 1 583 $/once.
Un succès d'exploration significatif se poursuit à Valentine, les résultats de forage montrant des teneurs 40 % au-dessus de la teneur des réserves minérales. L'entreprise a également déclaré une ressource minérale initiale inférée au dépôt d'or Talavera près du moulin de Limon, comprenant 3,847 millions de tonnes à 5,09 g/t d'or pour 630 000 onces.
Calibre Mining hat starke Finanzergebnisse für das 4. Quartal und das Geschäftsjahr 2024 gemeldet, mit einer Rekordgoldproduktion im 4. Quartal von 76.269 Unzen und einer Gesamtjahresproduktion von 242.487 Unzen, die die überarbeiteten Prognosen übertrifft. Die Valentine-Goldmine ist auf Kurs für die erste Goldproduktion im 2. Quartal 2025, wobei der Bau gut voranschreitet und die anfänglichen Projektkosten bei 744 Millionen CAD bleiben.
Am 15. Februar 2025 liegt die konsolidierte Produktion 15 % über dem Budget, während die liquiden Mittel auf 161 Millionen USD gestiegen sind, was einem Anstieg von 23 % seit dem 31. Dezember 2024 entspricht. Im Geschäftsjahr 2024 erreichten die Goldverkäufe 242.452 Unzen und generierten Einnahmen von 574,4 Millionen USD bei einem durchschnittlichen realisierten Goldpreis von 2.369 USD/Unze. Das Unternehmen berichtete von Gesamtkosten für Bargeld von 1.336 USD/Unze und Gesamtkosten für nachhaltige Betriebe von 1.583 USD/Unze.
Wesentliche Erfolge bei der Exploration setzen sich in Valentine fort, wobei die Bohrergebnisse Gehalte zeigen, die 40 % über dem Mineralreservengehalt liegen. Das Unternehmen erklärte auch eine anfängliche abgeleitete Mineralressource im Talavera-Goldlager nahe der Limon-Mühle, die aus 3,847 Millionen Tonnen mit 5,09 g/t Gold für 630.000 Unzen besteht.
- None.
- None.
VANCOUVER, British Columbia, Feb. 19, 2025 (GLOBE NEWSWIRE) -- Calibre Mining Corp. (TSX: CXB; OTCQX: CXBMF) (“Calibre” or the “Company”) announces financial and operating results for the three months (“Q4”) and full year ended December 31, 2024 (“FY 2024”). Consolidated Q4 and FY 2024 filings can be found at www.sedarplus.ca and on the Company’s website at www.calibremining.com. All figures are expressed in U.S. dollars unless otherwise stated.
Darren Hall, President and Chief Executive Officer of Calibre, stated: “Calibre delivered a record Q4 consolidated gold production of 76,269 ounces, and full year 2024 production of 242,487 ounces, surpassing the revised 2024 annual production guidance. As of February 15, 2025, the year is off to a strong start with consolidated production trending
2025 is set to be a transformative year for Calibre, with the Valentine Gold Mine on track for first gold during the second quarter. We hired a high quality, experienced operating team through 2024 and are working with Reliable Controls Corporation to conduct pre-commissioning and commissioning to ensure operational readiness. In addition, all necessary equipment and resources for timely production are on site. Based on the 2022 Feasibility Study*, Valentine’s life-of-mine average production is expected to be approximately 195,000 ounces per year, with the process plant expected to reach 2.5 Mpta by the end of 2025.
The exploration potential at Valentine is incredibly exciting. We have seen continued success since the discovery made southwest of the Leprechaun deposit in late 2024 with initial drill results returning grades more than
With strong gold prices, consistent operating performance, successful exploration results and Valentine on track to enhance diversification and growth, I am confident that we will continue delivering superior value for our shareholders.”
FY & Q4 2024 Highlights
- Construction of the multi-million-ounce Valentine Gold Mine is on track for first gold during Q2 2025:
- Tailings Management Facility is complete and receiving water;
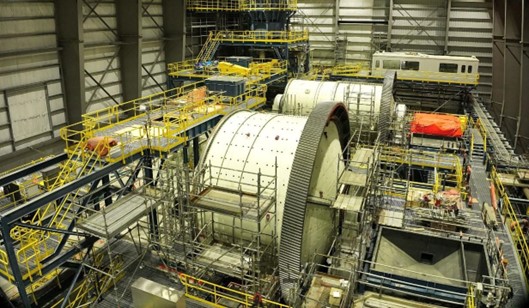
- SAG and Ball Mill continue to advance towards pre-commissioning;
- Structural, mechanical and piping activities advancing in the Grinding, ADR, Reagents and Gold Room areas;
- CIL leaching tanks construction is complete and mechanical/electrical work has commenced;
- Overland and coarse ore stockpile conveyor is progressing and reclaim tunnel is preparing for apron feeders;
- Primary crusher installation is complete and commissioning is well advanced;
- Pre-commissioning across the site is well underway; and
- Initial project capital costs, exclusive of sunk costs, remain at approximately C
$744 million .
- Record consolidated Q4 gold production of 76,269 ounces, 2025 off to a strong start;
- Consolidated FY 2024 gold production of 242,487 ounces, exceeding updated 2024 guidance;
- Drill results from the expanded 100,000 metre drill program at Valentine yield significant gold mineralization outside of the known Mineral Resource estimate and up to 1,000 metres southwest of the known Leprechaun open pit with grades more than
40% above Mineral Reserve grade:- 2.43 g/t Au over 172.8 metres including 3.84 g/t Au over 90.9 metres; and
- 2.12 g/t Au over 95.4 metres; 2.26 g/t Au over 78.3 metres;
- Ore control drilling results at the Marathon Pit at Valentine yielded
44% additional gold on47% higher grades than modelled in the 2022 Mineral Reserve estimate, increasing confidence of the deposit; - Received the Federal Environmental Assessment approval for the third open pit, the Berry Pit at Valentine, and commenced construction activities at Berry in Q4 2024;
- Achieved one million ounces of gold production in Nicaragua since becoming a producer in Q4 2019;
- Initial Inferred Mineral Resource estimate declared at the Talavera Gold Deposit located 3 km from the Limon mill comprised of 3,847,000 tonnes averaging 5.09 g/t gold, yielding 630,000 ounces of gold;
- High grade gold mineralization and new discoveries continue across the Limon Mine Complex with quarterly drill results among the best to-date at both Talavera and the VTEM Gold Corridor, signaling the exceptional potential at Limon:
- 12.57 g/t Au over 7.1 metres including 26.65 g/t Au over 3.3 metres;
- 12.96 g/t Au over 19.9 metres; 10.59 g/t Au over 13.5 metres; and
- 9.97 g/t Au over 6.9 metres; 14.64 g/t Au over 7.5 metres;
- Continued to intercept high grade gold mineralization from the resource conversion and expansion program within the Guapinol open pit area at the Eastern Borosi mine in Nicaragua, reinforcing the potential for mine life extension:
- 13.24 g/t gold over 5.8 metres ETW including 18.52 g/t gold over 4.0 metres ETW; and
- 9.24 g/t gold over 6.2 metres ETW including 17.45 g/t gold over 3.1 metres ETW
FY 2024 Gold Sales and Cost Metrics
- Consolidated gold sales of 242,452 ounces, generating
$574.4 million in gold revenue, at an average realized gold price1 of$2,369 /oz; Nicaragua 207,224 ounces and Nevada 35,228 ounces; - Consolidated Total Cash Cost1 (“TCC”) of
$1,336 /oz; Nicaragua$1,313 /oz and Nevada$1,473 /oz; - Consolidated All-In Sustaining Cost1 (“AISC”) of
$1,583 /oz; Nicaragua$1,480 /oz and Nevada$1,683 /oz; and - Cash and restricted cash of
$131.1 million and$54.6 million , respectively, as at December 31, 2024.
Valentine Grinding Building - February 2025
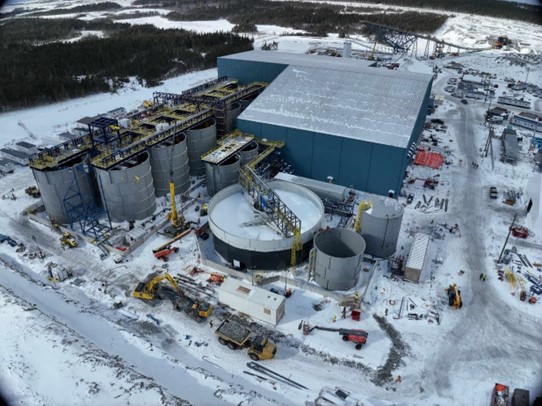
Overview of Process Plant - February 2025
CONSOLIDATED RESULTS: Q4 and FY 2024
Consolidated Results(1)
| $'000 (except per share and per ounce amounts) | Three Months Ended | Full Year Ended | |||||||||||||
| Q4 2024 | Q3 2024 | Q4 2023 | 2024 | 2023 | |||||||||||
| Financial Results | |||||||||||||||
| Revenue | $ | 202,966 | $ | 113,684 | $ | 151,595 | $ | 585,863 | $ | 561,702 | |||||
| Cost of sales, including depreciation and amortization | $ | (138,607 | ) | $ | (97,437 | ) | $ | (109,742 | ) | $ | (433,360 | ) | $ | (391,299 | ) |
| Earnings from mine operations | $ | 64,359 | $ | 16,247 | $ | 41,853 | $ | 152,503 | $ | 170,403 | |||||
| EBITDA (2) | $ | 73,456 | $ | 29,988 | $ | 43,659 | $ | 182,808 | $ | 214,075 | |||||
| Adjusted EBITDA (2) | $ | 95,573 | $ | 28,943 | $ | 59,195 | $ | 215,827 | $ | 232,046 | |||||
| Net earnings | $ | 16,661 | $ | 954 | $ | 12,001 | $ | 34,740 | $ | 85,025 | |||||
| Adjusted net earnings (2) | $ | 38,550 | $ | 2,199 | $ | 22,305 | $ | 66,264 | $ | 96,667 | |||||
| Operating cash flows before working capital (2) | $ | 127,587 | $ | 4,170 | $ | 40,441 | $ | 251,510 | $ | 178,158 | |||||
| Operating cash flow | $ | 91,404 | $ | (17,833 | ) | $ | 60,330 | $ | 181,053 | $ | 201,106 | ||||
| Capital expenditures (sustaining) | $ | 6,940 | $ | 10,849 | $ | 9,225 | $ | 35,856 | $ | 28,770 | |||||
| Capital expenditures (growth) | $ | 125,485 | $ | 136,103 | $ | 32,077 | $ | 427,318 | $ | 102,281 | |||||
| Capital expenditures (exploration) | $ | 13,985 | $ | 12,387 | $ | 7,845 | $ | 42,976 | $ | 29,293 | |||||
| Operating Results | |||||||||||||||
| Gold ounces produced | 76,269 | 45,697 | 75,482 | 242,487 | 283,494 | ||||||||||
| Gold ounces sold | 76,252 | 46,076 | 75,505 | 242,452 | 283,525 | ||||||||||
| Per Ounce Data | |||||||||||||||
| Average realized gold price(2) ($/oz) | $ | 2,616 | $ | 2,418 | $ | 1,969 | $ | 2,369 | $ | 1,942 | |||||
| TCC ($/oz)(2) | $ | 1,243 | $ | 1,580 | $ | 1,136 | $ | 1,336 | $ | 1,071 | |||||
| AISC ($/oz)(2) | $ | 1,423 | $ | 1,946 | $ | 1,317 | $ | 1,583 | $ | 1,228 | |||||
| $'000 (except per share and per ounce amounts) | Three Months Ended | Full Year Ended | |||||||||||
| Q4 2024 | Q3 2024 | Q4 2023 | 2024 | 2023 | |||||||||
| Financial Results | |||||||||||||
| Weighted Avg. Numbers of Shares Outstanding | |||||||||||||
| Basic (in thousands) | 838,038 | 796,103 | 458,094 | 766,477 | 456,347 | ||||||||
| Diluted (in thousands) | 869,947 | 828,006 | 475,292 | 794,844 | 473,925 | ||||||||
| Per Share Data | |||||||||||||
| Earnings per share – basic | $ | 0.02 | $ | 0.00 | $ | 0.03 | $ | 0.05 | $ | 0.19 | |||
| Earnings per share – fully diluted | $ | 0.02 | $ | 0.00 | $ | 0.03 | $ | 0.04 | $ | 0.18 | |||
| Adjusted net earnings per share – basic (2) | $ | 0.05 | $ | 0.00 | $ | 0.05 | $ | 0.09 | $ | 0.21 | |||
| Operating cash flows before working capital/share(2) | $ | 0.15 | $ | 0.01 | $ | 0.09 | $ | 0.33 | $ | 0.39 | |||
| Operating cash flow per share | $ | 0.11 | $ | (0.02 | ) | $ | 0.13 | $ | 0.23 | $ | 0.44 | ||
| Balance Sheet Data (in thousands, except for ratio) | |||||||||||||
| Cash and cash equivalents | $ | 131,093 | $ | 115,800 | $ | 86,160 | $ | 131,093 | $ | 86,160 | |||
| Adjusted net debt (2) | $ | 165,201 | $ | 178,345 | $ | (66,054 | ) | $ | 165,201 | $ | (66,054 | ) | |
| Adj. Net debt/Adj. EBITDA (LTM) ratio (2. 3) | $ | 0.77 | $ | 0.91 | $ | (0.28 | ) | $ | 0.77 | $ | (0.28 | ) | |
- Consolidated financial and operational results for 2024 include the results from Marathon since its acquisition from the period of January 25, 2024, to December 31, 2024.
- This is a non-IFRS measure, for further information refer to the Non-IFRS Measures section in the Notes below.
- LTM is defined as the last twelve months.
Operating Results
| Three Months Ended | Full Year Ended | ||||
| NICARAGUA | Q4 2024 | Q3 2024 | Q4 2023 | 2024 | 2023 |
| Ore mined (t) | 796,789 | 574,878 | 521,325 | 2,265,749 | 2,109,956 |
| Ore milled (t) | 617,415 | 557,635 | 527,753 | 2,161,677 | 2,072,875 |
| Grade (g/t Au) | 3.97 | 2.30 | 3.64 | 3.28 | 3.93 |
| Recovery (%) | 89.1 | 88.9 | 93.2 | 90.5 | 92.4 |
| Gold produced (ounces) | 66,578 | 36,427 | 64,963 | 207,220 | 242,109 |
| Gold sold (ounces) | 66,578 | 36,427 | 65,026 | 207,224 | 242,126 |
| NEVADA | Three Months Ended | Full Year Ended | |||
| Q4 2024 | Q3 2024 | Q4 2023 | 2024 | 2023 | |
| Ore mined (t) | 1,116,192 | 1,187,591 | 1,138,653 | 4,372,719 | 4,652,600 |
| Ore placed on leach pad (t) | 1,136,772 | 1,158,381 | 1,139,889 | 4,332,507 | 4,592,642 |
| Grade (g/t Au) | 0.36 | 0.44 | 0.33 | 0.40 | 0.36 |
| Gold produced (ounces) | 9,691 | 9,270 | 10,519 | 35,267 | 41,385 |
| Gold sold (ounces) | 9,674 | 9,649 | 10,479 | 35,228 | 41,399 |
2025 GUIDANCE
| CONSOLIDATED | NICARAGUA | NEWFOUNDLAND | NEVADA | |
| Gold Production/Sales (ounces) | 230,000 - 280,000 | 200,000 - 250,000 | N/A | 30,000 - 40,000 |
| TCC ($/ounce)1 | N/A | |||
| AISC ($/ounce)1 | N/A | |||
| Growth Capital ($ million) | N/A | |||
| Exploration ($ million) |
The 2025 guidance currently covers gold production, TCC, AISC, and growth capital for operations in Nicaragua and Nevada. The consolidated exploration guidance includes drilling activities at the Valentine gold mine. Guidance for Valentine, including production, TCC, AISC, growth and full-year consolidated details, will be provided after first gold is produced from Valentine, expected during Q2 this year.
Calibre is nearing completion of construction at its Valentine Gold Mine in Newfoundland & Labrador, which is set to become Atlantic Canada’s largest gold mine. This milestone marks a significant transformation for the Company from a junior gold miner to a diversified, mid-tier gold producer.
Calibre will continue to reinvest in exploration and growth, with approximately 200,000 metres of drilling planned and the development of new satellite deposits across its asset portfolio.
Exploration activities in 2025 include multi-rig diamond, RC and RAB drilling in Newfoundland, Nevada and Nicaragua alongside several geoscience initiatives. Growth capital investments include underground and open pit mine development, waste stripping and strategic land acquisitions.
Q4 and Full Year 2024 Conference Call
| Date: | Thursday, February 20, 2025 |
| Time: | 10:00 am ET |
| Webcast link: | https://edge.media-server.com/mmc/p/4zd24xmm |
Instructions for obtaining conference call dial-in number:
- All parties must register at the link below to participate in Calibre’s Q4 and Full Year 2024 Conference Call.
- To register click https://dpregister.com/sreg/10191038/fd1cb8c35e and complete the online registration form.
- Once registered you will receive the dial-in numbers and PIN number for input at the time of the call.
The live webcast and registration link can be accessed here and at www.calibremining.com under the Events section under the Investors tab. The live audio webcast will be archived and available for replay for 12 months after the event at www.calibremining.com. Presentation slides that will accompany the conference call will be made available in the Investors section of the Calibre website under Presentations prior to the conference call.
Qualified Person
The scientific and technical information contained in this news release was approved by David Schonfeldt P.GEO,
Calibre Mining’s Corporate Chief Geologist and a "Qualified Person" under National Instrument 43-101.
About Calibre
Calibre is a Canadian-listed, Americas focused, growing mid-tier gold producer with a strong pipeline of development and exploration opportunities across Newfoundland & Labrador in Canada, Nevada and Washington in the USA, and Nicaragua. Calibre is focused on delivering sustainable value for shareholders, local communities and all stakeholders through responsible operations and a disciplined approach to growth. With a strong balance sheet, a proven management team, strong operating cash flow, accretive development projects and district-scale exploration opportunities Calibre will unlock significant value.
ON BEHALF OF THE BOARD
“Darren Hall”
Darren Hall, President & Chief Executive Officer
For further information, please contact:
Ryan King
Senior Vice President, Corporate Development & IR
T: 604.628.1010
E: calibre@calibremining.com
W: www.calibremining.com
Calibre’s head office is located at Suite 1560, 200 Burrard St., Vancouver, British Columbia, V6C 3L6.
X / Facebook / LinkedIn / YouTube
The Toronto Stock Exchange has neither reviewed nor accepts responsibility for the adequacy or accuracy of this news release.
Notes
* Refer to the “Valentine Gold Project NI 43-101 Technical Report and Feasibility Study, Newfoundland & Labrador, Canada” dated November 30, 2022 and found on the Calibre website at www.calibremining.com and on SEDAR+ at www.sedarplus.ca.
(1) NON-IFRS FINANCIAL MEASURES
Calibre has included certain non-IFRS measures as discussed below. The Company believes that these measures, in addition to conventional measures prepared in accordance with IFRS, provide investors with an improved ability to evaluate the underlying performance of the Company. These non-IFRS measures are intended to provide additional information and should not be considered in isolation or as a substitute for measures of performance prepared in accordance with IFRS. These measures do not have any standardized meaning prescribed under IFRS, and therefore may not be comparable to other issuers.
TCC per Ounce of Gold: TCC include production costs, royalties, production taxes, refinery charges, and transportation charges. Production costs consist of mine site operating costs such as mining, processing, local administrative costs (including stock-based compensation related to mine operations) and current inventory write-downs, if any. Production costs are exclusive of depreciation and depletion, reclamation, capital and exploration costs. TCC are net of by-product silver sales and are divided by gold ounces sold to arrive at a per ounce figure.
AISC per Ounce of Gold: AISC is a performance measure that reflects the total expenditures that are required to produce an ounce of gold from current operations. While there is no standardized meaning of the measure across the industry, the Company’s definition is derived from the definition as set out by the World Gold Council in its guidance dated June 27, 2013, and November 16, 2018, respectively. The World Gold Council is a non-regulatory, non-profit organization established in 1987 whose members include global senior mining companies. The Company believes that this measure is useful to external users in assessing operating performance and the ability to generate free cash flow from operations.
Calibre defines AISC as the sum of TCC, corporate general and administrative expenses (excluding one-time charges), reclamation accretion related to current operations and amortization of asset retirement obligations (“ARO”), sustaining capital (capital required to maintain current operations at existing production levels), lease repayments, and exploration expenditures designed to increase resource confidence at producing mines. AISC excludes capital expenditures for significant improvements at existing operations deemed to be expansionary in nature, exploration and evaluation related to resource growth, rehabilitation accretion not related to current operations, financing costs, debt repayments, and taxes. Total AISC is divided by gold ounces sold to arrive at a per ounce figure
Average Realized Price per Ounce Sold: Average Realized Gold Price Per Ounce Sold is intended to enable management to understand the average realized price of gold sold in each reporting period after removing the impact of non-gold revenues and by-produce credits, which in the Company’s case are not significant, and to enable investors to understand the Company’s financial performance based on the average realized proceeds of selling gold production in the reporting period. Average Realized Gold Price Per Ounce Sold is a common performance measure that does not have any standardized meaning. The most directly comparable measure prepared in accordance with IFRS is revenue from gold sales.
Adjusted Net Earnings: Adjusted Net Earnings and Adjusted Net Earnings Per Share - Basic exclude a number of temporary or one-time items considered exceptional in nature and not related to the Company’s core operation of mining assets or reflective of recurring operating performance. Management believes Adjusted Net Earnings may assist investors and analysts to better understand the current and future operating performance of the Company’s core mining business. Adjusted Net Earnings and Adjusted Net Earnings Per Share do not have a standard meaning under IFRS. They should not be considered in isolation, or as a substitute for measures of performance prepared in accordance with IFRS and are not necessarily indicative of earnings from mine operations, earnings, or cash flow from operations as determined under IFRS.
Cash From Operating Activities Before Changes in Working Capital: Cash from Operating Activities before Changes in Working Capital is a non-IFRS measure with no standard meaning under IFRS, which is calculated by the Company as net cash from operating activities less working capital items. The Company believes that Net Cash from Operating Activities before Changes in Working Capital, which excludes these non-cash items, provides investors with the ability to better evaluate the operating cash flow performance of the Company.
Net Debt and Adjusted Net Debt: The Company believes that in addition to conventional measures prepared in accordance with IFRS, the Company and certain investors and analysts use net debt to evaluate the Company’s performance. Net debt does not have any standardized meaning prescribed under IFRS, and therefore it may not be comparable to similar measures employed by other companies. This measure is intended to provide additional information and should not be considered in isolation or as a substitute for measures of performances prepared in accordance with IFRS. Net debt is calculated as the sum of the current and non-current portions of loans and borrowings, net of the cash and cash equivalent balance as at the balance sheet date. Adjusted Net Debt is calculated as Net Debt less fair value and other non-cash adjustments that will not result in a cash outflow to the Company. The Company believes that Adjusted Net Debt provides a better understanding of the Company’s liquidity.
EBITDA and Adjusted EBITDA: The Company believes that certain investors use the EBITDA and the adjusted EBITDA (“Adjusted EBITDA”) measures to evaluate the Company’s performance and ability to generate operating cash flows to service debt and fund capital expenditures. EBITDA and Adjusted EBITDA do not have a standardized meaning as prescribed under IFRS and should not be considered in isolation or as a substitute for measures of performance prepared in accordance with IFRS. The Company calculates EBITDA as earnings or loss before taxes for the period excluding depreciation and depletion and finance costs. EBITDA excludes the impact of cash costs of financing activities and taxes and the effects of changes in working capital balances and therefore is not necessarily indicative of operating profit or cash flow from operations as determined under IFRS. Adjusted EBITDA is calculated by excluding one-off costs or credits relating to non-routine transactions from EBITDA that are not indicative of recurring operating performance. Management believes this additional information is useful to investors in understanding the Company’s ability to generate operating cash flow by excluding from the calculation these non-cash and cash amounts that are not indicative of the recurring performance of the underlying operations for the reporting periods.
Adjusted Net Debt to Adjusted EBITDA: The Adjusted Net Debt to Adjusted EBITDA measures provide investors and analysts with additional transparency about the Company’s liquidity position, specifically, the Company’s ability to generate sufficient operating cash flows to meet its mandatory interest obligations and pay down its outstanding debt balance in full at maturity. This measure is a Non-IFRS measure and it is intended to provide additional information and should not be considered in isolation or as a substitute for measures of performance prepared in accordance with IFRS. The calculation of Adjusted Net Debt is shown above.
TCC and AISC per Ounce of Gold Sold Reconciliations
The tables below reconcile TCC and AISC for the three months ended December 31, 2024, September 30, 2024, and December 31, 2023:
| Q4 2024 | |||||||||||
| (in thousands - except per ounce amounts) | Nicaragua | Nevada | Corporate | Consolidated | |||||||
| Production costs | $ | 77,823 | $ | 13,325 | $ | - | $ | 91,148 | |||
| Less: silver by-product revenue | (3,465 | ) | (28 | ) | - | (3,493 | ) | ||||
| Royalties and production taxes | 5,924 | 1,211 | - | 7,135 | |||||||
| Total cash costs | $ | 80,282 | $ | 14,508 | $ | - | $ | 94,790 | |||
| Corporate and general administration | - | - | 5,394 | 5,394 | |||||||
| Reclamation accretion and amortization of ARO | 1,093 | 148 | - | 1,241 | |||||||
| Sustaining capital(1) | 6,634 | 306 | - | 6,940 | |||||||
| Sustaining exploration | 167 | - | - | 167 | |||||||
| Total AISC | $ | 88,176 | $ | 14,962 | $ | 5,394 | $ | 108,532 | |||
| Gold ounces sold | 66,578 | 9,674 | - | 76,252 | |||||||
| Total Cash Costs | $ | 1,206 | $ | 1,500 | $ | - | $ | 1,243 | |||
| AISC | $ | 1,324 | $ | 1,547 | $ | - | $ | 1,423 | |||
1. Sustaining capital expenditures are shown in the Growth and Sustaining Capital table in the Q4 and Full Year 2024 MD&A dated December 31, 2024.
| Q3 2024 | |||||||||||
| (in thousands - except per ounce amounts) | Nicaragua | Nevada | Corporate | Consolidated | |||||||
| Production costs | $ | 57,466 | $ | 12,866 | $ | - | $ | 70,332 | |||
| Less: silver by-product revenue | (2,272 | ) | (1 | ) | - | (2,273 | ) | ||||
| Royalties and production taxes | 3,286 | 1,084 | - | 4,370 | |||||||
| Refinery, transportation and other | 332 | 51 | - | 383 | |||||||
| Total cash costs | $ | 58,811 | $ | 14,001 | $ | - | $ | 72,812 | |||
| Corporate and general administration | - | - | 3,702 | 3,702 | |||||||
| Reclamation accretion and amortization of ARO | 1,093 | 137 | - | 1,230 | |||||||
| Sustaining capital(1) | 7,499 | 3,351 | - | 10,849 | |||||||
| Sustaining exploration | 1,064 | - | - | 1,064 | |||||||
| Total AISC | $ | 68,467 | $ | 17,488 | $ | 3,702 | $ | 89,658 | |||
| Gold ounces sold | 36,427 | 9,649 | - | 46,076 | ||||
| Total Cash Costs | $ | 1,615 | $ | 1,451 | $ | - | $ | 1,580 |
| AISC | $ | 1,880 | $ | 1,813 | $ | - | $ | 1,946 |
1. Sustaining capital expenditures are shown in the Growth and Sustaining Capital table in the Q4 and Full Year 2024 MD&A dated December 31, 2024.
| Q4 2023 | |||||||||||
| (in thousands - except per ounce amounts) | Nicaragua | Nevada | Corporate | Consolidated | |||||||
| Production costs | $ | 68,902 | $ | 14,541 | $ | - | $ | 83,443 | |||
| Less: silver by-product revenue | (2,866 | ) | (26 | ) | - | (2,892 | ) | ||||
| Royalties and production taxes | 4,267 | 986 | - | 5,253 | |||||||
| Total cash costs | $ | 70,303 | $ | 15,501 | $ | - | $ | 85,804 | |||
| Corporate and general administration | - | - | 3,642 | 3,642 | |||||||
| Reclamation accretion and amortization of ARO | 602 | 182 | - | 784 | |||||||
| Sustaining capital(1) | 8,701 | 524 | - | 9,225 | |||||||
| Sustaining exploration | - | - | - | - | |||||||
| Total AISC | $ | 79,606 | $ | 16,207 | $ | 3,642 | $ | 99,455 | |||
| Gold ounces sold | 65,026 | 10,479 | - | 75,505 | |||||||
| Total Cash Costs | $ | 1,081 | $ | 1,479 | $ | - | $ | 1,136 | |||
| AISC | $ | 1,224 | $ | 1,547 | $ | - | $ | 1,317 | |||
1. Sustaining capital expenditures are shown in the Growth and Sustaining Capital table in the Q4 and Full Year 2024 MD&A dated December 31, 2024.
The tables below reconcile TCC and AISC for the years ended December 31, 2024 and 2023:
| 2024 | |||||||||||
| (in thousands - except per ounce amounts) | Nicaragua | Nevada | Corporate | Consolidated | |||||||
| Production costs | $ | 265,475 | $ | 48,064 | $ | - | $ | 313,539 | |||
| Less: silver by-product revenue | (11,432 | ) | (36 | ) | - | (11,468 | ) | ||||
| Royalties and production taxes | 18,030 | 3,861 | - | 21,891 | |||||||
| Total cash costs | $ | 272,073 | $ | 51,889 | $ | - | $ | 323,962 | |||
| Corporate and general administration | - | - | 17,702 | 17,702 | |||||||
| Reclamation accretion and amortization of ARO | 4,374 | 559 | - | 4,933 | |||||||
| Sustaining capital(1) | 29,019 | 6,837 | - | 35,856 | |||||||
| Sustaining exploration | 1,276 | - | - | 1,276 | |||||||
| Total AISC | $ | 306,742 | $ | 59,285 | $ | 17,702 | $ | 383,729 | |||
| Gold ounces sold | 207,224 | 35,228 | - | 242,452 | |||||||
| Total Cash Costs | $ | 1,313 | $ | 1,473 | $ | - | $ | 1,336 | |||
| AISC | $ | 1,480 | $ | 1,683 | $ | - | $ | 1,583 | |||
1. Sustaining capital expenditures are shown in the Growth and Sustaining Capital table in the Q4 and Full Year 2024 MD&A dated December 31, 2024.
| 2023 | |||||||||||
| (in thousands - except per ounce amounts) | Nicaragua | Nevada | Corporate | Consolidated | |||||||
| Production costs(1) | $ | 238,620 | $ | 55,542 | $ | - | $ | 294,162 | |||
| Less: silver by-product revenue | (11,136 | ) | (40 | ) | - | (11,176 | ) | ||||
| Royalties and production taxes | 16,876 | 3,667 | - | 20,543 | |||||||
| Total cash costs | $ | 244,360 | $ | 59,169 | $ | - | $ | 303,529 | |||
| Corporate and general administration | - | - | 12,284 | 12,284 | |||||||
| Reclamation accretion and amortization of ARO | 2,509 | 727 | - | 3,236 | |||||||
| Sustaining capital(2) | 27,438 | 1,332 | - | 28,770 | |||||||
| Sustaining exploration | 233 | - | - | 233 | |||||||
| Total AISC | $ | 274,540 | $ | 61,228 | $ | 12,284 | $ | 348,052 | |||
| Gold ounces sold | 242,126 | 41,399 | - | 283,525 | |||||||
| Total Cash Costs | $ | 1,009 | $ | 1,429 | $ | - | $ | 1,071 | |||
| AISC | $ | 1,134 | $ | 1,479 | $ | - | $ | 1,228 | |||
- Production costs include a
$0.7 million net realizable value reversal for the Pan mine. - Sustaining capital expenditures are shown in the Growth and Sustaining Capital table in the Q4 and Full Year 2024 MD&A dated December 31, 2024.
(2) AVERAGE REALIZED GOLD PRICE PER OUNCE SOLD
The following table provides a reconciliation of Average Realized Gold Price Per Ounce Sold to gold revenue per the consolidated statement of operations and comprehensive income for the reporting periods:
| Three Months Ended | Year Ended | |||||||||
| December 31, 2024 | September 30, 2024 | December 31, 2023 | December 31, 2024 | December 31, 2023 | ||||||
| Gold revenue (in thousands) | $ | 199,473 | $ | 111,411 | $ | 148,703 | $ | 574,395 | $ | 550,526 |
| Ounces of gold sold | 76,252 | 46,076 | 75,505 | 242,452 | 283,525 | |||||
| Average realized price per ounce sold(1) | $ | 2,616 | $ | 2,418 | $ | 1,969 | $ | 2,369 | $ | 1,942 |
1. Average realized gold price per ounce sold includes 6,900 ounces in Q4 2024 (6,900 ounces in Q3, 2024 and 18,400 ounces in 2024) at
(3) ADJUSTED NET EARNINGS
The following table provides a reconciliation of Adjusted Net Earnings and Adjusted Net Earnings Per Share to the consolidated statement of operations and comprehensive income for the reporting periods:
| Three Months Ended | Year Ended | |||||||||
| (in thousands – except per share) | December 31, 2024 | September 30, 2024 | December 31, 2023 | December 31, 2024 | December 31, 2023 | |||||
| Net earnings | $ | 16,661 | $ | 954 | $ | 12,001 | $ | 34,740 | $ | 82,025 |
| Adjusting items (net of tax): | ||||||||||
| Foreign exchange | 16,516 | - | - | 16,947 | - | |||||
| Loss on financial instruments | 115 | - | - | 853 | - | |||||
| Project assessment costs | 885 | 86 | 1,868 | 8,177 | 3,499 | |||||
| Nicaragua one-time expenses | 1,209 | 1,160 | - | 2,369 | - | |||||
| Pan Mine impairment & inventory write down | - | - | 6,158 | - | 5,542 | |||||
| Mineral property write-off | 3,164 | - | 2,278 | 3,178 | 2,601 | |||||
| Adjusted net earnings | $ | 38,550 | $ | 2,199 | $ | 22,305 | $ | 66,264 | $ | 96,667 |
| Weighted average number of shares outstanding | 838,038 | 796,103 | 458,094 | 766,477 | 456,347 | |||||
| Adjusted net earnings per share - basic | $ | 0.05 | $ | 0.00 | $ | 0.05 | $ | 0.09 | $ | 0.21 |
1. Adjusted from net earnings to derive Adjusted net earnings are one-time transaction costs primarily from the acquisition of Marathon, a write- off of a receivable from a contractor in Nicaragua, a write-off of certain exploration expenditures and the foreign exchange loss resulting from the translation of the Sprott Loan from US dollars to Canadian dollars which is the functional currency of Marathon.
(4) CASH FROM OPERATING ACTIVITIES BEFORE CHANGES IN WORKING CAPITAL
The following table provides a reconciliation of Cash from Operating Activities before Changes in Working Capital to the consolidated statement of cash flows for the reporting periods:
| Three Months Ended | Year Ended | ||||||||||||
| December 31, 2024 | September 30, 2024 | December 31, 2023 | December 31, 2024 | December 31, 2023 | |||||||||
| Net cash (used in) provided by operating activities | $ | 91,404 | $ | (17,833 | ) | $ | 60,330 | $ | 181,053 | $ | 201,106 | ||
| Working capital adjustments | (36,183 | ) | (22,003 | ) | 19,889 | (70,457 | ) | 22,948 | |||||
| Cash from operating activities before working capital | $ | 127,587 | $ | 4,170 | $ | 40,441 | $ | 251,510 | $ | 178,158 | |||
(5) NET DEBT and ADJUSTED NET DEBT
The following table provides a reconciliation of Net Debt and Adjusted Net Debt to the consolidated statement of financial position for the reporting periods:
| (in thousands, except ratio) | December 31, 2024 | September 30, 2024 | June 30, 2024 | December 31, 2023 | ||||||||||
| Current portion of debt | $ | 42,860 | $ | 11,966 | $ | 10,571 | $ | 9,597 | ||||||
| Non-current portion of debt | 293,556 | 317,287 | 316,744 | 10,509 | ||||||||||
| Total Debt | $ | 336,416 | $ | 329,253 | $ | 327,315 | $ | 20,106 | ||||||
| Less: Cash and cash equivalents (unrestricted) | (131,093 | ) | (115,800 | ) | (127,582 | ) | (86,160 | ) | ||||||
| Net Debt | $ | 205,323 | $ | 213,453 | $ | 199,733 | $ | (66,054 | ) | |||||
| Less: Fair value adjustment of Sprott Loan | (40,122 | ) | (35,108 | ) | (34,924 | ) | - | |||||||
| Adjusted Net Debt | $ | 165,201 | $ | 178,345 | $ | 164,809 | $ | (66,054 | ) | |||||
(6) EBITDA and ADJUSTED EBITDA
The following table provides a reconciliation of EBITDA and Adjusted EBITDA to the consolidated statement of operations and comprehensive income for the reporting periods:
| Three Months Ended | Year Ended | |||||||||||||
| (in thousands) | December 31, 2024 | September 30, 2024 | December 31, 2023 | December 31, 2024 | December 31, 2023 | |||||||||
| Earnings before taxes | $ | 34,015 | $ | 5,716 | $ | 21,515 | $ | 77,863 | $ | 133,091 | ||||
| Add back: Depreciation | 40,324 | 22,352 | 21,046 | 97,930 | 76,594 | |||||||||
| Add back: Finance costs, net | (883 | ) | 1,920 | 1,098 | 7,015 | 4,390 | ||||||||
| EBITDA | $ | 73,456 | $ | 29,988 | 43,659 | $ | 182,808 | $ | 214,075 | |||||
| Add back: Net loss/(gain) on financial instruments | 115 | 738 | - | 853 | - | |||||||||
| Add back: Project assessment costs | 885 | 86 | 1,868 | 8,177 | 3,498 | |||||||||
| Add back: Other expenses | 4,694 | 1,994 | 5,499 | 7,252 | 6,410 | |||||||||
| Add back: Pan impairment & inventory write down | - | - | 8,211 | - | 8,211 | |||||||||
| Add back: Non-cash and other adjustments | 16,423 | (3,862 | ) | (42 | ) | 16,737 | (148 | ) | ||||||
| Adjusted EBITDA | $ | 95,573 | $ | 28,943 | $ | 59,195 | $ | 215,827 | $ | 232,046 | ||||
1. Adjusted from EBITDA to derive Adjusted EBITDA are one-time transaction costs primarily from the acquisition of Marathon, a write-off of a receivable from a contractor in Nicaragua, a write-off of certain exploration expenditures and the foreign exchange loss resulting from the translation of the Sprott Loan from US dollars to Canadian dollars which is the functional currency of Marathon.
(7) ADJUSTED NET DEBT TO ADJUSTED EBITDA
The following table provides the reconciliation of Adjusted Net Debt to Adjusted EBITDA using the last twelve months of Adjusted EBITDA for the reporting periods:
| (in thousands, except ratio) | December 31, | September 30, | June 30, | December 31, | ||||||
| 2024 | 2024 | 2024 | 2023 | |||||||
| Adjusted Net Debt | $ | 165,201 | $ | 178,345 | $ | 164,809 | $ | (66,054 | ) | |
| Adjusted EBITDA (LTM) | 215,827 | 196,182 | 230,237 | 232,046 | ||||||
| Adjusted Net Debt to Adjusted EBITDA (LTM) ratio | 0.77 | 0.91 | 0.72 | (0.28 | ) | |||||
Cautionary Note Regarding Forward Looking Information
This new release contains “forward-looking information” and “forward-looking statements” (collectively “forward-looking statements”) within the meaning of applicable Canadian securities legislation. Except for statements of historical fact relating to Calibre, forward-looking information includes, but is not limited to, information with respect to the Company’s expected production from, and the further potential of, the Company’s properties; expected timing for the Company to complete its gold delivery obligations; expected timing for the first gold production from the Valentine mine; planned exploration and development programs at Valentine, El Limon, La Libertad and Pan Mine and the costs to conduct those programs; the results of any preliminary feasibility study, including, without limitation, life of mine, expected costs, production and net present value estimates; the results of any preliminary economic assessment; the Company’s ability to raise additional funds, as required; the future price of minerals, particularly gold; the estimation of mineral resources and mineral reserves; conclusions of economic evaluations; the realization of mineral reserve estimates; the timing and amount of estimated future production; costs of production, general and administrative and other costs; capital expenditures; success of exploration activities; mining or processing issues; currency rates; government regulation of mining operations; environmental risks; and outlook, guidance, and other forecasts.
Forward-looking statements are statements that are not historical facts and are generally, although not always, identified by words such as “expect”, “plan”, “anticipate”, “project”, “target”, “potential”, “schedule”, “forecast”, “budget”, “estimate”, “assume”, “intend”, “strategy”, “goal”, “objective”, “possible” or “believe” and similar expressions or their negative connotations, or that events or conditions “will”, “would”, “may”, “could”, “should” or “might” occur. All such forward-looking statements are based on the opinions and estimates of management as of the date such statements are made.
Forward-looking statements necessarily involve assumptions, risks and uncertainties, certain of which are beyond Calibre’s control, including risks associated with or related to: the volatility of metal prices; changes in tax laws; the dangers inherent in exploration, development and mining activities; the uncertainty of reserve and resource estimates; cost or other estimates; actual production, development plans and costs differing materially from the Company’s expectations; the ability to obtain and maintain any necessary permits, consents or authorizations required for mining activities; the current ongoing instability in Nicaragua and the ramifications thereof; environmental regulations or hazards and compliance with complex regulations associated with mining activities; the availability of financing and debt activities, including potential restrictions imposed on Calibre’s operations as a result thereof and the ability to generate sufficient cash flows; remote operations and the availability of adequate infrastructure; fluctuations in price and availability of energy and other inputs necessary for mining operations; shortages or cost increases in necessary equipment, supplies and labour; the reliance upon contractors, third parties and joint venture partners; the dependence on key personnel and the ability to attract and retain skilled personnel; the risk of an uninsurable or uninsured loss; adverse climate and weather conditions; litigation risk; competition with other mining companies; community support for Calibre’s operations, including risks related to strikes and the halting of such operations from time to time; conflicts with small scale miners; failures of information systems or information security threats; compliance with anti-corruption laws, sanctions or other similar measures; and those risk factors identified in the Risk Factors section found at the end of the Q4 and Full Year 2024 Management’s Discussion and Analysis.
Calibre’s forward-looking statements are based on the applicable assumptions and factors management considers reasonable as of the date hereof, based on the information available to management at such time. These assumptions and factors include, but are not limited to, assumptions and factors related to Calibre’s ability to carry on current and future operations, including: development and exploration activities; the timing, extent, duration and economic viability of such operations, including any mineral resources or reserves identified thereby; the accuracy and reliability of estimates, projections, forecasts, studies and assessments; the availability and cost of inputs; the price and market for outputs, including gold; the timely receipt of necessary approvals or permits; the ability to meet current and future obligations; the ability to obtain timely financing on reasonable terms when required; the current and future social, economic and political conditions; and other assumptions and factors generally associated with the mining industry.
Calibre’s forward-looking statements are based on the opinions and estimates of management and reflect their current expectations regarding future events and operating performance and speak only as of the date hereof. Calibre does not assume any obligation to update forward-looking statements if circumstances or management’s beliefs, expectations or opinions should change other than as required by applicable securities laws. There can be no assurance that forward-looking statements will prove to be accurate, and actual results, performance or achievements could differ materially from those expressed in, or implied by, these forward-looking statements. Accordingly, no assurance can be given that any events anticipated by the forward-looking statements will transpire or occur, or if any of them do, what benefits or liabilities Calibre will derive therefrom. For the reasons set forth above, undue reliance should not be placed on forward-looking statements.
Photos accompanying this announcement are available at
https://www.globenewswire.com/NewsRoom/AttachmentNg/c18bf787-819a-443f-b625-edde9d1c79bd
https://www.globenewswire.com/NewsRoom/AttachmentNg/1e8c4788-18d0-4298-9fdb-7b96949d5196
