Central Garden & Pet Announces Q1 Fiscal 2025 Financial Results
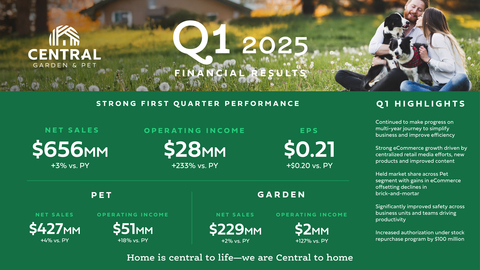
Central Garden & Pet (NASDAQ: CENTA) reported strong Q1 fiscal 2025 results with net sales increasing 3% to $656 million from $635 million year-over-year. The company's EPS significantly improved to $0.21 from $0.01 in the prior year.
The Pet segment saw a 4% increase in net sales to $427 million, while the Garden segment grew 2% to $229 million. Gross margin improved by 160 basis points to 29.8%, driven by productivity gains and moderating inflation. Operating income increased to $28 million from $8 million, with operating margin expanding by 300 basis points to 4.3%.
The company maintains its fiscal 2025 guidance for non-GAAP EPS of $2.20 or better, despite expected impacts from new tariffs and retail challenges. During Q1, Central repurchased 1.68 million shares worth $52 million, with $131 million remaining for future repurchases.
Central Garden & Pet (NASDAQ: CENTA) ha riportato solidi risultati per il primo trimestre dell'esercizio fiscale 2025, con vendite nette in aumento del 3% a 656 milioni di dollari, rispetto ai 635 milioni dell'anno precedente. L'EPS dell'azienda è migliorato significativamente a 0,21 dollari, rispetto a 0,01 dollari dell'anno passato.
Il segmento Pet ha registrato un aumento del 4% nelle vendite nette, raggiungendo i 427 milioni di dollari, mentre il segmento Garden è cresciuto del 2% a 229 milioni di dollari. Il margine lordo è migliorato di 160 punti base, raggiungendo il 29,8%, grazie ai guadagni di produttività e all'inflazione in moderazione. L'utile operativo è aumentato a 28 milioni di dollari, rispetto agli 8 milioni precedenti, con un margine operativo che si è espanso di 300 punti base, raggiungendo il 4,3%.
L'azienda mantiene la propria guida per l'esercizio fiscale 2025 per un EPS non-GAAP di 2,20 dollari o migliore, nonostante gli impatti previsti da nuove tariffe e sfide al dettaglio. Durante il primo trimestre, Central ha riacquistato 1,68 milioni di azioni per un valore di 52 milioni di dollari, con 131 milioni di dollari rimasti per riacquisti futuri.
Central Garden & Pet (NASDAQ: CENTA) informó resultados sólidos para el primer trimestre del año fiscal 2025, con ventas netas aumentando un 3% a 656 millones de dólares, en comparación con 635 millones el año anterior. El EPS de la compañía mejoró significativamente a 0,21 dólares, desde 0,01 dólares en el año anterior.
El segmento de mascotas vio un incremento del 4% en ventas netas, alcanzando los 427 millones de dólares, mientras que el segmento de jardín creció un 2% a 229 millones de dólares. El margen bruto mejoró en 160 puntos básicos, alcanzando el 29,8%, impulsado por ganancias de productividad y moderación en la inflación. El ingreso operativo aumentó a 28 millones de dólares, desde 8 millones, con un margen operativo que se expandió en 300 puntos básicos a 4,3%.
La compañía mantiene su guía fiscal para 2025 de un EPS no-GAAP de 2,20 dólares o mejor, a pesar de los impactos esperados por nuevas tarifas y desafíos minoristas. Durante el primer trimestre, Central recompró 1,68 millones de acciones por un valor de 52 millones de dólares, quedando 131 millones de dólares para recompras futuras.
Central Garden & Pet (NASDAQ: CENTA)는 2025 회계 연도의 1분기 강력한 실적을 보고했으며, 순 매출이 전년 대비 3% 증가하여 6억 5600만 달러에 도달했습니다. 회사의 EPS는 전년도 0.01달러에서 0.21달러로 크게 개선되었습니다.
애완동물 부문은 순 매출이 4% 증가하여 4억 2700만 달러에 도달했으며, 정원 부문은 2% 성장하여 2억 2900만 달러에 이르렀습니다. 총 마진은 생산성 향상과 완화된 인플레이션에 의해 160베이시스 포인트 증가하여 29.8%에 도달했습니다. 운영 소득은 800만 달러에서 2800만 달러로 증가했으며, 운영 마진은 300베이시스 포인트 확대되어 4.3%에 도달했습니다.
회사는 새로운 관세 및 소매 도전 과제의 예상 영향에도 불구하고 2025 회계 연도에 대한 비-GAAP EPS 가이던스를 2.20달러 이상으로 유지합니다. 1분기 중 Central은 5200만 달러에 달하는 168만 주를 재매입했으며, 향후 재매입을 위한 1억 3100만 달러가 남아 있습니다.
Central Garden & Pet (NASDAQ: CENTA) a rapporté de solides résultats pour le premier trimestre de l'exercice fiscal 2025, avec des ventes nettes en augmentation de 3% à 656 millions de dollars, contre 635 millions l'année précédente. Le bénéfice par action (EPS) de l'entreprise s'est considérablement amélioré, passant de 0,01 dollar l'an dernier à 0,21 dollar.
Le segment des animaux de compagnie a connu une augmentation de 4% des ventes nettes, atteignant 427 millions de dollars, tandis que le segment jardin a crû de 2% pour atteindre 229 millions de dollars. La marge brute s'est améliorée de 160 points de base pour atteindre 29,8%, grâce à des gains de productivité et à une inflation modérée. Le résultat d'exploitation a augmenté à 28 millions de dollars, contre 8 millions de dollars, avec une marge d'exploitation qui s'est élargie de 300 points de base à 4,3%.
L'entreprise maintient ses prévisions pour l'exercice fiscal 2025 avec un EPS non-GAAP de 2,20 dollars ou mieux, malgré les impacts attendus des nouvelles droits de douane et des défis du commerce de détail. Au cours du premier trimestre, Central a racheté 1,68 million d'actions pour une valeur de 52 millions de dollars, avec 131 millions de dollars restant pour des rachats futurs.
Central Garden & Pet (NASDAQ: CENTA) hat für das erste Quartal des Geschäftsjahres 2025 starke Ergebnisse gemeldet, mit einem Anstieg der Nettoumsätze um 3% auf 656 Millionen Dollar im Vergleich zu 635 Millionen im Vorjahr. Der Gewinn pro Aktie (EPS) des Unternehmens hat sich erheblich auf 0,21 Dollar verbessert, nach nur 0,01 Dollar im Vorjahr.
Im Haustiersegment gab es einen Anstieg der Nettoumsätze um 4% auf 427 Millionen Dollar, während das Gartensegment um 2% auf 229 Millionen Dollar wuchs. Die Bruttomarge verbesserte sich um 160 Basispunkte auf 29,8%, bedingt durch Produktivitätsgewinne und moderierende Inflationsraten. Der Betriebsgewinn stieg auf 28 Millionen Dollar, verglichen mit 8 Millionen Dollar, und die Betriebs marge erweiterte sich um 300 Basispunkte auf 4,3%.
Das Unternehmen hält an seiner Prognose für das Geschäftsjahr 2025 fest, die ein non-GAAP EPS von 2,20 Dollar oder besser vorsieht, trotz der erwarteten Auswirkungen neuer Zölle und Herausforderungen im Einzelhandel. Während des ersten Quartals hat Central 1,68 Millionen Aktien im Wert von 52 Millionen Dollar zurückgekauft, wobei noch 131 Millionen Dollar für zukünftige Rückkäufe zur Verfügung stehen.
- Net sales increased 3% YoY to $656 million
- EPS improved significantly to $0.21 from $0.01
- Gross margin improved 160 basis points to 29.8%
- Operating income grew to $28 million from $8 million
- Pet segment sales increased 4% to $427 million
- Garden segment turned profitable with $2 million operating income vs. $9 million loss
- Strong cash position of $618 million vs. $341 million YoY
- Expected impact from new tariffs
- Facing deflationary pressure in commodity businesses
- Challenges in brick-and-mortar retail landscape
- Cash used by operations of $69 million
Insights
Central Garden & Pet's Q1 FY25 results reveal a compelling narrative of operational excellence and strategic execution. The standout
Margin Enhancement Strategy: The
Capital Allocation Discipline: The
Conservative Guidance Strategy: Despite the strong Q1 performance, management's maintained guidance of
The Q1 results underscore Central Garden & Pet's market adaptability and strategic execution in both core segments. The Pet division's performance, with operating margin expanding to
The Garden segment's transformation is particularly noteworthy, with a
The company's maintained guidance acknowledges several market dynamics requiring careful navigation: shifting consumer behavior amid economic uncertainty, evolving brick-and-mortar retail landscape and potential impact of new tariffs. This balanced approach to market challenges while delivering operational improvements positions the company well for sustainable growth.
Fiscal 2025 Q1 net sales of
Fiscal 2025 Q1 EPS of
Maintains outlook for fiscal 2025 non-GAAP EPS of
CENTRAL GARDEN & PET ANNOUNCES Q1 FISCAL 2025 FINANCIAL RESULTS -- Fiscal 2025 Q1 net sales of
“The fiscal year is off to a strong start, driven by increased first quarter shipments, productivity gains and easing inflation, all contributing to growth in both our top and bottom line,” said Niko Lahanas, CEO of Central Garden & Pet. “We are encouraged by our first quarter performance, but recognize this period is typically our smallest quarter and benefited from the favorable timing of shipments and promotional activities. We remain confident in our fiscal year outlook and committed to executing our Central to Home strategy with excellence.”
Fiscal 2025 First Quarter Financial Results
Net sales increased
Gross profit was
SG&A expense was
Operating income grew to
Net interest expense was
Net income was
Adjusted EBITDA rose to
The effective tax rate was
Pet Segment Fiscal 2025 First Quarter Results
Net sales for the Pet segment increased
Pet segment operating income grew to
Pet segment adjusted EBITDA rose to
Garden Segment Fiscal 2025 First Quarter Results
Net sales for the Garden segment increased
Garden segment operating income was
Garden segment adjusted EBITDA was
Liquidity and Debt
The cash balance at the end of the quarter was
Total debt as of December 28, 2024 and December 30, 2023 was
Central repurchased 1.68 million shares or
Cost and Simplicity Program
Central continues to make significant progress in its multi-year Cost and Simplicity program, which encompasses a comprehensive pipeline of initiatives across procurement, manufacturing, logistics, portfolio management, and administrative costs. These efforts aim to streamline operations, enhance efficiency, and simplify the business across the organization.
Fiscal 2025 Guidance
Central continues to expect fiscal 2025 non-GAAP EPS to be
This outlook reflects the expected impact of the recently announced tariffs, deflationary pressure in certain commodity businesses, shifting consumer behavior amid macroeconomic and geopolitical uncertainty, and challenges within the brick-and-mortar retail landscape. This outlook excludes the potential impact of acquisitions, divestitures, or restructuring activities that may occur during fiscal 2025, including initiatives associated with the Cost and Simplicity program. Central anticipates fiscal 2025 capital expenditures to range between
Conference Call
Central's senior management will host a conference call today at 4:30 p.m. Eastern Time (1:30 p.m. Pacific Time) to review the fiscal 2025 first quarter results and provide a general business update. The call, along with related materials, can be accessed at http://ir.central.com.
Alternatively, to listen to the call by telephone, dial (201) 689-8345 (domestic and international) entering confirmation #13750497.
About Central Garden & Pet
Central Garden & Pet Company (NASDAQ: CENT) (NASDAQ: CENTA) understands home is central to life and has proudly nurtured happy and healthy homes for over 45 years. With fiscal 2024 net sales of
“Safe Harbor” Statement under the Private Securities Litigation Reform Act of 1995
The statements contained in this release which are not historical facts, including statements concerning productivity initiatives and earnings guidance for fiscal 2025, are forward-looking statements that are subject to risks and uncertainties that could cause actual results to differ materially from those set forth in or implied by forward-looking statements. All forward-looking statements are based upon Central's current expectations and various assumptions. There are a number of risks and uncertainties that could cause actual results to differ materially from the forward-looking statements contained in this release including, but not limited to, the following factors:
- economic uncertainty and other adverse macroeconomic conditions;
- impacts of tariffs or a trade war;
-
risks associated with international sourcing, including from
China ; - fluctuations in energy prices, fuel and related petrochemical costs;
- declines in consumer spending and the associated increased inventory risk;
- seasonality and fluctuations in our operating results and cash flow;
- adverse weather conditions and climate change;
- the success of our Central to Home strategy and our Cost and Simplicity program;
- fluctuations in market prices for seeds and grains and other raw materials, including the impact of significant declines in grass seed market prices on our inventory valuation;
- risks associated with new product introductions, including the risk that our new products will not produce sufficient sales to recoup our investment;
- dependence on a small number of customers for a significant portion of our business;
- consolidation trends in the retail industry;
- supply shortages in pet birds, small animals and fish;
- reductions in demand for our product categories;
- competition in our industries;
- continuing implementation of an enterprise resource planning information technology system;
- regulatory issues;
- potential environmental liabilities;
- access to and cost of additional capital;
- the impact of product recalls;
- risks associated with our acquisition strategy, including our ability to successfully integrate acquisitions and the impact of purchase accounting on our financial results;
- potential goodwill or intangible asset impairment;
- the potential for significant deficiencies or material weaknesses in internal control over financial reporting, particularly of acquired companies;
- our dependence upon our key executives;
- our ability to recruit and retain members of our management team and employees to support our businesses;
- potential costs and risks associated with actual or potential cyberattacks;
- our ability to protect our trademarks and other proprietary rights;
- litigation and product liability claims;
- the impact of new accounting regulations and the possibility our effective tax rate will increase as a result of future changes in the corporate tax rate or other tax law changes;
- potential dilution from issuance of authorized shares; and
- the voting power associated with our Class B stock.
These risks and others are described in more detail in Central’s Annual Report on Form 10-K for the fiscal year ended September 28, 2024, filed with the Securities and Exchange Commission on November 27, 2024. Central undertakes no obligation to publicly update these forward-looking statements to reflect new information, subsequent events or otherwise.
CENTRAL GARDEN & PET COMPANY CONDENSED CONSOLIDATED BALANCE SHEETS (in thousands, except share and per share amounts, unaudited) |
|||||||||||
ASSETS |
December 28, 2024 |
|
December 30, 2023 |
|
September 28, 2024 |
||||||
Current assets: |
|
|
|
|
|
||||||
Cash and cash equivalents |
$ |
618,020 |
|
|
$ |
341,419 |
|
|
$ |
753,550 |
|
Restricted cash |
|
14,649 |
|
|
|
14,200 |
|
|
|
14,853 |
|
Accounts receivable (less allowances of |
|
399,443 |
|
|
|
370,996 |
|
|
|
326,220 |
|
Inventories, net |
|
815,782 |
|
|
|
948,398 |
|
|
|
757,943 |
|
Prepaid expenses and other |
|
39,919 |
|
|
|
39,047 |
|
|
|
34,240 |
|
Total current assets |
|
1,887,813 |
|
|
|
1,714,060 |
|
|
|
1,886,806 |
|
Plant, property and equipment, net |
|
370,673 |
|
|
|
389,440 |
|
|
|
379,166 |
|
Goodwill |
|
551,361 |
|
|
|
546,436 |
|
|
|
551,361 |
|
Other intangible assets, net |
|
465,914 |
|
|
|
489,058 |
|
|
|
473,280 |
|
Operating lease right-of-use assets |
|
195,775 |
|
|
|
177,499 |
|
|
|
205,137 |
|
Other assets |
|
64,319 |
|
|
|
105,841 |
|
|
|
57,689 |
|
Total |
$ |
3,535,855 |
|
|
$ |
3,422,334 |
|
|
$ |
3,553,439 |
|
LIABILITIES AND EQUITY |
|
|
|
|
|
||||||
Current liabilities: |
|
|
|
|
|
||||||
Accounts payable |
$ |
221,903 |
|
|
$ |
212,193 |
|
|
$ |
212,606 |
|
Accrued expenses |
|
262,952 |
|
|
|
230,477 |
|
|
|
245,226 |
|
Current lease liabilities |
|
58,623 |
|
|
|
51,035 |
|
|
|
57,313 |
|
Current portion of long-term debt |
|
173 |
|
|
|
466 |
|
|
|
239 |
|
Total current liabilities |
|
543,651 |
|
|
|
494,171 |
|
|
|
515,384 |
|
Long-term debt |
|
1,190,271 |
|
|
|
1,189,093 |
|
|
|
1,189,809 |
|
Long-term lease liabilities |
|
163,271 |
|
|
|
136,708 |
|
|
|
173,086 |
|
Deferred income taxes and other long-term obligations |
|
118,831 |
|
|
|
149,776 |
|
|
|
117,615 |
|
Equity: |
|
|
|
|
|
||||||
Common stock, |
|
107 |
|
|
|
111 |
|
|
|
111 |
|
Class A common stock, |
|
531 |
|
|
|
545 |
|
|
|
544 |
|
Class B stock, |
|
16 |
|
|
|
16 |
|
|
|
16 |
|
Additional paid-in capital |
|
586,777 |
|
|
|
594,512 |
|
|
|
598,098 |
|
Retained earnings |
|
936,344 |
|
|
|
858,817 |
|
|
|
959,511 |
|
Accumulated other comprehensive loss |
|
(4,661 |
) |
|
|
(2,112 |
) |
|
|
(2,626 |
) |
Total Central Garden & Pet Company shareholders’ equity |
|
1,519,114 |
|
|
|
1,451,889 |
|
|
|
1,555,654 |
|
Noncontrolling interest |
|
717 |
|
|
|
697 |
|
|
|
1,891 |
|
Total equity |
|
1,519,831 |
|
|
|
1,452,586 |
|
|
|
1,557,545 |
|
Total |
$ |
3,535,855 |
|
|
$ |
3,422,334 |
|
|
$ |
3,553,439 |
|
CENTRAL GARDEN & PET COMPANY CONDENSED CONSOLIDATED STATEMENTS OF OPERATIONS (in thousands, except per share amounts, unaudited) |
|||||||
|
Three Months Ended |
||||||
|
December 28, 2024 |
|
December 30, 2023 |
||||
Net sales |
$ |
656,436 |
|
|
$ |
634,533 |
|
Cost of goods sold |
|
460,737 |
|
|
|
455,688 |
|
Gross profit |
|
195,699 |
|
|
|
178,845 |
|
Selling, general and administrative expenses |
|
167,707 |
|
|
|
170,433 |
|
Operating income |
|
27,992 |
|
|
|
8,412 |
|
Interest expense |
|
(14,470 |
) |
|
|
(14,316 |
) |
Interest income |
|
6,740 |
|
|
|
4,609 |
|
Other income (expense) |
|
(1,717 |
) |
|
|
993 |
|
Income (Loss) before income taxes and noncontrolling interest |
|
18,545 |
|
|
|
(302 |
) |
Income tax expense (benefit) |
|
4,364 |
|
|
|
(869 |
) |
Income including noncontrolling interest |
|
14,181 |
|
|
|
567 |
|
Net income attributable to noncontrolling interest |
|
172 |
|
|
|
137 |
|
Net income attributable to Central Garden & Pet Company |
$ |
14,009 |
|
|
$ |
430 |
|
Net income per share attributable to Central Garden & Pet Company: |
|
|
|
||||
Basic |
$ |
0.22 |
|
|
$ |
0.01 |
|
Diluted |
$ |
0.21 |
|
|
$ |
0.01 |
|
Weighted average shares used in the computation of net income per share: |
|
|
|
||||
Basic |
|
64,552 |
|
|
|
65,415 |
|
Diluted |
|
65,449 |
|
|
|
66,785 |
|
CENTRAL GARDEN & PET COMPANY CONDENSED CONSOLIDATED STATEMENTS OF CASH FLOWS (in thousands, unaudited) |
|||||||
|
Three Months Ended |
||||||
|
December 28, 2024 |
|
December 30, 2023 |
||||
Cash flows from operating activities: |
|
|
|
||||
Net income |
$ |
14,181 |
|
|
$ |
567 |
|
Adjustments to reconcile net income to net cash used by operating activities: |
|
|
|
||||
Depreciation and amortization |
|
21,934 |
|
|
|
22,545 |
|
Amortization of deferred financing costs |
|
673 |
|
|
|
666 |
|
Non-cash lease expense |
|
15,131 |
|
|
|
12,772 |
|
Stock-based compensation |
|
5,510 |
|
|
|
6,021 |
|
Deferred income taxes |
|
1,276 |
|
|
|
1,498 |
|
Other operating activities |
|
(600 |
) |
|
|
(727 |
) |
Change in assets and liabilities (excluding businesses acquired): |
|
|
|
||||
Accounts receivable |
|
(73,439 |
) |
|
|
(32,952 |
) |
Inventories |
|
(59,356 |
) |
|
|
(92,808 |
) |
Prepaid expenses and other assets |
|
(7,522 |
) |
|
|
(5,275 |
) |
Accounts payable |
|
10,342 |
|
|
|
19,145 |
|
Accrued expenses |
|
17,450 |
|
|
|
9,533 |
|
Other long-term obligations |
|
(73 |
) |
|
|
3,310 |
|
Operating lease liabilities |
|
(14,339 |
) |
|
|
(14,079 |
) |
Net cash used by operating activities |
|
(68,832 |
) |
|
|
(69,784 |
) |
Cash flows from investing activities: |
|
|
|
||||
Additions to plant, property and equipment |
|
(6,100 |
) |
|
|
(10,127 |
) |
Payments to acquire companies, net of cash acquired |
|
(3,318 |
) |
|
|
(59,498 |
) |
Investments |
|
— |
|
|
|
(850 |
) |
Net cash used in investing activities |
|
(9,418 |
) |
|
|
(70,475 |
) |
Cash flows from financing activities: |
|
|
|
||||
Repayments of long-term debt |
|
(78 |
) |
|
|
(85 |
) |
Repurchase of common stock, including shares surrendered for tax withholding |
|
(54,022 |
) |
|
|
(6,775 |
) |
Payment of contingent consideration liability |
|
— |
|
|
|
(25 |
) |
Distribution to noncontrolling interest |
|
(1,346 |
) |
|
|
(900 |
) |
Net cash used by financing activities |
|
(55,446 |
) |
|
|
(7,785 |
) |
Effect of exchange rate changes on cash, cash equivalents and restricted cash |
|
(2,038 |
) |
|
|
790 |
|
Net decrease in cash, cash equivalents and restricted cash |
|
(135,734 |
) |
|
|
(147,254 |
) |
Cash, cash equivalents and restricted cash at beginning of period |
|
768,403 |
|
|
|
502,873 |
|
Cash, cash equivalents and restricted cash at end of period |
$ |
632,669 |
|
|
$ |
355,619 |
|
Supplemental information: |
|
|
|
||||
Cash paid for interest |
$ |
19,903 |
|
|
$ |
19,756 |
|
Lease liabilities arising from obtaining right-of-use assets |
$ |
4,789 |
|
|
$ |
13,170 |
|
Use of Non-GAAP Financial Measures
We report our financial results in accordance with generally accepted accounting principles ("GAAP"). However, to supplement the financial results prepared in accordance with GAAP, we use non-GAAP financial measures including adjusted EBITDA. Management uses adjusted EBITDA in making financial, operating and planning decisions and in evaluating our performance. Management believes this non-GAAP financial measure may be useful to investors in their assessment of our ongoing operating performance and provide additional meaningful comparisons between current results and results in prior operating periods. While Management believes that this non-GAAP measure is useful supplemental information, such adjusted results are not intended to replace our GAAP financial results and should be read in conjunction with those GAAP results.
Adjusted EBITDA is defined by us as income before income tax, net other expense, net interest expense and depreciation and amortization and stock-based compensation expense (or operating income plus depreciation and amortization expense and stock-based compensation expense). We present adjusted EBITDA because we believe that adjusted EBITDA is a useful supplemental measure in evaluating the cash flows and performance of our business and provides greater transparency into our results of operations. Adjusted EBITDA is used by our management to perform such evaluations. Adjusted EBITDA should not be considered in isolation or as a substitute for cash flow from operations, income from operations or other income statement measures prepared in accordance with GAAP. We believe that adjusted EBITDA is frequently used by investors, securities analysts and other interested parties in their evaluation of companies, many of which present adjusted EBITDA when reporting their results. Other companies may calculate adjusted EBITDA differently and it may not be comparable.
The reconciliations of adjusted EBITDA to the most directly comparable financial measures calculated and presented in accordance with GAAP are shown in the tables below.
| Adjusted EBITDA Reconciliation |
|
GAAP to Non-GAAP Reconciliation |
|||||||||||
|
|
Three Months Ended December 28, 2024 |
|||||||||||
|
|
Pet |
|
Garden |
|
Corporate |
|
Total |
|||||
|
|
(in thousands) |
|||||||||||
Net income attributable to Central Garden & Pet Company |
|
$ |
— |
|
$ |
— |
|
$ |
— |
|
|
$ |
14,009 |
Interest expense, net |
|
|
— |
|
|
— |
|
|
— |
|
|
|
7,730 |
Other expense |
|
|
— |
|
|
— |
|
|
— |
|
|
|
1,717 |
Income tax expense |
|
|
— |
|
|
— |
|
|
— |
|
|
|
4,364 |
Net income attributable to noncontrolling interest |
|
|
— |
|
|
— |
|
|
— |
|
|
|
172 |
Income (loss) from operations |
|
|
51,257 |
|
|
2,423 |
|
|
(25,688 |
) |
|
|
27,992 |
Depreciation & amortization |
|
|
10,080 |
|
|
11,131 |
|
|
723 |
|
|
|
21,934 |
Noncash stock-based compensation |
|
|
— |
|
|
— |
|
|
5,510 |
|
|
|
5,510 |
Adjusted EBITDA |
|
$ |
61,337 |
|
$ |
13,554 |
|
$ |
(19,455 |
) |
|
$ |
55,436 |
Adjusted EBITDA Reconciliation |
|
GAAP to Non-GAAP Reconciliation |
|||||||||||||
|
|
Three Months Ended December 30, 2023 |
|||||||||||||
|
|
Pet |
|
Garden |
|
Corporate |
|
Total |
|||||||
|
|
(in thousands) |
|||||||||||||
Net income attributable to Central Garden & Pet Company |
|
$ |
— |
|
$ |
— |
|
|
$ |
— |
|
|
$ |
430 |
|
Interest expense, net |
|
|
— |
|
|
— |
|
|
|
— |
|
|
|
9,707 |
|
Other income |
|
|
— |
|
|
— |
|
|
|
— |
|
|
|
(993 |
) |
Income tax benefit |
|
|
— |
|
|
— |
|
|
|
— |
|
|
|
(869 |
) |
Net income attributable to noncontrolling interest |
|
|
— |
|
|
— |
|
|
|
— |
|
|
|
137 |
|
Income (loss) from operations |
|
|
43,388 |
|
|
(8,886 |
) |
|
|
(26,090 |
) |
|
|
8,412 |
|
Depreciation & amortization |
|
|
10,798 |
|
|
11,006 |
|
|
|
741 |
|
|
|
22,545 |
|
Noncash stock-based compensation |
|
|
— |
|
|
— |
|
|
|
6,021 |
|
|
|
6,021 |
|
Adjusted EBITDA |
|
$ |
54,186 |
|
$ |
2,120 |
|
|
$ |
(19,328 |
) |
|
$ |
36,978 |
|
View source version on businesswire.com: https://www.businesswire.com/news/home/20250205965879/en/
Investor Relations Contact
Friederike Edelmann
VP, Investor Relations & Corporate Sustainability
fedelmann@central.com | (925) 412-6726
Source: Central Garden & Pet Company