Coeur Reports Year-End 2024 Mineral Reserves and Resources and Provides Palmarejo Exploration Update
Substantial resource increases at Wharf and Palmarejo
Kensington’s reserve-based mine life extended to five years – a doubling in three years
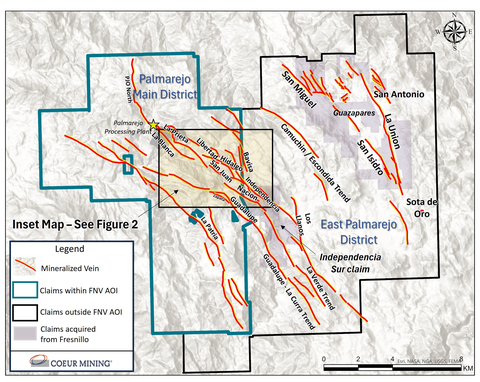
Figure 1: Palmarejo district map (Photo: Business Wire)
Measured and indicated mineral resources totaled 3.7 million ounces of gold, 198.9 million ounces of silver, 1,517 million pounds of zinc and 768.7 million pounds of lead. Gold measured and indicated mineral resources increased
Inferred mineral resources were 2.3 million ounces of gold, 106.1 million ounces of silver, 481.8 million pounds of zinc and 199.8 million pounds of lead. Both gold and silver inferred mineral resources increased by
Key Highlights1
- Wharf gold measured and indicated mineral resources more than doubled; gold inferred mineral resources more than tripled – Mine optimization initiatives drove an increase in gold measured and indicated mineral resources by 521,000 ounces and gold inferred mineral resources by 321,000 ounces, positioning Wharf for significant expected mine life extensions as infill drilling accelerates in 2025
-
Kensington’s gold proven and probable mineral reserves increased
22% to 500,000 ounces – The nearly-completed multi-year underground development and drilling investment program providesKensington with greater operational flexibility and a substantially longer mine life, which has doubled since the program commenced in 2022 to the current five years. Kensington’s measured and indicated mineral resources of gold increased over8% year-over-year -
Second consecutive year of strong resource expansion at Palmarejo – A sustained emphasis on growing the pipeline of silver and gold inferred mineral resources led to an
84% increase in silver inferred mineral resources and a69% increase in gold inferred mineral resources, which bodes well for future potential mine life extensions -
Expansion drilling at Palmarejo continues to demonstrate growth potential – Expansion drilling in the
Hidalgo corridor continues to return positive results directly impacting inferred mineral resources and highlight the excellent potential for future reserve growth. Specifically, theHidalgo ,Libertad andSan Juan deposits located immediately northwest of theIndependencia deposit were substantially extended and remain open along strike and down dip. Notable estimated true thickness intercepts from the program include:
- Hole HGDH_180 returned 14.2 feet at 0.17 ounces per ton (“oz/t”) gold and 13.5 oz/t silver (4.3 meters at 5.7 grams per tonne (“g/t”) gold and 463.3 g/t silver)
- Hole HGDH_181 returned 66.3 feet at 0.06 oz/t gold and 5.9 oz/t silver (20.2 meters at 2.1 g/t gold and 202.4 g/t silver)
- Hole HGDH_182A returned 31.2 feet of 0.08 oz/t gold and 6.6 oz/t silver (10.5 meters at 2.9 g/t gold and 226.2 g/t silver)
- Hole HGDH_189 returned 2.7 feet at 0.83 oz/t gold and 96.8 oz/t silver (0.6 meters at 28.4 g/t gold and 3,320.0 g/t silver)
- Hole HGDH_198 returned 13.1 feet at 0.05 oz/t gold and 11.6 oz/t silver (4.0 meters at 1.6 g/t gold and 396.9 g/t silver)
- Hole HGDH_159 returned 1.6 feet at 0.42 oz/t gold and 37.6 oz/t silver (0.5 meters at 14.4 g/t gold and 1,290.0 g/t silver)
- Hole HGDH_162 returned 9.1 feet of 0.03 oz/t gold and 2.7 oz.t silver (2.8 meters at 1.2 g/t gold and 253.3 g/t silver)
- Hole HGDH_169 returned 7.5 feet at 0.01 oz/t gold and 9.3 oz/t silver (2.3 meters at 0.4 g/t gold and 318.3 g/t silver)
“Coeur’s sustained focus on brownfield exploration investment has been incredibly successful and continues to be a key differentiator. Over the past five years, our gold and silver mineral reserves have increased
“At Rochester, the exploration team successfully replaced 2024 production. With a 16-year mine life, the focus remains on drilling higher-grade, near mine targets. Coupled with Kensington’s impressive reserve growth and the substantial resource growth at Wharf, Coeur’s core
Coeur’s gold and silver price assumptions for year-end 2024 reserves were
The Company increased its gold and silver price assumptions for year-end 2024 resources from
For a complete table of all drill results, please refer to the following link: https://www.coeur.com/files/doc_downloads/2025/02/2025-02-18-Exploration-Update-Appendix-Final.pdf. Please see the “Cautionary Statements” section for additional information regarding drill results.
Palmarejo 2024 Exploration Update
Coeur’s 2024 exploration program at Palmarejo focused on step-out and expansion drilling around near-mine veins to build inferred resource ounces and support mine life additions. The program was heavily focused on
Drilling along the
Near Mine Exploration in Palmarejo Main District
At
Drilling along strike and to the northwest of
At the
Exploration Outside of the Area of Interest
Prospecting and mapping of the Independencia Sur claim (see figure 2), which was recently acquired from
District work in the area outside the encumbered gold stream accelerated significantly in 2024. Mapping and sampling completed at the
About Coeur
Coeur Mining, Inc. is a
Cautionary Statements
This news release contains forward-looking statements within the meaning of securities legislation in
The scientific and technical information concerning our mineral projects in this news release have been reviewed and approved by a “qualified person” under Item 1300 of Regulation S-K under the Securities Exchange Act of 1934, as amended (“SK 1300”), namely our Senior Director, Technical Services, Christopher Pascoe. For a description of the key assumptions, parameters and methods used to estimate mineral reserves and mineral resources for Coeur’s material properties included in this news release, as well as data verification procedures and a general discussion of the extent to which the estimates may be affected by any known environmental, permitting, legal, title, taxation, sociopolitical, marketing or other relevant factors, please review the Technical Report Summaries for each of the Company’s material properties which are available at www.sec.gov.
Coeur’s public disclosures, including disclosures of mineral reserves and resources, are governed by the
Notes
The potential quantity and grade for the deposits described herein are conceptual in nature. There is insufficient exploratory work to define a mineral resource and it is uncertain if further exploration will result in the applicable target being delineated as a mineral resource.
- 2024 reserves and resources were determined in accordance with Item 1300 of SEC Regulation S-K. Reserves and resources for certain prior periods were determined in accordance with Canadian National Instrument 43-101. Both sets of reporting standards have similar goals in terms of conveying an appropriate level of confidence in the disclosures being reported, but the standards embody slightly different approaches and definitions.
- For a complete table of all drill results included in this release, please refer to the following link: https://www.coeur.com/files/doc_downloads/2025/02/2025-02-18-Exploration-Update-Appendix-Final.pdf.
- Rounding of grades, to significant figures, may result in apparent differences.
2024 Year-End Proven and Probable Reserves |
||||||
| Grade | Contained | |||||
| Gold | Silver | Gold | Silver | |||
| Short tons | (oz/t) | (oz/t) | (oz) | (oz) | ||
| PROVEN RESERVES | ||||||
| Las Chispas | 787,000 |
0.150 |
15.99 |
118,000 |
12,586,000 |
|
| Palmarejo | 3,473,000 |
0.059 |
3.94 |
205,000 |
13,667,000 |
|
468,432,000 |
0.002 |
0.37 |
1,116,000 |
172,408,000 |
||
1,340,000 |
0.186 |
- |
249,000 |
- |
||
| Wharf | 6,563,000 |
0.030 |
- |
199,000 |
- |
|
| Total | 480,595,000 |
0.004 |
0.41 |
1,887,000 |
198,660,000 |
|
| PROBABLE RESERVES | ||||||
| Las Chispas | 2,700,000 |
0.089 |
7.75 |
239,000 |
20,931,000 |
|
| Palmarejo | 8,373,000 |
0.057 |
3.86 |
475,000 |
32,307,000 |
|
59,123,000 |
0.003 |
0.32 |
182,000 |
18,632,000 |
||
1,427,000 |
0.177 |
- |
252,000 |
- |
||
| Wharf | 22,993,000 |
0.024 |
- |
558,000 |
- |
|
| Total | 94,615,000 |
0.018 |
0.76 |
1,706,000 |
71,870,000 |
|
| PROVEN AND PROBABLE RESERVES | ||||||
| Las Chispas | 3,486,000 |
0.102 |
9.61 |
357,000 |
33,516,000 |
|
| Palmarejo | 11,845,000 |
0.057 |
3.88 |
681,000 |
45,974,000 |
|
527,555,000 |
0.002 |
0.36 |
1,298,000 |
191,040,000 |
||
2,768,000 |
0.181 |
- |
501,000 |
- |
||
| Wharf | 29,556,000 |
0.026 |
- |
757,000 |
- |
|
| Total | 575,211,000 |
0.006 |
0.47 |
3,593,000 |
270,530,000 |
|
Notes to above Mineral Reserves:
- Certain definitions: The term “reserve” means that part of a mineral deposit that can be economically and legally extracted or produced at the time of the reserve determination. The term “proven (measured) reserves” means reserves for which (a) quantity is computed from dimensions revealed in outcrops, trenches, workings or drill holes, grade and/or quality are computed from the results of detailed sampling; and (b) the sites for inspection, sampling and measurements are spaced so closely and the geologic character is sufficiently defined that size, shape, depth and mineral content of reserves are well established. The term “probable (indicated) reserves” means reserves for which quantity and grade and/or quality are computed from information similar to that used for proven (measured) reserves, but the sites for inspection, sampling and measurement are farther apart or are otherwise less adequately spaced. The degree of assurance, although lower than that for proven (measured) reserves, is high enough to assume continuity between points of observation. The term “cutoff grade” means the lowest grade of mineralized material considered economic to process. Cutoff grades vary between deposits depending upon prevailing economic conditions, mineability of the deposit, by-products, amenability of the mineralized material to silver or gold extraction and type of milling or leaching facilities available.
- The Mineral Reserve estimates are current as of December 31, 2024, are reported using the definitions in Item 1300 of Regulation S-K and were prepared by the Company’s technical staff.
-
Assumed metal prices for 2024 Mineral Reserves were
$23.50 $1,800 $1.15 $0.95 Kensington at$2,000 -
Palmarejo Mineral Reserve estimates use the following key input parameters: assumption of conventional longhole underground mining; reported above a variable gold equivalent cut-off grade that ranges from 2.13–2.45 g/t AuEq and an incremental development cut-off grade 1.05 g/t AuEq; metallurgical recovery assumption of
92.0% for gold and83.0% for silver; mining dilution assumes 0.3–1.5 meter of hanging/foot wall waste dilution; mining loss of15% was applied; variable mining costs that range fromUS .67–US$57 $74.45 /tonne, surface haulage costs ofUS /tonne, process costs of$4.29 US /tonne, general and administrative costs of$31.06 US /tonne, and surface/auxiliary support costs of$15.95 US /tonne. Excludes the impact of the Franco-Nevada gold stream agreement at Palmarejo in calculation of Mineral Reserves. No assurances can be given that all mineral reserves will be mined, as mineralized material that may qualify as reserves under applicable standards by virtue of having positive economics may not generate attractive enough returns to be included in our mine plans, due to factors such as the impact of the gold stream at Palmarejo. As a result, we may elect not to mine portions of the mineralized material reported as reserves.$4.42 -
Rochester Mineral Reserve estimates are tabulated within a confining pit design and use the following input parameters:
Rochester oxide variable recovery Au = 77.7–85.9% and Ag = 59.4-61.0% ;Rochester sulfide variable recovery Au = 15.2–77.7% and Ag = 0.0–59.4% ; with a net smelter return cutoff of$3.76 US /ton sulfide; Nevada Packard oxide recovery Au =$3.86 92.0% and Ag =61.0% ; with a net smelter return cutoff of$4.24 63.9% and Ag =39.5% ; with a net smelter return cutoff of$4.53 -
Kensington Mineral Reserve estimates use the following key input parameters: assumption of conventional underground mining; gold price of
$2,000 94.2% ; gold payability of97.5% ; mining dilution of 15-20% ; mining loss of12% was applied; mining costs ofUS /ton mined; process costs of$116.09 US /ton processed; general and administrative costs of$55.14 US /ton processed; sustaining capital$53.18 US /ton processed; and concentrate refining and shipping costs of$4.50 US /oz sold.$97.48 -
Wharf Mineral Reserve estimates use the following key input parameters: assumption of conventional open pit mining; reported above a gold cut-off grade of 0.010 oz/ton Au; average metallurgical recovery assumption of
78.0% ; royalty burden ofUS /oz Au; pit slope angles that vary from 34–50º; mining costs of$140.40 US /ton mined, and process costs of$2.56 US /ton processed (includes general & administrative and sustaining capital costs).$12.02 -
Las Chispas Mineral Reserve estimates uses the following key input parameters: assumption of conventional underground mining; reported above a silver cut-off grade of 250 g / tonne silver equivalent and an incremental development cut-off grade of 63 g / tonne AgEq; metallurgical recovery assumption of
97.5% for silver and98.0% for gold; mining dilution assumes5% for development, 1 meter to 1.5 meters of ELOS (0.5 m – 1.0 m of hanging wall and 0.25 m – 0.5 m of footwall dilution) depending on geotechnical conditions in each stoping location, 0.2 meter ELOS (0.1 m of hanging wall and 0.1 m of footwall dilution) for cut and fill, 0.4 meter ELOS (0.2 m of hanging wall and 0.2 m of footwall dilution), 0.25 m for each exposed backfill floor, and 0.5 m for each exposed backfill wall; mining loss of2% for development and5% for stoping was applied, additional losses have been included to account for the required pillars in uphole stopes that cannot be filled; variable production mining costs that range fromUS .06–US$58 $239.51 /tonne, development mining costs ofUS /tonne, process costs of$27.40 US /tonne, site general and administrative costs of$45.72 US /tonne, underground general and administrative costs of$20.70 US /tonne, and sustaining capital costs of$12.81 US /tonne.$7.64 - Rounding of short tons, grades, and troy ounces, as required by reporting guidelines, may result in apparent differences between tons, grades, and contained metal contents.
2024 Year-End Measured and Indicated Resources |
|||||||||
| Grade | Contained | ||||||||
| Gold | Silver | Zinc | Lead | Gold | Silver | Zinc | Lead | ||
| Short tons | (oz/t) | (oz/t) | (%) | (%) | (oz) | (oz) | (lbs) | (lbs) | |
| MEASURED RESOURCES | |||||||||
| Las Chispas | 116,000 |
0.302 |
31.23 |
- |
- |
35,000 |
3,623,000 |
- |
- |
| Palmarejo | 6,996,000 |
0.068 |
4.59 |
- |
- |
474,000 |
32,138,000 |
- |
- |
82,371,000 |
0.002 |
0.28 |
- |
- |
144,000 |
23,383,000 |
- |
- |
|
2,150,000 |
0.254 |
- |
- |
- |
546,000 |
- |
- |
- |
|
| Wharf | 10,180,000 |
0.017 |
- |
- |
- |
175,000 |
- |
- |
- |
| Silvertip | 734,000 |
- |
10.56 |
|
|
- |
7,749,000 |
145,703,000 |
115,648,000 |
| Total | 102,547,000 |
0.013 |
0.65 |
1,374,000 |
66,894,000 |
145,703,000 |
115,648,000 |
||
| INDICATED RESOURCES | |||||||||
| Las Chispas | 1,094,000 |
0.110 |
9.87 |
- |
- |
120,000 |
10,798,000 |
- |
- |
| Palmarejo | 15,368,000 |
0.062 |
3.76 |
- |
- |
949,000 |
57,777,000 |
- |
- |
40,402,000 |
0.003 |
0.34 |
- |
- |
116,000 |
13,541,000 |
- |
- |
|
1,450,000 |
0.234 |
- |
- |
- |
340,000 |
- |
- |
- |
|
| Wharf | 49,155,000 |
0.017 |
- |
- |
- |
845,000 |
- |
- |
- |
| Silvertip | 6,418,000 |
- |
7.78 |
|
|
- |
49,919,000 |
1,371,074,000 |
653,008,000 |
| Total | 113,887,000 |
0.021 |
1.16 |
2,370,000 |
132,035,000 |
1,371,074,000 |
653,008,000 |
||
| MEASURED AND INDICATED RESOURCES | |||||||||
| Las Chispas | 1,211,000 |
0.129 |
11.91 |
- |
- |
156,000 |
14,421,000 |
- |
- |
| Palmarejo | 22,363,000 |
0.064 |
4.02 |
- |
- |
1,423,000 |
89,915,000 |
- |
- |
122,773,000 |
0.002 |
0.30 |
- |
- |
260,000 |
36,924,000 |
- |
- |
|
3,600,000 |
0.246 |
- |
- |
- |
886,000 |
- |
- |
- |
|
| Wharf | 59,335,000 |
0.017 |
- |
- |
- |
1,019,000 |
- |
- |
- |
| Silvertip | 7,152,000 |
- |
8.06 |
|
|
- |
57,668,000 |
1,516,777,000 |
768,657,000 |
| Total | 216,434,000 |
0.017 |
0.92 |
3,744,000 |
198,929,000 |
1,516,777,000 |
768,657,000 |
||
2024 Year-End Inferred Resources |
|||||||||
| Grade | Contained | ||||||||
| Gold | Silver | Zinc | Lead | Gold | Silver | Zinc | Lead | ||
| Short tons | (oz/t) | (oz/t) | (%) | (%) | (oz) | (oz) | (lbs) | (lbs) | |
| INFERRED RESOURCES | |||||||||
| Las Chispas | 1,276,000 |
0.113 |
7.91 |
- |
- |
144,000 |
10,088,000 |
- |
- |
| Palmarejo | 6,577,000 |
0.098 |
5.28 |
- |
- |
643,000 |
34,748,000 |
- |
- |
116,521,000 |
0.002 |
0.36 |
- |
- |
258,000 |
41,838,000 |
- |
- |
|
993,000 |
0.230 |
- |
- |
- |
228,000 |
- |
- |
- |
|
| Wharf | 26,735,000 |
0.018 |
- |
- |
- |
470,000 |
- |
- |
- |
| Silvertip | 2,345,000 |
- |
6.86 |
|
|
- |
16,084,000 |
481,791,000 |
199,815,000 |
| Wilco | 25,736,000 |
0.021 |
0.13 |
- |
- |
531,000 |
3,346,000 |
- |
- |
| Total | 180,185,000 |
0.013 |
0.46 |
2,273,000 |
106,104,000 |
481,791,000 |
199,815,000 |
||
Notes to above Mineral Resources:
- Certain definitions: The term “resource” means that it is a concentration or occurrence of material of economic interest in or on the Earth’s crust in such form, grade or quantity that there are reasonable prospects for economic extraction. Inferred, Indicated, and Measured resources are in order of increasing confidence based on level of underlying geological evidence. The term ‘inferred resource’ is that part of a mineral resource for which quantity and grade or quality are estimated on the basis of limited geological evidence and sampling. The term “limited geological evidence” means evidence that is only sufficient to establish that geological and grade or quality continuity is more likely than not. The level of geological uncertainty associated an inferred mineral resource is too high to apply relevant technical and economic factors likely to influence the prospects of economic extraction in a manner useful for evaluation of economic viability and must have a reasonable expectation that the majority of inferred mineral resources could be upgraded to indicated or measured mineral resources with continued exploration. In addition, no assurances can be given that any mineral resource estimate will ultimately be reclassified as proven or probable mineral reserves or that inferred resources will be upgraded to measured or indicated resources.
- Mineral Resource estimates are reported exclusive of mineral reserves, are current as of December 31, 2024, and are reported using definitions in Item 1300 of Regulation S and were prepared by the Company’s technical staff.
-
Assumed metal prices for 2024 estimated Mineral Resources were
$27.00 $2,100 $1.30 $1.00 -
Palmarejo Mineral Resource estimates use the following key input parameters: assumption of conventional longhole underground mining; reported above a variable gold equivalent cut-off grade that ranges from 1.83–2.10 g/t AuEq; metallurgical recovery assumption of
92.0% for gold and83.0% for silver; variable mining costs that range fromUS .67–US$57 $74.45 /tonne, surface haulage costs ofUS /tonne, process costs of$4.29 US /tonne, general and administrative costs of$31.06 US /tonne, and surface/auxiliary support costs of$15.95 US /tonne. Excludes the impact of the Franco-Nevada gold stream agreement at Palmarejo in calculation of Mineral Resources.$4.42 -
Kensington Mineral Resource estimates use the following key input parameters: Mineral Resource estimates use the following key input parameters: metal price of
$2,300 94.2% ; gold payability of97.5% , mining costs ofUS /ton mined; process costs of$116.09 US /ton processed; general and administrative costs of$55.14 US /ton processed; sustaining capital$53.18 US /ton processed; and concentrate refining and shipping costs of$4.50 US /oz sold.$97.48 -
Wharf Mineral Resource estimates use the following key input parameters: assumption of conventional open pit mining; reported above a gold cut-off grade of 0.008 oz/ton Au; average metallurgical recovery assumption of
78.0% across all rock types; royalty burden ofUS /oz Au; pit slope angles that vary from 34–50º; mining costs of$140.40 $2.56 US /ton processed (includes general & administrative and sustaining capital costs).$12.02 -
Rochester Mineral Resource estimates are tabulated within a confining pit shell and use the following input parameters:
Rochester oxide variable recovery Au = 77.7–85.9% and Ag =59.4% ;Rochester sulfide variable recovery Au = 15.2–77.7% and Ag = 0.0–59.4% ; with a net smelter return cutoff of$3.76 US /ton sulfide; Nevada Packard oxide recovery Au =$3.86 92.0% and Ag =61.0% ; with a net smelter return cutoff of$4.24 63.9% and Ag =39.5% ; with a net smelter return cutoff of$4.53 -
Silvertip Underground Mineral Resource estimates are reported using a net smelter return (“NSR”) cutoff of
US /tonne. Mineral Resources are reported insitu using the following assumptions: The estimates use the following key input parameters: lead recovery of 89$130 -90% , zinc recovery of 82-83% and silver recovery of 83-84% . Lead concentrate grade of 53-54% ; zinc concentrate grade of 56-57% ; mining costs ofUS /tonne; processing costs of$68.77 US /tonne and$58.20 US /tonne, where the NSR ($/tonne) = tonnes x grade x metal prices x metallurgical recoveries – royalties – TCRCs – transport costs over the life of the mine. 2023 metal prices were used to determine the mineral resource which were$46.49 $25.00 $1.30 $1.00 -
Wilco Open Pit Mineral Resource estimates are reported using an equivalent gold cutoff of 0.20 ounces per ton assuming a silver to gold ratio of 60:1. Resources are reported in-situ and contained withed a conceptual measured, indicated and inferred optimized pit shell. Silver price of
US /oz, gold price of$20 US /oz. Average oxide and sulfide gold recovery is$1,400 70% , average carbonaceous gold recovery is50% . Average oxide and sulfide gold recovery is60% . Average carbonaceous silver recovery is50% . Open pit mining cost isUS /ton, processing and processing and general and administrative cost is$1.50 US /ton; average pit slope angles of 50º. The technical and economic parameters are those that were used in the 2018 Resource Estimation. Based on the QPs review of the estimate, there would be no material change to the mineral resources if a gold price of$5.46 US /oz, a silver price of$1,700 US /oz or economic parameters were updated. Therefore the 2018 Mineral Resource report is considered current and is presented unchanged.$22 -
Las Chispas Mineral Resource estimates uses the following key input parameters: assumption of conventional underground mining; reported above a silver cut-off grade of 205 g / tonne silver equivalent and an incremental development cut-off grade of 54 g / tonne AgEq; metallurgical recovery assumption of
97.5% for silver and98.0% for gold; mining loss of2% for development and5% for stoping was applied, additional losses have been included to account for the required pillars in uphole stopes that cannot be filled; variable production mining costs that range fromUS .06–US$58 $239.51 /t, development mining costs ofUS /t, process costs of$27.40 US /t, site general and administrative costs of$45.72 US /t, underground general and administrative costs of$20.70 US /t, and sustaining capital costs of$12.81 US /t.$7.64 - Rounding of short tons, grades, and troy ounces, as required by reporting guidelines, may result in apparent differences between tons, grades, and contained metal contents.
Conversion Table |
||
1 short ton |
= |
0.907185 metric tons |
1 troy ounce |
= |
31.10348 grams |
View source version on businesswire.com: https://www.businesswire.com/news/home/20250218581271/en/
For Additional Information
Coeur Mining, Inc.
200 S. Wacker Drive, Suite 2100
Attention: Jeff Wilhoit, Senior Director, Investor Relations
Phone: (312) 489-5800
www.coeur.com
Source: Coeur Mining